Mplfinance: How to number the candles?
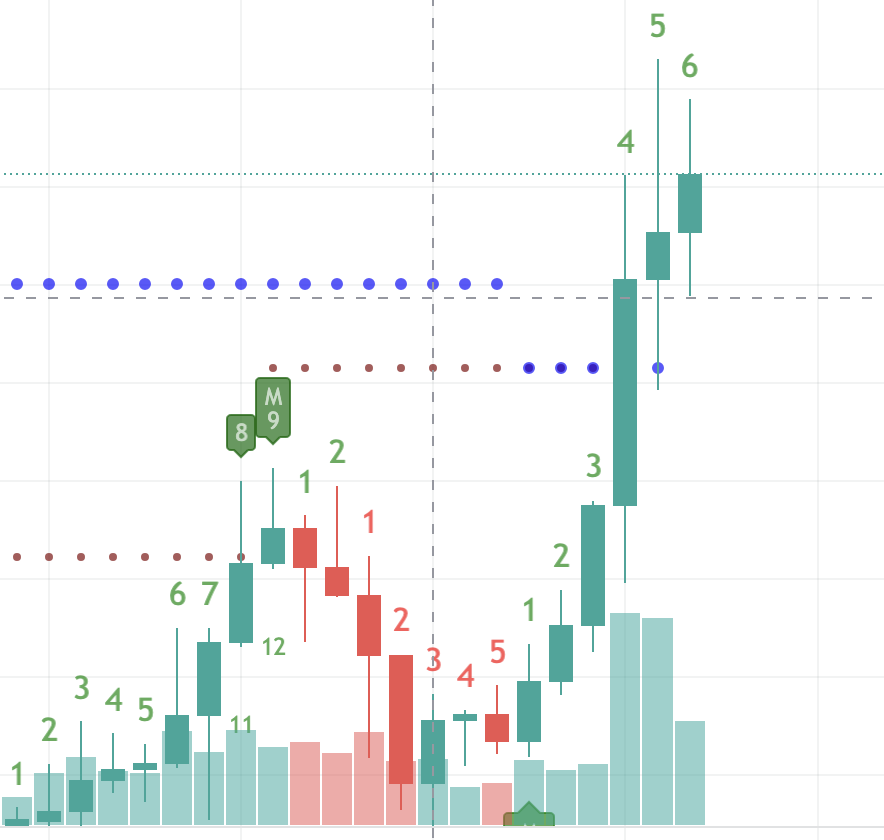
I would like to number the candles according to some indicators, but I do not know how to?
For example (TD Sequantial Indicator):
 ismailbayram
All 4 comments
@ismailbayram
Ismail,
There are a couple of different ways to do this. First make sure you are familiar with mplfinance additional plot functionality.
The simplest method is to use
mpf.make_addplot(data,type=scatter)to make a scatter plot where the scatter markers are the numbers that you want. You can see examples of how to do this by clicking here.
(Also, you can find several links for more information about custom scatter markers in this comment to issue 97).Alternatively you can use
Axes.text(). This requires first that you gain access to mplfinance's Axes objects. After that, you can find an example in the following two comments:
I hope that helps. All the best.
--Daniel
 DanielGoldfarb
on 5 Apr 2021
DanielGoldfarb
on 5 Apr 2021
Thank you very much. This reply is very helpful.
ismailbayram
on 5 Apr 2021
@DanielGoldfarb the addplot / scatterplot is super easy to use, but unfortunately only for numbers under 10.
So, @ismailbayram in case you need a decimal point or 2 digits, you have to use the text() method.
 fxhuhn
on 6 Apr 2021
fxhuhn
on 6 Apr 2021
@fxhuhn , Yes it gets trickier with 2 or more digit numbers, or with decimal. You can do it, for example setting scatter marker to $12$ or to $123$, however then the scatter marker may get smaller and you have to increase its size to make it more visible. At that point it may be just as easy to use text() which ultimately prints numbers more clearly anyway.
DanielGoldfarb
on 6 Apr 2021
Related issues
 mattcambs
·
3Comments
mattcambs
·
3Comments
 franklee00
·
4Comments
franklee00
·
4Comments
 simonholzapfel
·
5Comments
simonholzapfel
·
5Comments
 obahat
·
3Comments
obahat
·
3Comments
 Full4me
·
3Comments
Full4me
·
3Comments
Most helpful comment
@ismailbayram
Ismail,
There are a couple of different ways to do this. First make sure you are familiar with mplfinance additional plot functionality.
The simplest method is to use
mpf.make_addplot(data,type=scatter)to make a scatter plot where the scatter markers are the numbers that you want. You can see examples of how to do this by clicking here.(Also, you can find several links for more information about custom scatter markers in this comment to issue 97).
Alternatively you can use
Axes.text(). This requires first that you gain access to mplfinance's Axes objects. After that, you can find an example in the following two comments:I hope that helps. All the best.
--Daniel