Mplfinance: Bug Report: Candlestick too short
When values of y-axis vertical too small 0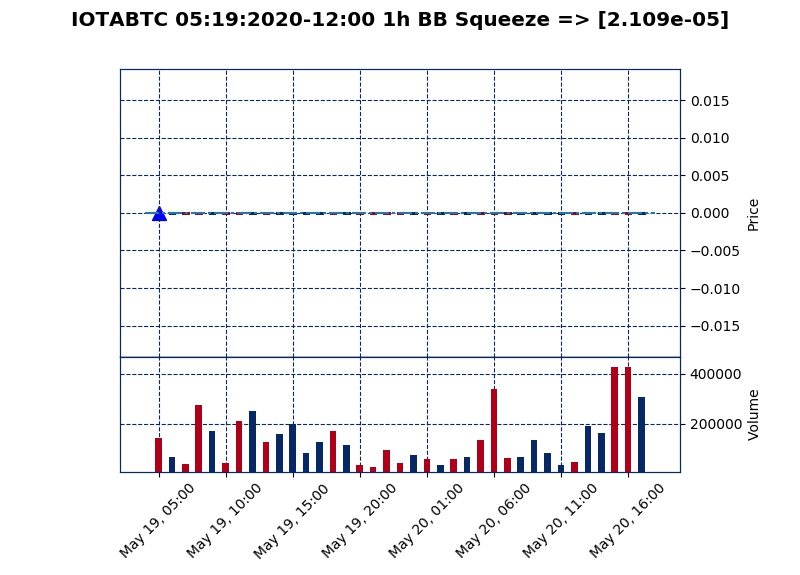
 toanalien
All 8 comments
I workaround and found solution:
ymin = df.loc[df['Low'].idxmin()]['Low']
ymax = df.loc[df['High'].idxmax()]['High']

mpf.plot(df,
    type='candle',
    style='starsandstripes',
    ...
    set_ylim=(ymin, ymax)
)
Thiên,
Thank you for reporting this issue. Can you please provide the exact data and exact code you used for this plot so that I can be sure to be able to reproduce the bug exactly? Also, please provide the output from mpf.__version__.
Thank you. --Daniel
 DanielGoldfarb
on 20 May 2020
DanielGoldfarb
on 20 May 2020
Thank @DanielGoldfarb quick reply!
mpf.__version__)
0.12.4a2
I fetched data from Binance
Date,Open,High,Low,Close,Volume
2020-05-19 09:00:00,2.11e-05,2.118e-05,2.106e-05,2.113e-05,324959.0
2020-05-19 10:00:00,2.114e-05,2.119e-05,2.107e-05,2.118e-05,400205.0
2020-05-19 11:00:00,2.119e-05,2.119e-05,2.094e-05,2.11e-05,1004006.0
2020-05-19 12:00:00,2.114e-05,2.133e-05,2.109e-05,2.121e-05,735355.0
2020-05-19 13:00:00,2.121e-05,2.125e-05,2.112e-05,2.116e-05,225666.0
2020-05-19 14:00:00,2.118e-05,2.122e-05,2.102e-05,2.111e-05,200795.0
2020-05-19 15:00:00,2.112e-05,2.132e-05,2.103e-05,2.13e-05,491363.0
2020-05-19 16:00:00,2.128e-05,2.132e-05,2.11e-05,2.124e-05,418583.0
2020-05-19 17:00:00,2.124e-05,2.136e-05,2.122e-05,2.127e-05,420179.0
2020-05-19 18:00:00,2.129e-05,2.131e-05,2.116e-05,2.12e-05,258836.0
2020-05-19 19:00:00,2.12e-05,2.133e-05,2.117e-05,2.124e-05,177158.0
2020-05-19 20:00:00,2.125e-05,2.133e-05,2.121e-05,2.125e-05,300338.0
...
https://gist.github.com/toanalien/62a3740b934c21c5e6d30691f97c9a20
toanalien
on 21 May 2020
Issue when I add a plot scatter.
toanalien
on 21 May 2020
Thiên,
Thank you for posting your the data.
Without seeing the other data that you are using for your addplot scatter, I cannot know for sure, but I suspect that the _max and min of the scatter data_ has a much larger spread that the OHLCV data that you posted.
If so, then adding secondary_y=True to your addplot scatter should fix the problem.
I would very much like to see the addplot scatter data, because "in theory" mplfinance tries to determine whether or not to automatically use a secondary_y for the additional data. In this case it appears possibly to be getting it wrong. That is the reason we have to ability to force secondary_y to be either True or False (instead of "auto").
I would also recommend you use the version 0.12.4a0 since that is currently the most stable version, and is the version currently published to Pypi.
Fyi, here is my code, trying to reproduce your problem, and the plot it produces:
$ ipython
Python 3.7.4 (default, Aug 13 2019, 20:35:49)
Type 'copyright', 'credits' or 'license' for more information
IPython 7.8.0 -- An enhanced Interactive Python. Type '?' for help.

In [1]: import mplfinance as mpf

In [2]: mpf.__version__
Out[2]: '0.12.4a0'

In [3]: import pandas as pd

In [4]: idf = pd.read_csv('issue#142_data.csv',index_col=0,parse_dates=True)

In [5]: idf.shape
Out[5]: (41, 5)

In [6]: idf.head(3)
Out[6]:
                         Open      High       Low     Close     Volume
Date
2020-05-19 09:00:00  0.000021  0.000021  0.000021  0.000021   324959.0
2020-05-19 10:00:00  0.000021  0.000021  0.000021  0.000021   400205.0
2020-05-19 11:00:00  0.000021  0.000021  0.000021  0.000021  1004006.0

In [7]: idf.tail(3)
Out[7]:
                         Open      High       Low     Close    Volume
Date
2020-05-20 23:00:00  0.000021  0.000021  0.000021  0.000021  385498.0
2020-05-21 00:00:00  0.000021  0.000022  0.000021  0.000021  532283.0
2020-05-21 01:00:00  0.000021  0.000022  0.000021  0.000021  172228.0

In [8]: mpf.plot(idf,volume=True,type='candle',style='starsandstripes')
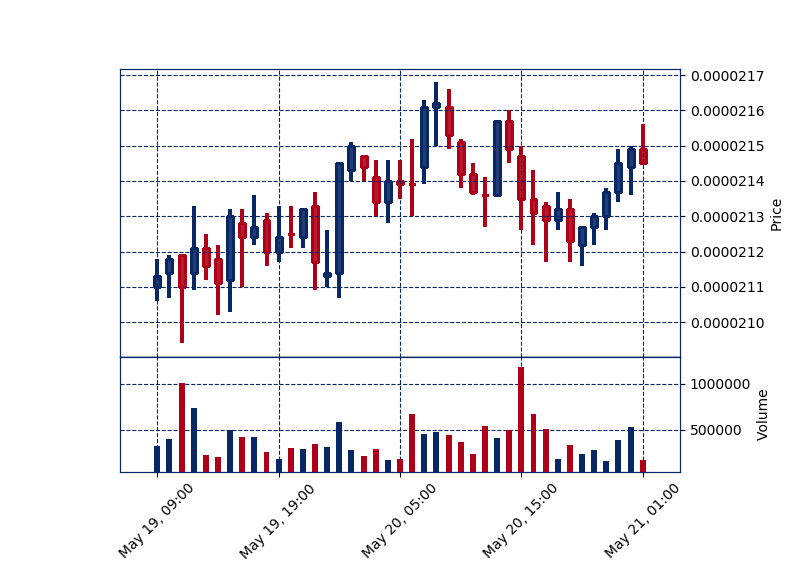
DanielGoldfarb
on 21 May 2020
I did some more testing and I am able to reproduce the problem by creating a scatter plot of just highs. So the order of magnitude is clearly the same. Use secondary_y=True or set_ylim as a workaround for the issue. Either one one works (no need to use both).
This appears to be the exact same issue as reported here.
I think the issue is with matplotlib itself, and how it may handle ylimits differently for scatter plots versus other types of plots.
I tried to reproduce the issue _outside of mplfinance_, to find a very simple case that I can then post to the matplotlib issues page. Originally I thought I had reproduced it, but then was not able to again. (I must have changed something). I then put the issue aside to work on other stuff, intending to come back to it later. That's where it stands now.
DanielGoldfarb
on 21 May 2020
I forgot that @free-soellingeraj figured out that upgrading to matplotlib v3.2.1 fixes the issue.
I have confirmed on my own machine that sudo pip install --upgrade matplotlib fixes the problem.
DanielGoldfarb
on 21 May 2020
Thank you for your quick reply. Problem solved by upgrade matplotlib.
toanalien
on 21 May 2020
Related issues
 cleitonmoya
·
5Comments
cleitonmoya
·
5Comments
 kitt-th
·
5Comments
kitt-th
·
5Comments
 toksis
·
5Comments
toksis
·
5Comments
 skfnxh
·
3Comments
skfnxh
·
3Comments
 tessanix
·
5Comments
tessanix
·
5Comments