Model-viewer: Object disappears after switching tabs
Description
I'm getting a strange issue where the model disappears when i switch tabs, wait a bit, then come back:

I'm seeing this on https://model-viewer.glitch.me/
What's very bizarre is that the object doesn't just disappear. It's as if the exposure ramps up to the point where everything is white.
It happens fast, so here is a closeup of it happening in slo-mo:
Live Demo
- Visit https://model-viewer.glitch.me/
- Switch tabs
- Wait around 30s
- Come back
Browser Affected
I only tested in Chrome
- [x] Chrome (79.0.3945.88)
- [ ] Edge
- [ ] Firefox
- [ ] Helios
- [ ] IE
- [ ] Safari
OS
- [ ] Android
- [ ] iOS
- [ ] Linux
- [x] MacOS (10.15.1)
- [ ] Windows
Versions
- model-viewer: v0.8.0
- three.js: r110
 pushmatrix
All 34 comments
Hmm I just got this issue with 0.7.0 and I've never seen it happen before. Maybe something with new Chrome?
So strange how it does the exposure fade off

pushmatrix
on 7 Jan 2020
@pushmatrix I can confirm a repro; that's very strange!
 elalish
on 8 Jan 2020
elalish
on 8 Jan 2020
Yikes. Investigating.
 cdata
on 8 Jan 2020
cdata
on 8 Jan 2020
Current status:
@elalish can repro on his MBP, but I cannot repro on mine.
@elalish reports Safari and Firefox unaffected on his machine.
cdata
on 8 Jan 2020
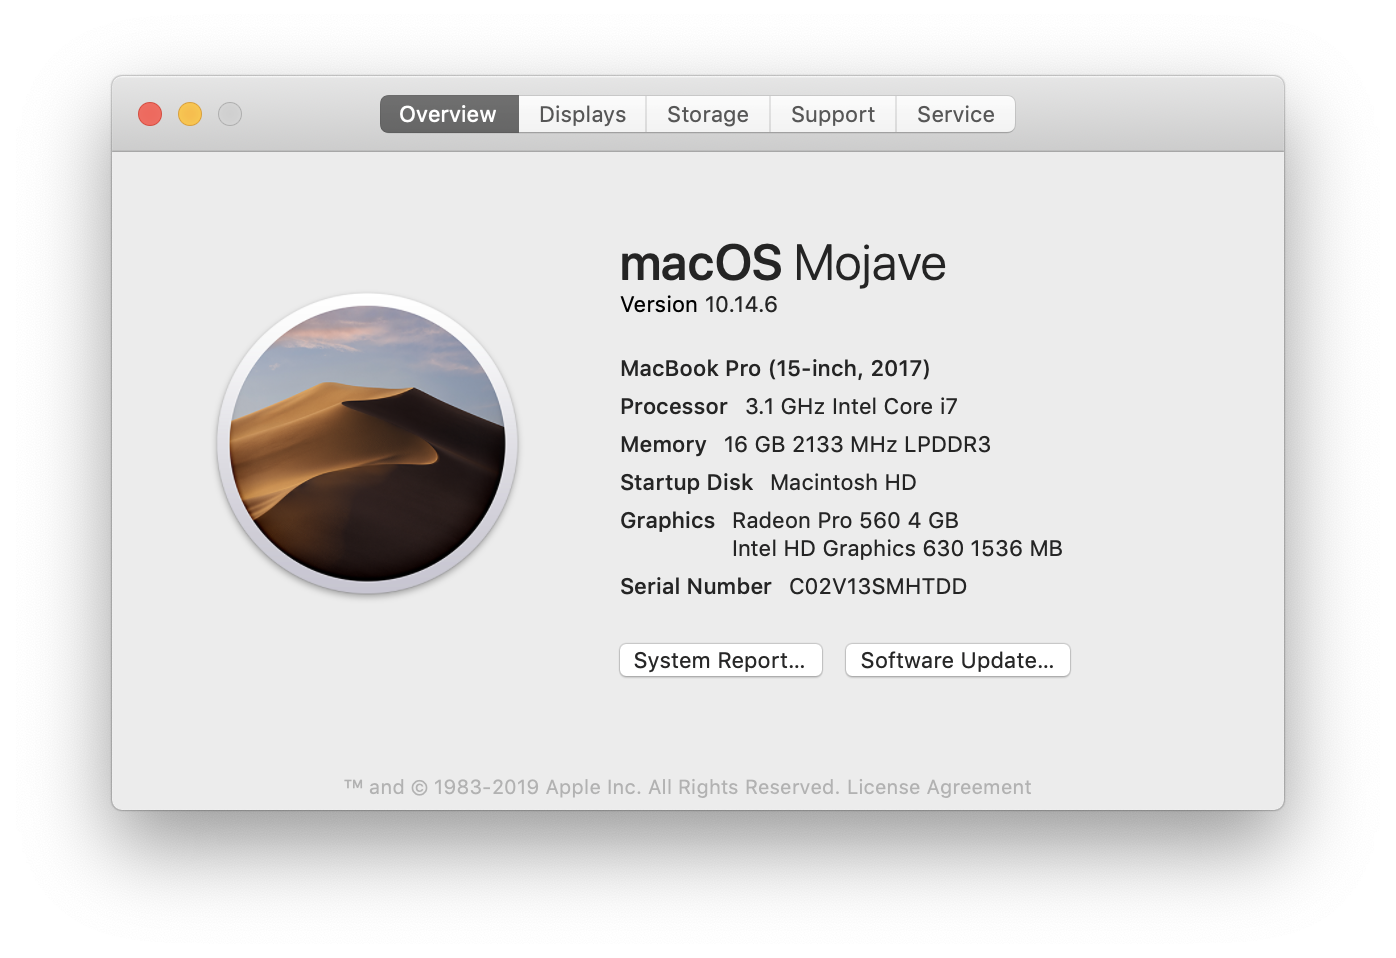
My MBP:
cdata
on 8 Jan 2020
Yeah I'm only seeing this in Chrome. I'm gonna browserstack an old version to see if its happening there. It shouldnt.
pushmatrix
on 8 Jan 2020
I tried to repro in Catalina and Mojave in stable Chrome on Browserstack and nothing happened.
cdata
on 8 Jan 2020
@pushmatrix You mentioned both 0.8 and 0.7; is this really happening in both, or just 0.8?
elalish
on 8 Jan 2020
@elalish Yeap, I'm seeing it here: https://tryit.media/
pushmatrix
on 8 Jan 2020
I was finally able to repro in stable Chrome on my MBP. The reason I could not repro was apparently because I had automatic graphics switching disabled. After enabling it, I restarted Chrome and tracked GPU usage to ensure that it switched GPUs to Intel while attempting the repro. Here is an annotated graph from Activity Monitor:
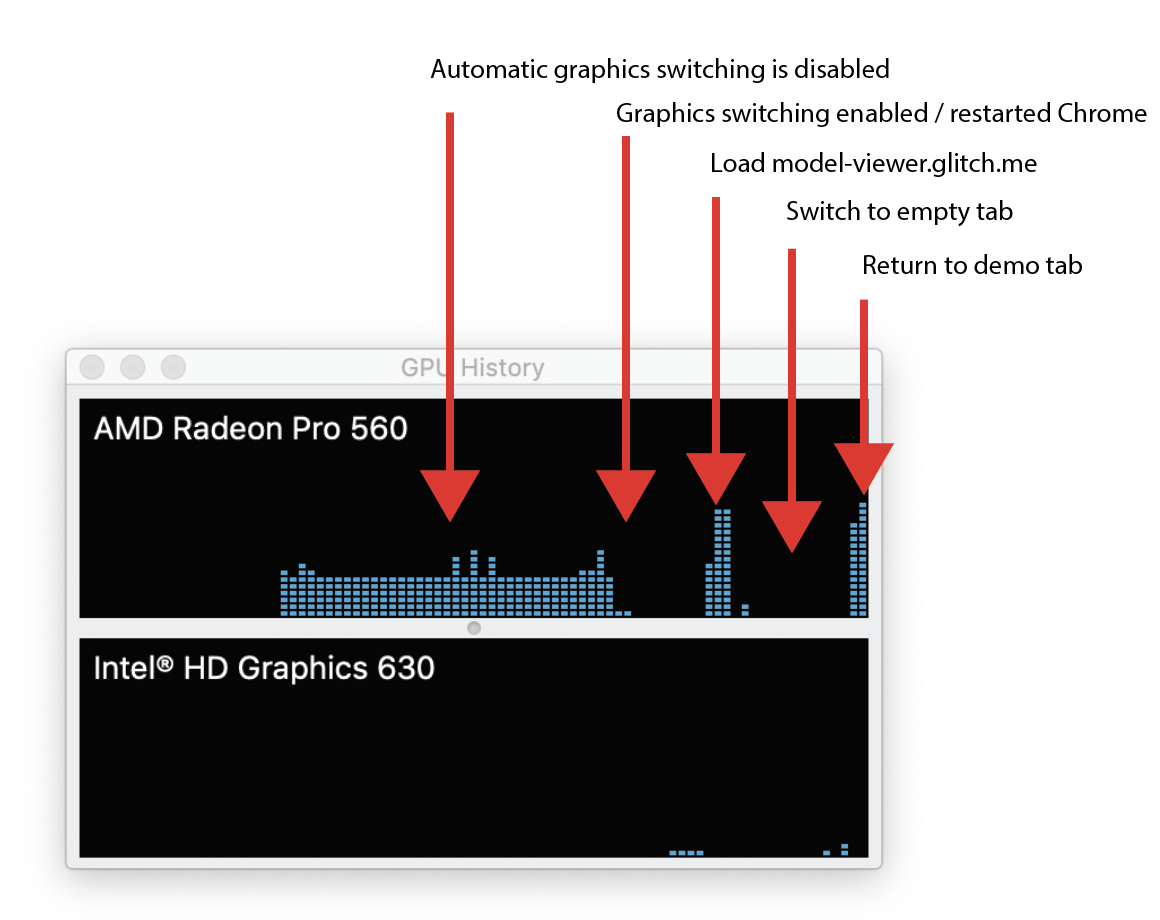
This is starting to have the strong smell of a Chrome bug. However, we cannot repro on a vanilla Three.js example (been trying with this one).
One remaining thing I would like to rule out is the 2D context we use in our render path.
cdata
on 8 Jan 2020
Oh that's interesting findings. One thing I have noticed is that now when switching to a webgl tab there's a noticeable hangup / hitch before the tab switches. Wasn't there before.
pushmatrix
on 8 Jan 2020
Yah, I'm seeing a big spike in GPU activity if I do any kind of graphics switching behavior while changing tabs.
cdata
on 8 Jan 2020
Made a version of the build that forces our internal canvas to be HTMLCanvasElement, dumps it onto the page and skips the 2D context drawImage step. It looks like our internal GL canvas is affected: https://uncovered-stygimoloch.glitch.me/gl-only.html
cdata
on 8 Jan 2020
I was able to find a relatively reduced case that repros the problem with vanilla-ish Three.js. Here is a PMREM example @elalish put together a while back that I can break with the repro steps: https://threejs.org/examples/webgl_pmrem_test.html
Interestingly, what happens for me is that initially it seems unaffected by the bug, but then when I mouse out of the tab everything breaks.
cdata
on 8 Jan 2020
Ooo good find! I can repro with that too.
pushmatrix
on 8 Jan 2020
Nice, I repro that as well.
elalish
on 8 Jan 2020
Although it is @elalish code which means we can't rule out @elalish as the culprit 😜
pushmatrix
on 8 Jan 2020
I have further reduced that demo, to the point that exonerates @elalish I think 😅
Here is a yet-more-reduced case that doesn't use PMREM and only applies basic configurations to the renderer: https://uncovered-stygimoloch.glitch.me/basic-three-repro.html
Also removed overlapping DOM and camera controls.
cdata
on 8 Jan 2020
While performing further reductions, I hit a "cannot repro" wall when removing the directional light. I guess once the directional light is gone, my laptop no longer switches to the AMD GPU, so I cannot trigger the bug 🤷♂️
cdata
on 8 Jan 2020
Can you switch it manually?
elalish
on 8 Jan 2020
Not that I am aware of. I rebooted Chrome (I had been killing the GPU process from time to time) in the hopes that it would wipe internal state. Now I can repro without the directional light, so I am back on track.
cdata
on 9 Jan 2020
Okay, I may have identified the culprit. If I remove the antialias configuration when creating the WebGLRenderer, I can no longer repro the issue. I'll try to create a test case that demonstrates this.
cdata
on 9 Jan 2020
I think I am getting into territory where things are a bit uncertain. I have written this yet-more-minimal test case that uses raw WebGL (no Three.js at all): https://uncovered-stygimoloch.glitch.me/raw-gl.html
In this case, it is sufficient to set { alpha: false } on the GL context to reproduce the bug. Can anyone else give it a shot and let me know if that test case repros the issue for them? @elalish @pushmatrix
cdata
on 9 Jan 2020
Yup, I repro that.
elalish
on 9 Jan 2020
Can confirm as well.
pushmatrix
on 9 Jan 2020
Looks like this issue was hit almost a month ago by another user in the wild. I added our +1 to the bug.
cdata
on 9 Jan 2020
We are planning to release v0.8.1 without a fix for this problem.
@pushmatrix as a potential workaround, you might be able to patch in something like this on behalf of your users (adapted from the Chrome bug thread):
document.addEventListener('visibilitychange', function() {
  if (document.visibilityState !== 'visible') {
    return;
  }
  const modelViewers = Array.from(document.querySelectorAll('model-viewer'));
  modelViewers.forEach(modelViewer => {
    const originalStyle = modelViewer.getAttribute('style');
    const {width} = modelViewer.getBoundingClientRect();
    modelViewer.style.width = `${width+1}px`;
    requestAnimationFrame(() => modelViewer.setAttribute('style', originalStyle));
  });
});
@cdata Does that work for you on https://model-viewer.glitch.me/? I tried it and i still get it disappearing
pushmatrix
on 9 Jan 2020
@pushmatrix I admit I didn't test it, but I do see the glitch recovering if the canvas resizes (and this was also reported in the crbug). I'll try to test it out in a bit.
cdata
on 9 Jan 2020
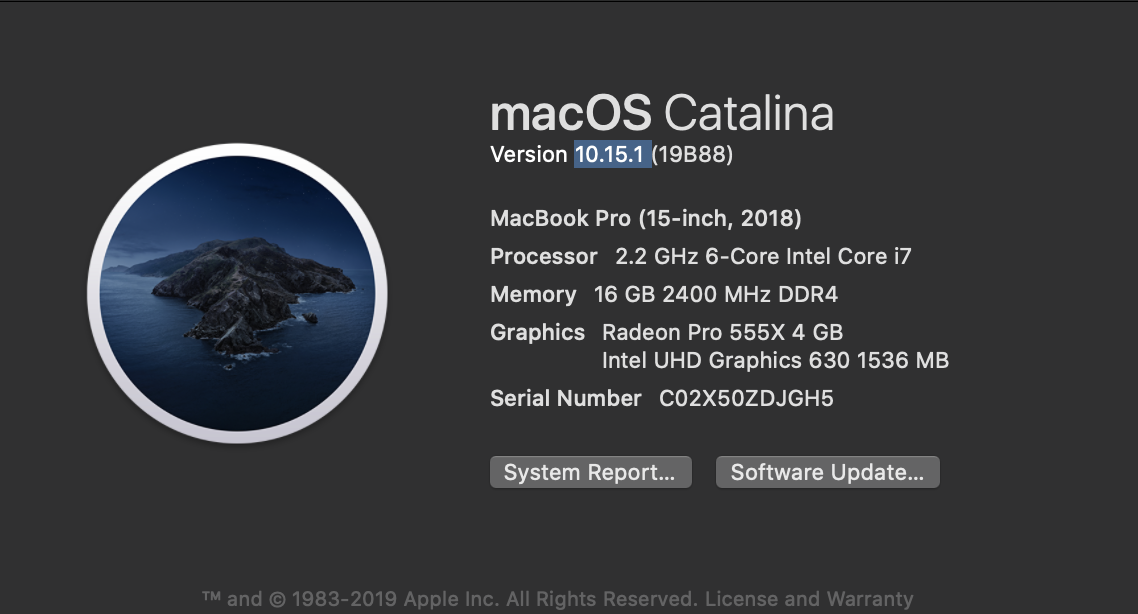
I'm (easily) able to reproduce this on Chrome 79.0.3945.117 however Firefox 71.0 and Safari 13.0.4 (15608.4.9.1.3) seem to be OK (which does make sense if this is a Chromium based issue.) All on Catalina 10.15.2 / Macbook Pro 15, 2016.
 richardmonette
on 14 Jan 2020
richardmonette
on 14 Jan 2020
Thanks for the report @richardmonette . It might be helpful for any investigating Chrome engineers if you could share your GPU as well (screenshot of About This Mac is probably fine).
cdata
on 14 Jan 2020
On the About This Mac page it says Intel HD Graphics 530 1536 MB but digging a bit I also have AMD Radeon Pro 450. I currently have automatic graphics switching turned ON in Power Management settings.
richardmonette
on 14 Jan 2020
I quickly tried this out on some non-laptops here. I was _unable_ to produce using the above methods and Chrome 79.0.3945.117 on a Mac Pro with a Radeon Pro Vega 56 running MacOS 10.15.2. Same with a windows 10 PC with an Nvidia 1080Ti.
 JonathanWade
on 16 Jan 2020
JonathanWade
on 16 Jan 2020
Closed because this is being fixed in Chrome
cdata
on 3 Feb 2020
Related issues
cdata
·
19Comments
 ebrayton
·
37Comments
ebrayton
·
37Comments
 jsantell
·
17Comments
jsantell
·
17Comments
 burungiu
·
20Comments
cdata
·
15Comments
burungiu
·
20Comments
cdata
·
15Comments