Mini-graph-card: Daily bar chart
Feature request:
It would be great to be able to make a daily bar chart.
I can currently set a 24hr bar chart but it would be great if the period could be locked to a set period e.g. midnight to midnight.
My use case for this would be to show energy usage for the last 7 days from a cumulative energy sensor. The current day would only show the usage from midnight.
 tinglis1
All 18 comments
Yes indeed, that would be a great and useful feature.
 kalkih
on 2 Apr 2019
kalkih
on 2 Apr 2019
I agree as well, this would be awesome! For example for creating charts of the min and max temperature along the week, or to display the power consumption of the last N months, so on so forth.
 mrkrb
on 3 Apr 2019
mrkrb
on 3 Apr 2019
Would be very useful indeed, for me personally to visualize my hours at work on a daily basis (based on device tracking)
 NicoBijl
on 29 Apr 2019
NicoBijl
on 29 Apr 2019
Definitely needed :-) e.g., to present readings of utility meters, etc. If I am not mistaken, currently to plot daily use over one week period, one would set bar plot with hours_to_show: 168 and points_per_hour: 1/24 This however causes smoothing and bars are not exact (i.e., they do not show recorded values).
 rzolau
on 8 May 2019
rzolau
on 8 May 2019
Something that could fit well with this would be an option for a pie chart - who doesn't need more pie charts in their life?
 mynameisdaniel32
on 22 May 2019
mynameisdaniel32
on 22 May 2019
My use case would be to view the distance traveled with my car per day in a bar chart.
 arnoldpistorius
on 8 Jun 2019
arnoldpistorius
on 8 Jun 2019
+1 For displaying my daily utility totals (they reset at midnight)
 kaosmagix
on 25 Jun 2019
kaosmagix
on 25 Jun 2019
see also issue #77
kaosmagix
on 25 Jun 2019
+1 For displaying my daily energy consumption.
 geniusve
on 7 Oct 2019
geniusve
on 7 Oct 2019
I needed it too. Started working on the change today and it looks like I have a working code already. Once I test it and make it prod ready will send PR (probably over the weekend)
 maxwroc
on 10 Oct 2019
maxwroc
on 10 Oct 2019
PR sent and waiting for review
maxwroc
on 12 Oct 2019
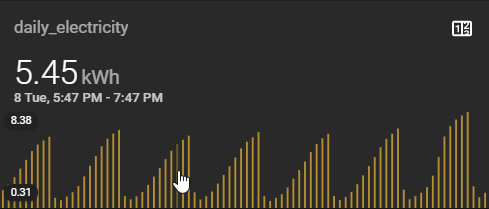
Just tried the new bar chart and I can't get it working correctly:
      - type: custom:mini-graph-card
        entities:
          - entity: sensor.daily_electricity
        name: Energy consumption
        hours_to_show: 168
        aggregate_func: max
        group_by: date
        show:
          graph: bar
 ACrazyConcept
on 13 Oct 2019
ACrazyConcept
on 13 Oct 2019
It looks like the change is not in your js. Please make sure that your browser doesn't use cached previous version. Do the following:
- in your ui-lovelace.yaml add version ("v") param int he url e.g.
yaml resources: url: /community_plugin/mini-graph-card/mini-graph-card-bundle.js?v=0.7.1 - refresh lovelace UI by clicking on ".." up-right corner of your Home Assistant and then click "Refresh"
- force your browser to download fresh resources by using Ctrl+F5 combination
Please let me know if that helps.
One more important thing: I think that @kalkih has not released the new version of this plugin yet so if you're not using code from "dev" branch it won't be working yet.
maxwroc
on 13 Oct 2019
@maxwroc is correct, this hasn't been released yet, if you want to use it right now you would have to build the dev branch from source.
kalkih
on 13 Oct 2019
@maxwroc is correct, this hasn't been released yet, if you want to use it right now you would have to build the dev branch from source.
Oh ok then. I don't think I know how to do that though.
Tried your suggestion @maxwroc, but made no difference.
Guess I'll have to wait for release :)
ACrazyConcept
on 13 Oct 2019
@ACrazyConcept I might have a temporary workaround until the feature is released. Try this and see if it works for the time being:
      - type: custom:mini-graph-card
        entities:
          - entity: sensor.daily_electricity
        name: Energy consumption
        hours_to_show: 168
        points_per_hour: 0.04166666667
        aggregate_func: max
        group_by: date
        show:
          graph: bar
This will set the graph to only display one bar per day. If you're curious, 0.041666 (repeating) is the result of 1 divided by 24.
 dale3h
on 18 Oct 2019
dale3h
on 18 Oct 2019
@dale3h this actually doesn’t work very well because of the following resons:
- single point is calculated based on the average value so what you will see is probably far from what you expect
- values are not grouped by day but by 24h buckets going backwards, starting from now; so the effect will be that all the bars from the previous days will be fluctuating when you will be watching them through the day
Usually main goal of such graph is to be able to check whether energy usage from one day was bigger/smaller than the other. With graph setup this way you won’t be able to tell that.
That is why I wouldn’t call it a workaround. BTW @rzolau was mentioning this option and its implications few comments above
maxwroc
on 18 Oct 2019
Hello everybody,
This feature is now available in the latest release thanks to @maxwroc!
See Grouping by date for example usage.
kalkih
on 20 Oct 2019
Related issues
 clydefrog76
·
6Comments
clydefrog76
·
6Comments
 Joezi79
·
4Comments
Joezi79
·
4Comments
 WhistleMaster
·
6Comments
WhistleMaster
·
6Comments
 balloob
·
4Comments
balloob
·
4Comments
 yadenisenko
·
4Comments
yadenisenko
·
4Comments