Metabase: feature request: an average line similar to goal line
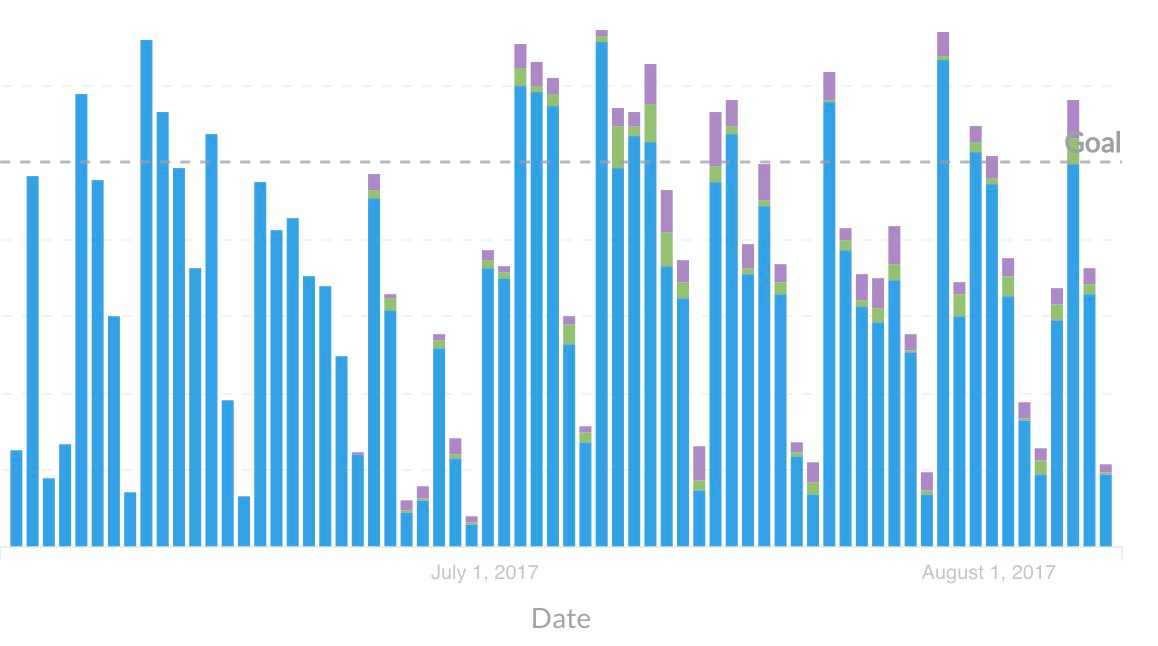
In a bar chart like this we want to be able to have line similar to goal line that would show the average of the values in that time frame:
 alirezastack
All 3 comments
@sbelak + @kdoh things like this might be an interesting "x-ray overlay" ....
 salsakran
on 10 Aug 2017
salsakran
on 10 Aug 2017
That's a really cool idea. It also adds another entry point for x-rays.
 sbelak
on 10 Aug 2017
sbelak
on 10 Aug 2017
I’d like to propose an extension – or several – to the above: It would be even better than having “just” the average number to have the possibility to pick either a rolling average with some window or pick either a linear or quadratic trend.
With the graph you have above @alirezastack you would then not only be able to see if you have fulfilled the goal but if you are moving towards or away from it.
The @salsakran term “x-ray overlay” above really gets my mind going 🎉 .... what if .... the user experience for adding the average/trend overlaid info was just as an analyst to navigate into the existing X-ray feature as shown below and you would then be able to surface the relevant insight for others by “picking and pinning” it back onto the card you came from.
Source: https://metabase.com/blog/Metabase-0.26/
It seems what’s missing to build a minimum viable version of this would be the ability to “pick and pin” into an “x-ray overlay”. Is this in line with what you guys are already thinking?
 jornh
on 16 Dec 2017
jornh
on 16 Dec 2017
Related issues
 prinspark
·
3Comments
prinspark
·
3Comments
 fetanchaud
·
3Comments
fetanchaud
·
3Comments
 mazameli
·
3Comments
mazameli
·
3Comments
mazameli
·
3Comments
mazameli
·
3Comments
mazameli
·
3Comments
mazameli
·
3Comments
Most helpful comment
@sbelak + @kdoh things like this might be an interesting "x-ray overlay" ....