Linkerd2: Dashboard slow and Prometheus using large amount of resources
Bug Report
What is the issue?
LinkerD dashboard is slow to the point of being unusable.
The LinkerD prometheus instance is using a lot of resources:
NAME                                      CPU(cores)   MEMORY(bytes)
linkerd-controller-b57bdb9db-9jp6n        23m          157Mi
linkerd-controller-b57bdb9db-khfjd        23m          161Mi
linkerd-controller-b57bdb9db-vkh24        28m          165Mi
linkerd-grafana-6fbb587b6f-jv62q          4m           30Mi
linkerd-identity-86cb9f8786-7gf6r         1m           23Mi
linkerd-identity-86cb9f8786-k2blg         1m           22Mi
linkerd-identity-86cb9f8786-q8bt5         0m           21Mi
linkerd-prometheus-5797bdfb86-5zdhr       7660m        10090Mi
linkerd-proxy-injector-68b94cc64b-drg25   0m           28Mi
linkerd-sp-validator-55c986b9b9-n4zhd     0m           12Mi
linkerd-web-f95bdcbf9-lqz9t               10m          27Mi
The pods appear to be running w/o any obvious problems such as restarts.
NAME                                      READY   STATUS    RESTARTS   AGE
linkerd-controller-b57bdb9db-9jp6n        4/4     Running   0          4h
linkerd-controller-b57bdb9db-khfjd        4/4     Running   0          4h
linkerd-controller-b57bdb9db-vkh24        4/4     Running   0          4h
linkerd-grafana-6fbb587b6f-jv62q          2/2     Running   0          16h
linkerd-identity-86cb9f8786-7gf6r         2/2     Running   0          16h
linkerd-identity-86cb9f8786-k2blg         2/2     Running   0          16h
linkerd-identity-86cb9f8786-q8bt5         2/2     Running   0          16h
linkerd-prometheus-5797bdfb86-5zdhr       2/2     Running   0          4h
linkerd-proxy-injector-68b94cc64b-drg25   2/2     Running   0          16h
linkerd-sp-validator-55c986b9b9-n4zhd     2/2     Running   0          16h
linkerd-web-f95bdcbf9-lqz9t               2/2     Running   0          4h
I've tried deleting the prometheus pod and letting it restart but the memory and processor almost immediately spikes to around 8GB and 7 CPU and grows to approx. 12-14GB memory after that.
How can it be reproduced?
Current linkerd installation is using -ha and --proxy-auto-inject options
Logs, error output, etc
- 273 pods injected with linkerd proxy
- Running 28 GCE nodes of size n1-standard-8
Client version: stable-2.3.2
Server version: stable-2.3.2
(If the output is long, please create a gist and
paste the link here.)
Prometheus logs
https://gist.github.com/jamesallen-vol/9b50d19f4c61275aac9f49e5e920294a
controller logs
https://gist.github.com/jamesallen-vol/8357577b8547b2582613ebe0ccd06075
linkerd check output
kubernetes-api
--------------
√ can initialize the client
√ can query the Kubernetes API

kubernetes-version
------------------
√ is running the minimum Kubernetes API version
√ is running the minimum kubectl version

linkerd-existence
-----------------
√ control plane namespace exists
√ controller pod is running
√ can initialize the client
√ can query the control plane API

linkerd-api
-----------
√ control plane pods are ready
√ control plane self-check
√ [kubernetes] control plane can talk to Kubernetes
√ [prometheus] control plane can talk to Prometheus
√ no invalid service profiles

linkerd-version
---------------
√ can determine the latest version
√ cli is up-to-date

control-plane-version
---------------------
√ control plane is up-to-date
√ control plane and cli versions match

Status check results are √
Environment
- Kubernetes Version: 1.10.7-gke.2
- Cluster Environment: GKE
- Host OS: Google Container Optimized OS
- Linkerd version: 2.3.2
Possible solution
Additional context
 jamesallen-vol
All 9 comments
We are seeing similar issues on Kubernetes 1.12 running in EKS.
The linkerd-prometheus container resource usage grows continuously while it is running ultimately causing the host node to run out of disk space and evicting the pod. This happens for us about once every 4 hours.
Below is a chart showing one of the nodes it landed on and the available disk space being depleted until the pod is evicted and moves to another node. I'm happy to add additional metrics if they would be helpful in debugging further

The evicted linkerd-prometheus node is evicted with the following message:
The node was low on resource: ephemeral-storage. Container linkerd-proxy was using 472Ki, which exceeds its request of 0. Container prometheus was using 32Ki, which exceeds its request of 0.
Additionally, most other pods running on the node are also evicted due to the lack of disk space.
In an effort to fix this, we have dropped our retention down to 30 minutes and scrape interval to 30s, but neither have curbed the resource usage much.
Please let me know if there is any additional information that I can provide to debug this issue.
 suever
on 13 Jun 2019
suever
on 13 Jun 2019
Thanks for the helpful reports! I'm getting a few things out of this:
- We need to investigate why Prometheus is taking up so many resources and potentially reduce the number of timeseries or the breadth of scraped data;
- We need to set ephemeral-storage requests and limits (at least with
--ha) based on our understanding of the above;
Can you share roughly how many pods are your in clusters over a six hour span?
 olix0r
on 13 Jun 2019
olix0r
on 13 Jun 2019
Thanks for looking into this!
Can you share roughly how many pods are your in clusters over a six hour span?
Allowing myself to reply for @suever here: Our workload is fairly dynamic, during peak we deal with upwards of 1k pods running. So I'd ballpark a few thousand.
Does that help? Otherwise we can dig deeper.
 complex64
on 13 Jun 2019
complex64
on 13 Jun 2019
@complex64 thanks, that's helpful as a starting point. we'll probably have some more questions as we dig into this.
olix0r
on 13 Jun 2019
@complex64 @suever Thanks for all the detail. A few more questions:
Knowing you folks are running upwards of 1k pods is helpful. Can you estimate how many namespaces, deployments, and services that is across?
Are you observing this behavior when the Linkerd dashboard and/or Grafana is open? What if neither of those views are open? I'm wondering if this is a read-side issue with the dashboards putting too much pressure on Prometheus. Any other automated scripts querying this Prometheus instance?
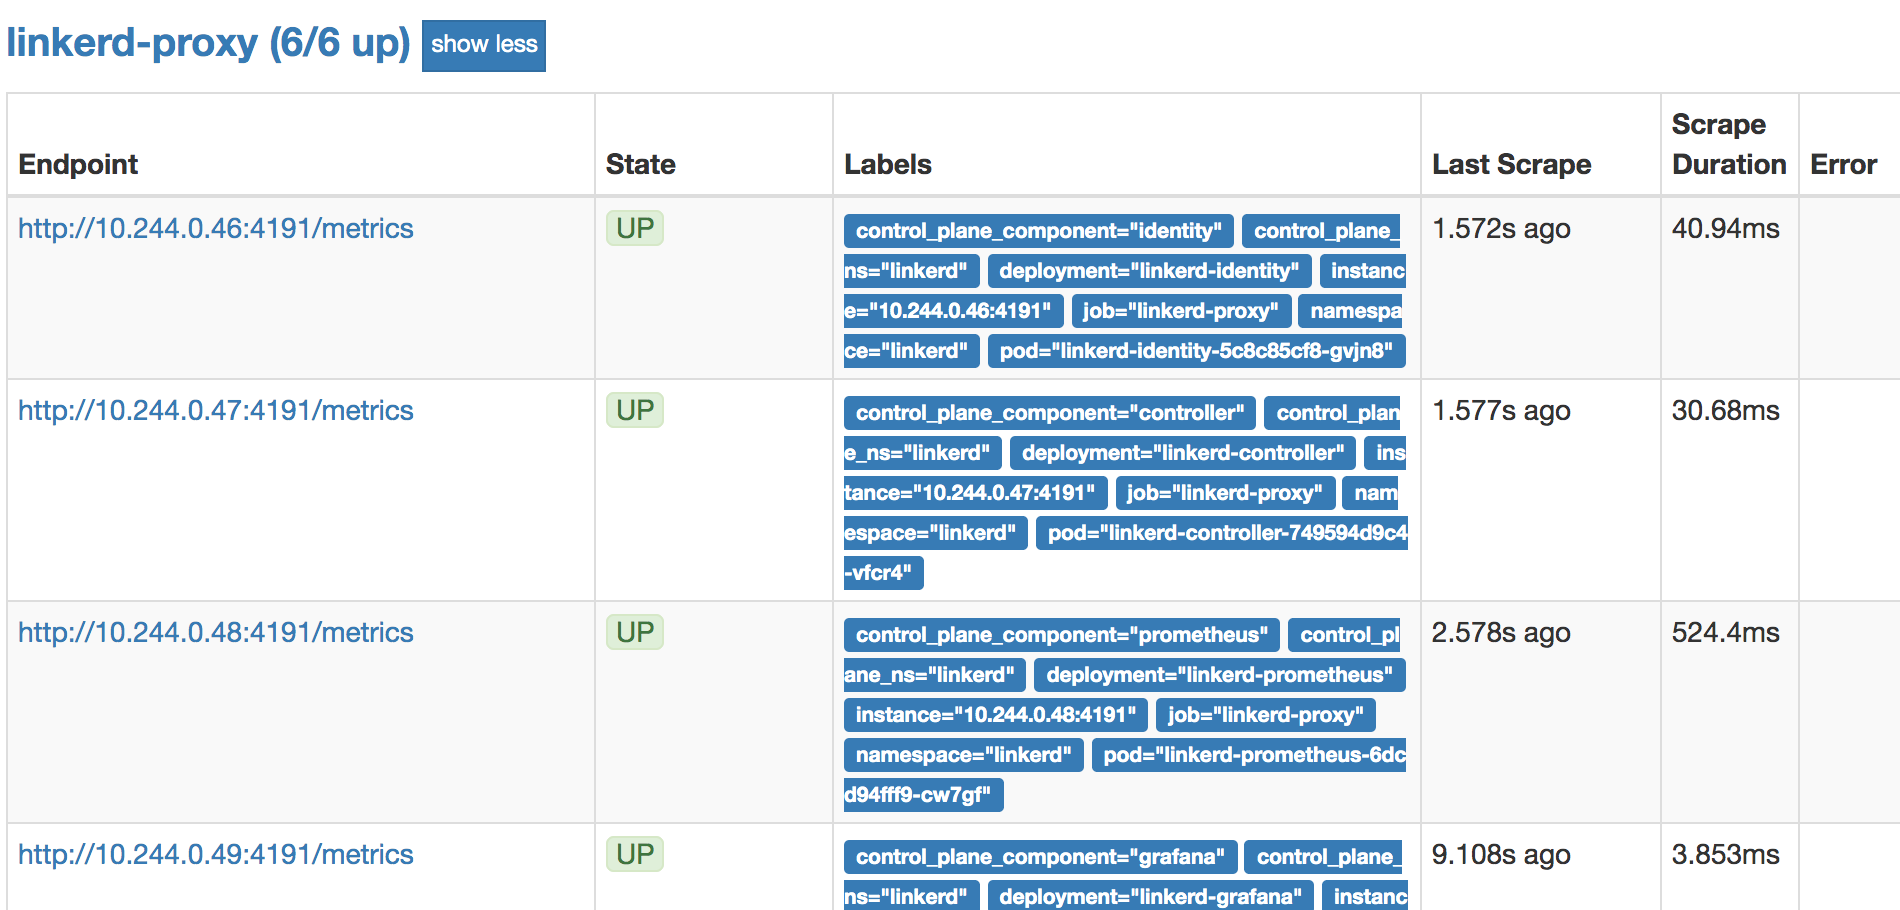
To confirm whether Prometheus' write-side is healthy, run:
kubectl -n linkerd port-forward svc/linkerd-prometheus 9090
... browse to http://localhost:9090/targets and then screenshot the top of the linkerd-proxy section. It should look something like this:
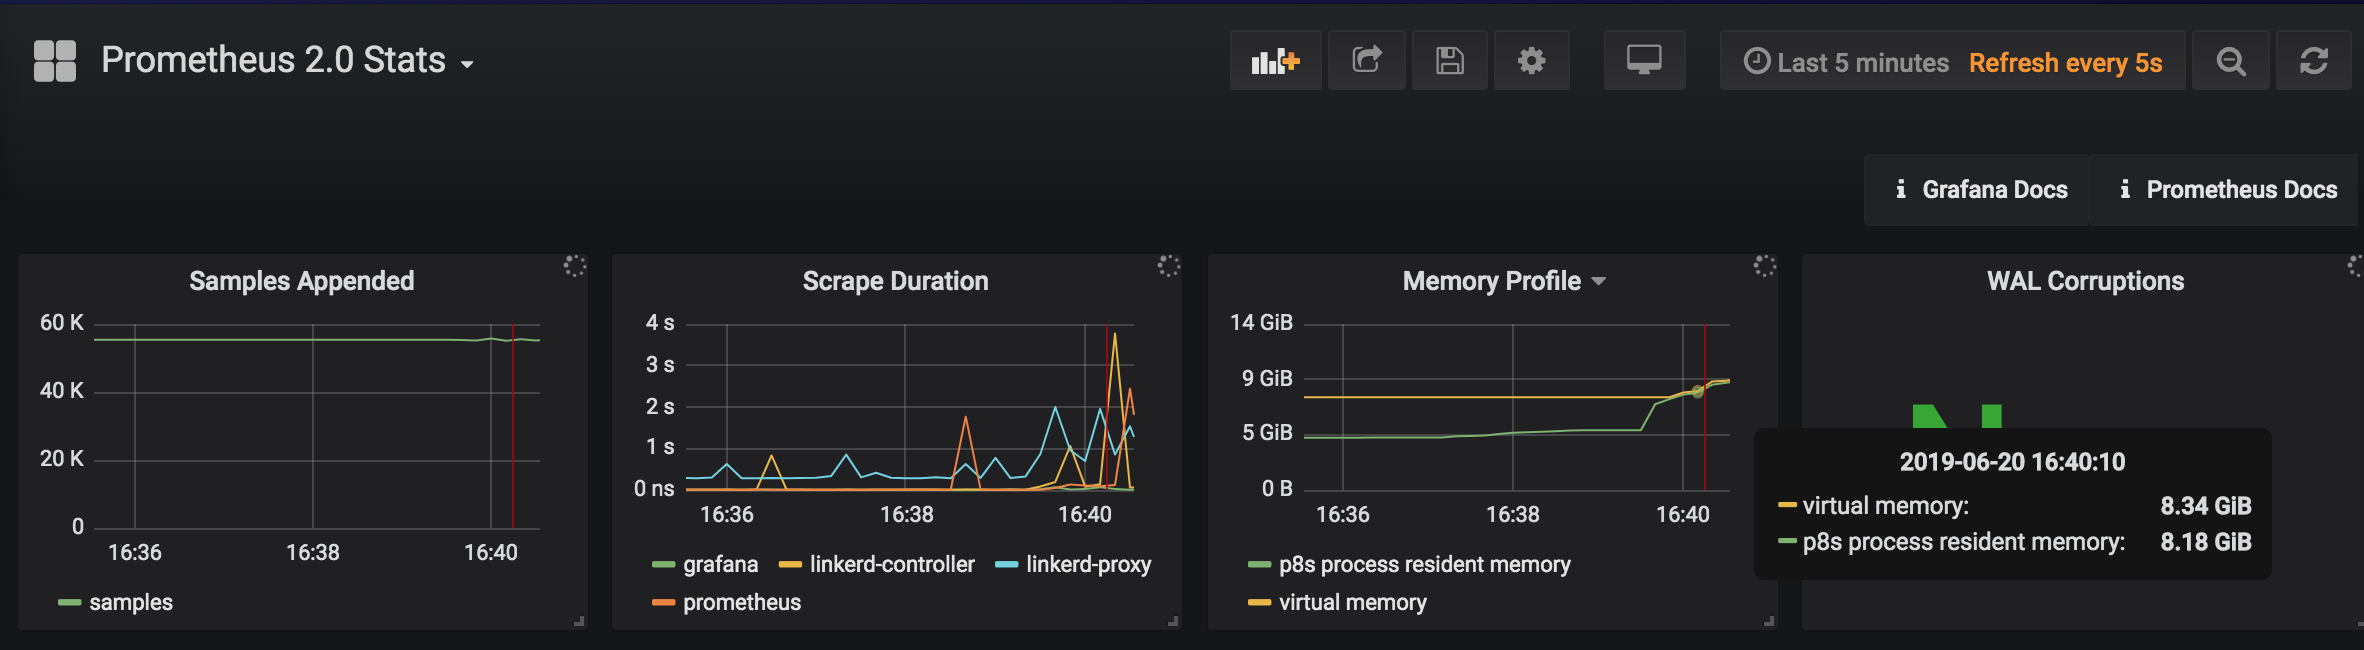
- Mind sharing screenshots of the Grafana dashboards that measure Prometheus? Run:
linkerd dashboard --show grafana
Then screenshot:
http://127.0.0.1:50750/grafana/d/prometheus/prometheus-2-0-stats
http://127.0.0.1:50750/grafana/d/prometheus-benchmark/prometheus-benchmark-2-0-x
Thanks in advance!
 siggy
on 20 Jun 2019
siggy
on 20 Jun 2019
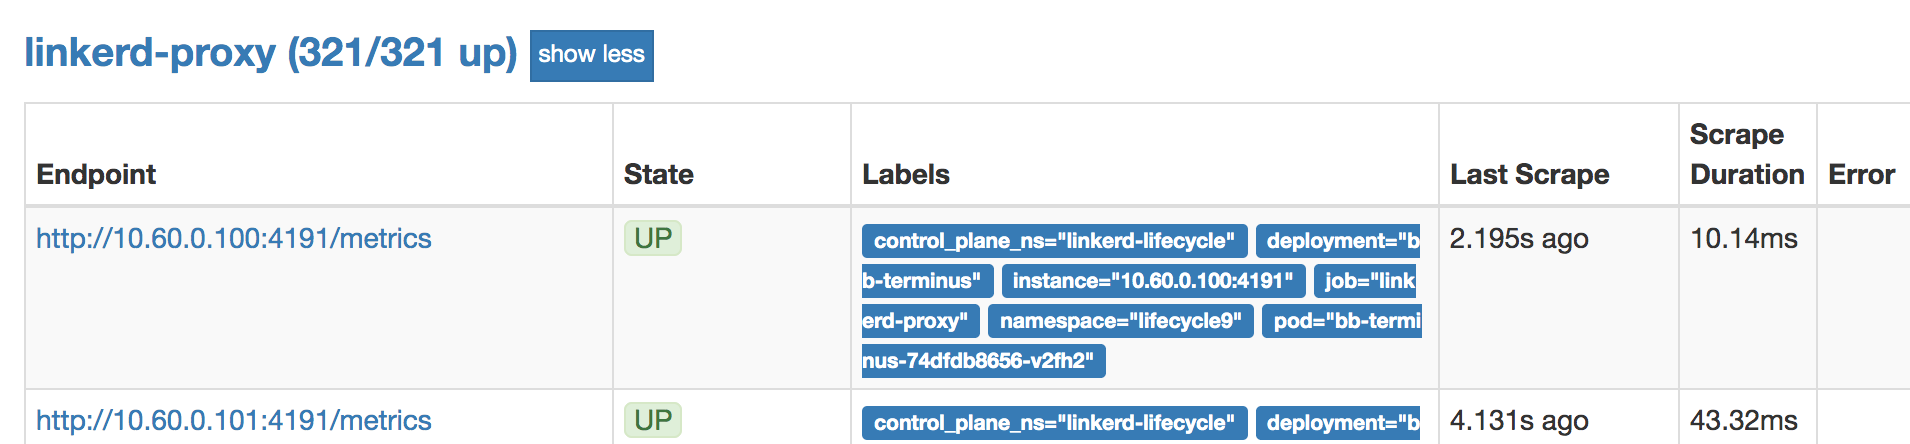
Reproduced similar behavior using the lifecycle environment, with 10 namespaces and 10 replicas (321 pods):
Memory usage increases from 5GB to 10GB when the Linkerd dashboard is opened:
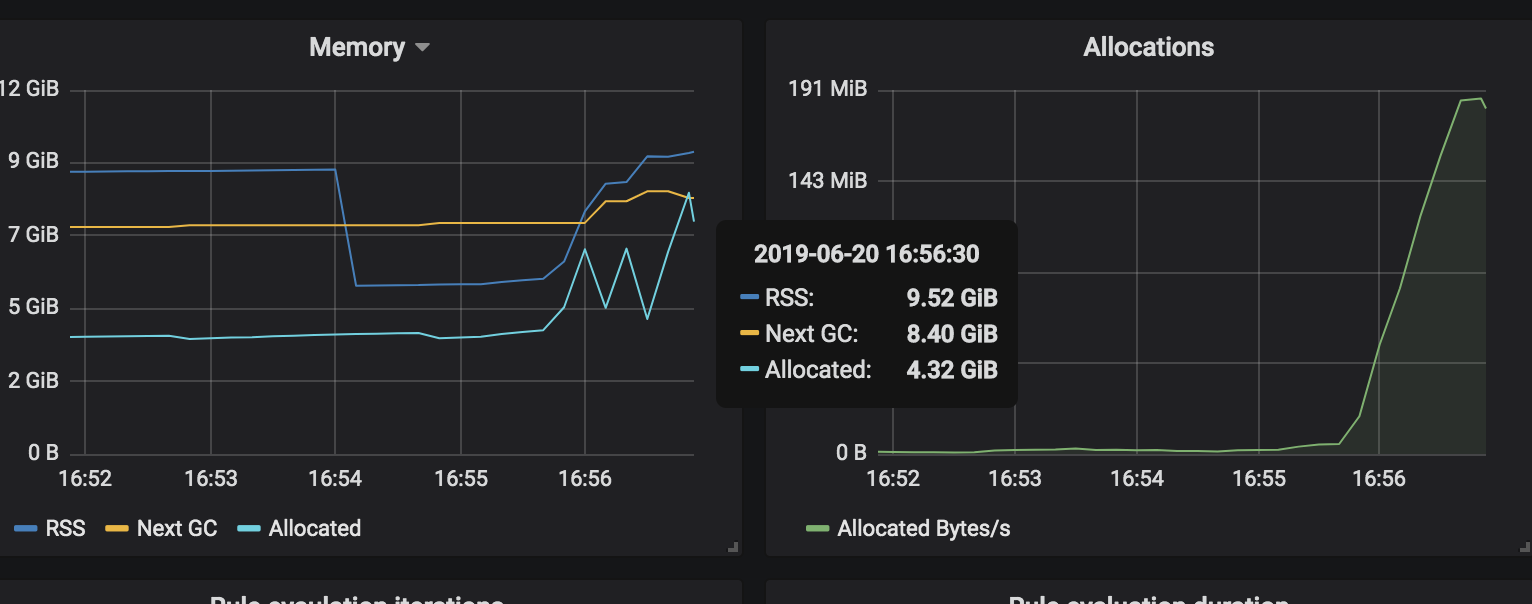
Similar memory increase when the Top-line Grafana dashboard is viewed:
$ kubectl top pod -n linkerd-lifecycle
NAME                                      CPU(cores)   MEMORY(bytes)
linkerd-controller-6f4bb45885-h6vn4       4m           136Mi
linkerd-controller-6f4bb45885-r8ppc       9m           126Mi
linkerd-controller-6f4bb45885-ztt49       5m           122Mi
linkerd-grafana-7896c87bf9-t4n9k          6m           33Mi
linkerd-identity-7457ddf74f-7dkth         1m           21Mi
linkerd-identity-7457ddf74f-8kfqs         2m           22Mi
linkerd-identity-7457ddf74f-bbt97         2m           20Mi
linkerd-prometheus-f5988b86b-zdcgn        429m         10647Mi
linkerd-proxy-injector-585b84db49-rx8z6   2m           17Mi
linkerd-sp-validator-f5cbcc9d8-v4sg7      1m           9Mi
linkerd-web-75fbcb9587-bwxcf              2m           18Mi
There have been some Prometheus performance improvements since 2.7.1, most notably prometheus/prometheus#5173, going to test the latest version.
siggy
on 20 Jun 2019
- Knowing you folks are running upwards of 1k pods is helpful. Can you estimate how many namespaces, deployments, and services that is across?
We have these spread across mostly 4 namespaces and ~25 services and deployments
- Are you observing this behavior when the Linkerd dashboard and/or Grafana is open? What if neither of those views are open? I'm wondering if this is a read-side issue with the dashboards putting too much pressure on Prometheus. Any other automated scripts querying this Prometheus instance?
We don't have any automated scripts running against prometheus, and I can't say that I've noticed that this correlates with viewing the dashboard. We can do some additional monitoring to see if we notice this.
Regarding the other information, it looks like you were able to observe it in your post above. In the meantime, we actually moved our prometheus deployment over to a configuration more like our normal prometheus setup (using persistent volumes and running v2.10.0) for the time being and have noticed better stability. If you need us to do more debugging we can always switch back and try to gather some data.
suever
on 20 Jun 2019
Posted #2979 to bump Prometheus to 2.10.0, memory usage looks better. I've also filed #2980 to track further optimizations.
siggy
on 21 Jun 2019
Closing this as #2979 has merged. We'll track ongoing Prometheus optimizations in #2980. Please reopen and comment if you encounter this issue with edge-19.6.3 or later.
siggy
on 24 Jun 2019
Related issues
 tustvold
·
4Comments
tustvold
·
4Comments
 skalinets
·
3Comments
skalinets
·
3Comments
 manimaul
·
3Comments
manimaul
·
3Comments
 ihcsim
·
4Comments
ihcsim
·
4Comments
ihcsim
·
4Comments
ihcsim
·
4Comments
Most helpful comment
@complex64 thanks, that's helpful as a starting point. we'll probably have some more questions as we dig into this.