Kibana: Chrome 72 browser lockup on Discover and Monitoring
Kibana version: 6.5.4
Elasticsearch version: 6.5.4
Browser version: Chrome 72
Other browsers tested: Chrome 71, Internet Explorer
Browser OS version: Windows 10
Original install method (e.g. download page, yum, from source, etc.): ECE 2.1.0
Describe the bug:
Loading Discover or Monitoring in Chrome 72 can cause the browser tab to spin for several seconds to a few minutes which then leads to the tab locking up. It eventually comes back if you let it sit.
Steps to reproduce:
- Open Discover
- Play with the time picker
- Observe the lockup
Expected behavior:
Load the app without freezing the tab like with Chrome 71. The issue does not reproduce with Chrome 71 with the same parameters.
Errors in browser console (if relevant):
No errors.
Any additional context:
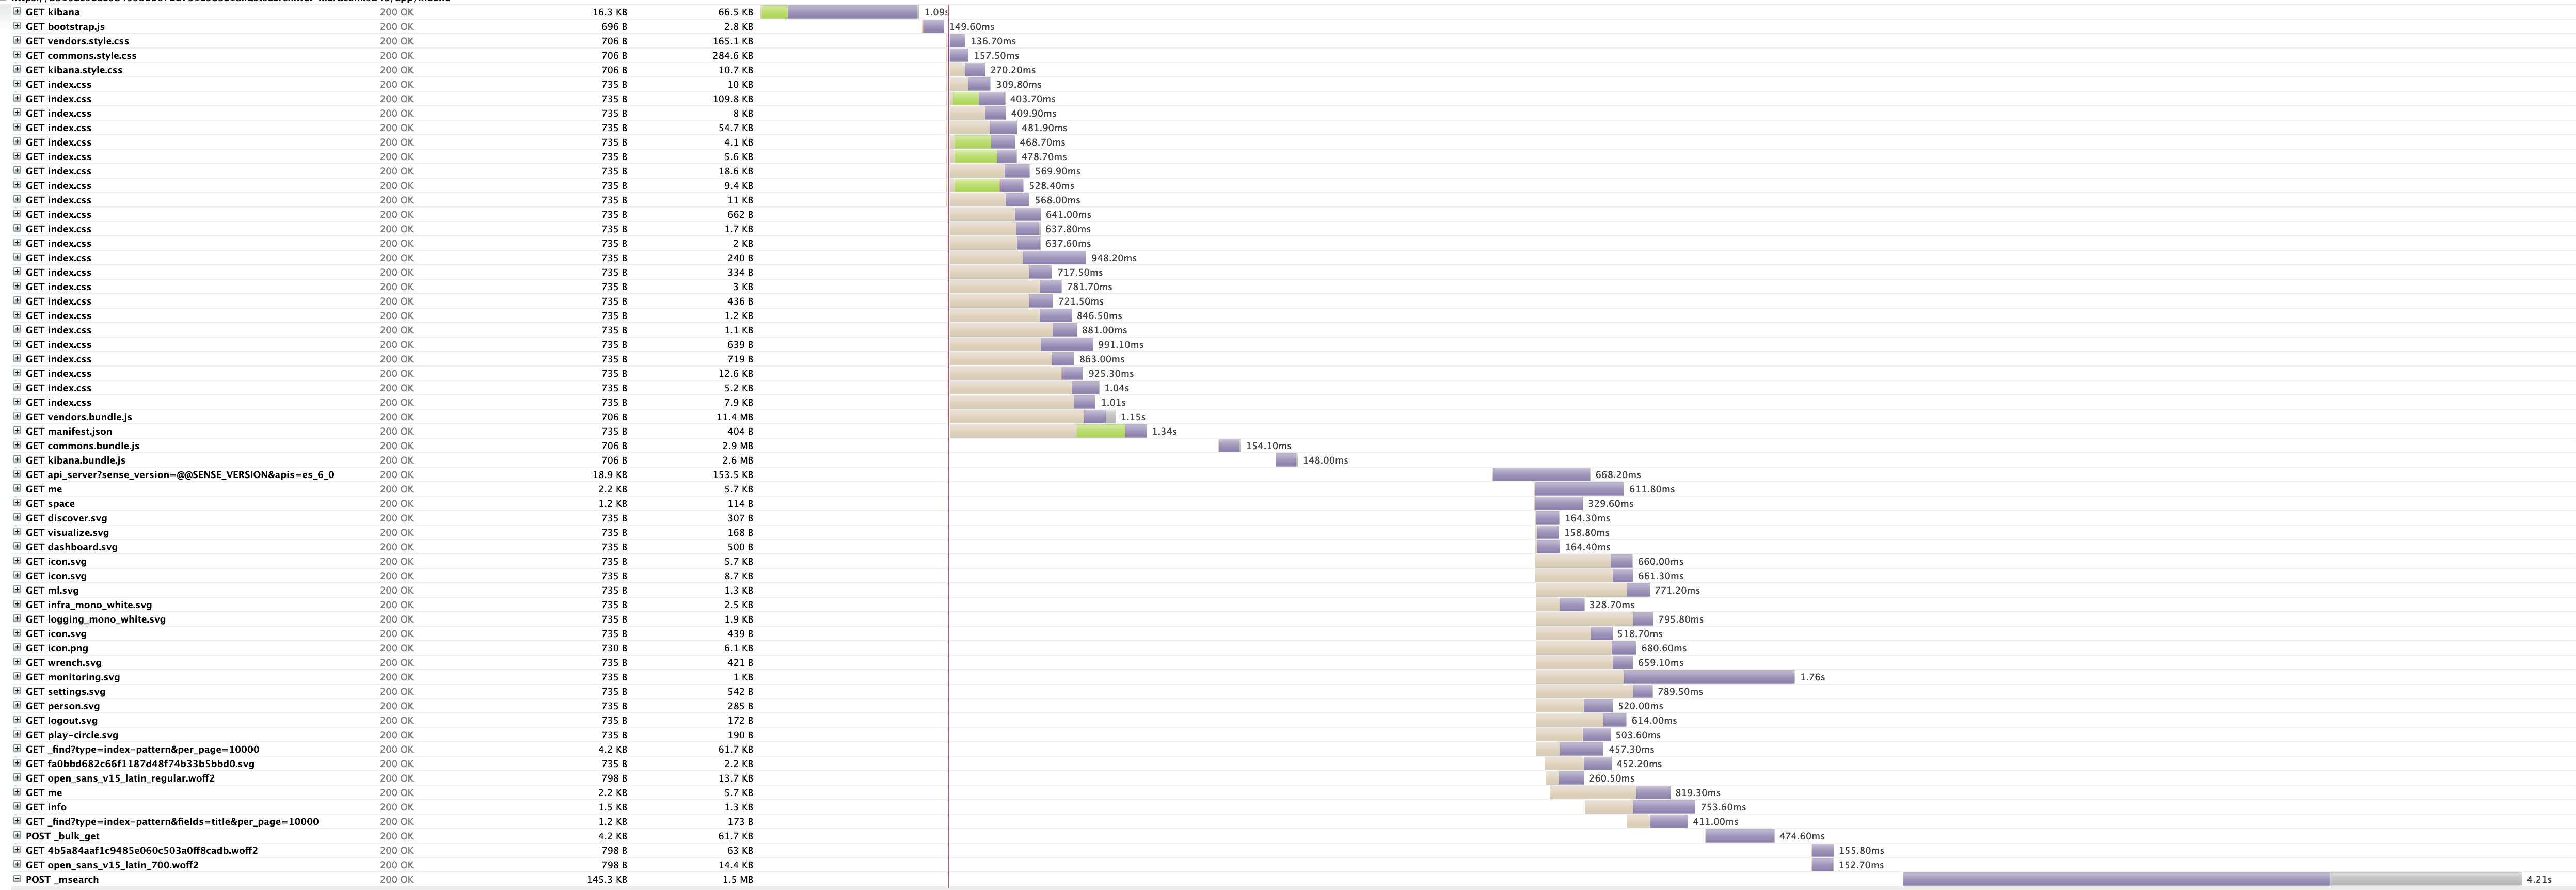
When it happens with Discover, it seems to be while loading event bar charts at the top of the page. The screenshot shows 4.21s spent on POST _msearch which appeared to happen while loading the charts. At this point, the browser tab froze and no more data was collected in the HAR. Perhaps something is amiss in the browser while parsing the JSON response?
HAR available on request.
@jbudz
 inqueue
All 6 comments
Pinging @elastic/kibana-app
 elasticmachine
on 26 Feb 2019
elasticmachine
on 26 Feb 2019
For us (3x engineers), after updating to 72, this started occurring as well. We are now on 73, and this is still occurring (Actually occurs faster now)
When loading the discover dashboard, you can watch the memory usage march up until chrome crashes. memory usage by the single chrome process (Not all 15 of the chrome processes) can top 1.5GB before it crashes.
Elastic and Kibana V 6.6.0
Does not occur in IE or Firefox
 TomSomerville
on 21 Mar 2019
TomSomerville
on 21 Mar 2019
The issue exists in Chrome version 73 as well.
 kvmuralidhar
on 25 Mar 2019
kvmuralidhar
on 25 Mar 2019
Have the same issue with kibana 7 and Chrome version 73.
 Mikey032
on 11 Apr 2019
Mikey032
on 11 Apr 2019
Facing similar issue with Chrome version 73 on Windows but not with macOS machines. Has anyone been able to get to the bottom of this?
 sanchay543
on 12 Apr 2019
sanchay543
on 12 Apr 2019
Check if any accessibility settings are enabled: chrome://accessibility/. For me, this happens several minutes after startup (seemingly due to my touchscreen), and the additional work that the accessibility options create seems to slow down the browser.
 csnardi
on 1 Jun 2019
csnardi
on 1 Jun 2019
Related issues
 bradvido
·
3Comments
bradvido
·
3Comments
 snide
·
3Comments
snide
·
3Comments
 ctindel
·
3Comments
ctindel
·
3Comments
 stacey-gammon
·
3Comments
stacey-gammon
·
3Comments
 bhavyarm
·
3Comments
bhavyarm
·
3Comments
Most helpful comment
For us (3x engineers), after updating to 72, this started occurring as well. We are now on 73, and this is still occurring (Actually occurs faster now)
When loading the discover dashboard, you can watch the memory usage march up until chrome crashes. memory usage by the single chrome process (Not all 15 of the chrome processes) can top 1.5GB before it crashes.
Elastic and Kibana V 6.6.0
Does not occur in IE or Firefox