Jormungandr: Spikes of TCP connections before getting stuck
Describe the bug
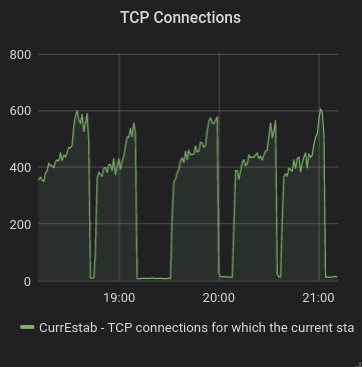
I am seeing rapid increase of TCP connection right before the pool gets stuck (plus 100-200 connections).

Interesting is, this happens periodically every ~ 30 minutes. The drop of connections to the bottom is the automatic restart of the pool (I have a script that detects if the pool is stuck and then restarts it).
I am not sure if this is a Jormungandr problem or rather some malicious behaviour by 3rd party (DoS attack).
Mandatory Information
I have observed this behaviour in v0.8.5 and also in version built from master 35a60a3c.
To Reproduce
Steps to reproduce the behavior:
- Start Jormungandr.
- Wait slightly over 30 minutes.
- Pool gets restarted.
- Repeat from 1.
Expected behavior
Run Jormungandr without getting stuck.
Additional context
N/A
 tstdin
All 28 comments
The underlying cause is the same as https://github.com/input-output-hk/jormungandr/issues/1459
 manveru
on 8 Jan 2020
manveru
on 8 Jan 2020
The underlying cause is the same as #1459
In that case the issue #1459 is still not fixed, as I was experiencing that behaviour also on 35a60a3.
If it would help, I can provide a packet capture of one of those incidents. But I will share it only privately, as it is not anonymized.
tstdin
on 8 Jan 2020
This might have the same cause as #1459.
 mzabaluev
on 8 Jan 2020
mzabaluev
on 8 Jan 2020
With #1523 applied, it behaves still the same. The last three runs on the following graph are with those changes.
tstdin
on 8 Jan 2020
I am experiencing the same problem.
Required Info
jormungandr --full-version
jormungandr 0.8.5 (HEAD-35a60a3c, release, linux [x86_64]) - [rustc 1.40.0 (73528e339 2019-12-16)]
Max Connections set to: 1024
cat /proc/version
Linux version 4.15.0-1057-aws (buildd@lgw01-amd64-030) (gcc version 7.4.0 (Ubuntu 7.4.0-1ubuntu1~18.04.1)) #59-Ubuntu SMP Wed Dec 4 10:02:00 UTC 2019
Machine info:
Intel(R) Xeon(R) CPU E5-2676 v3 @ 2.40GHz (2 cores)
RAM: 4 GB
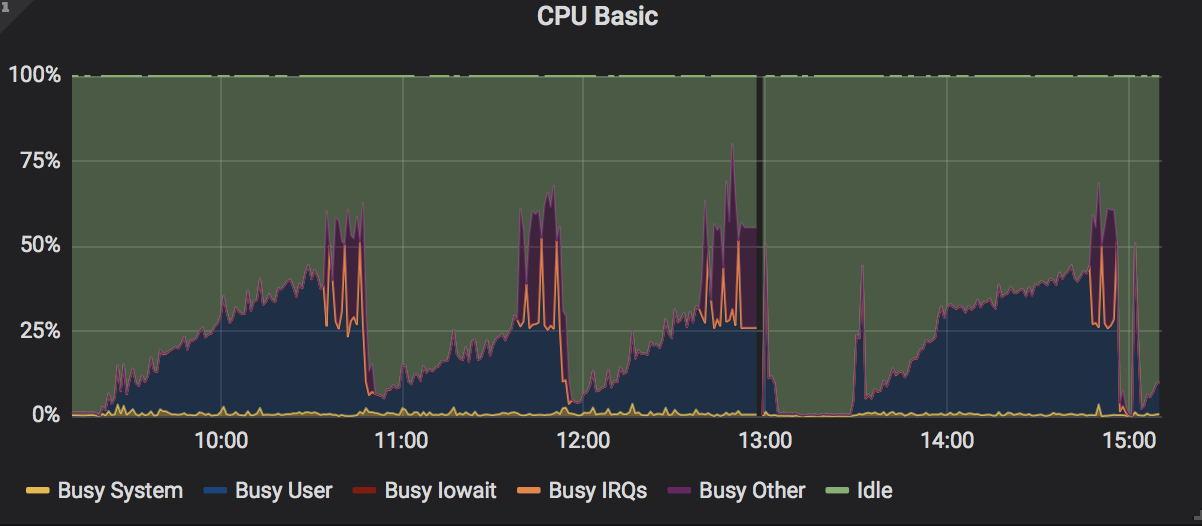
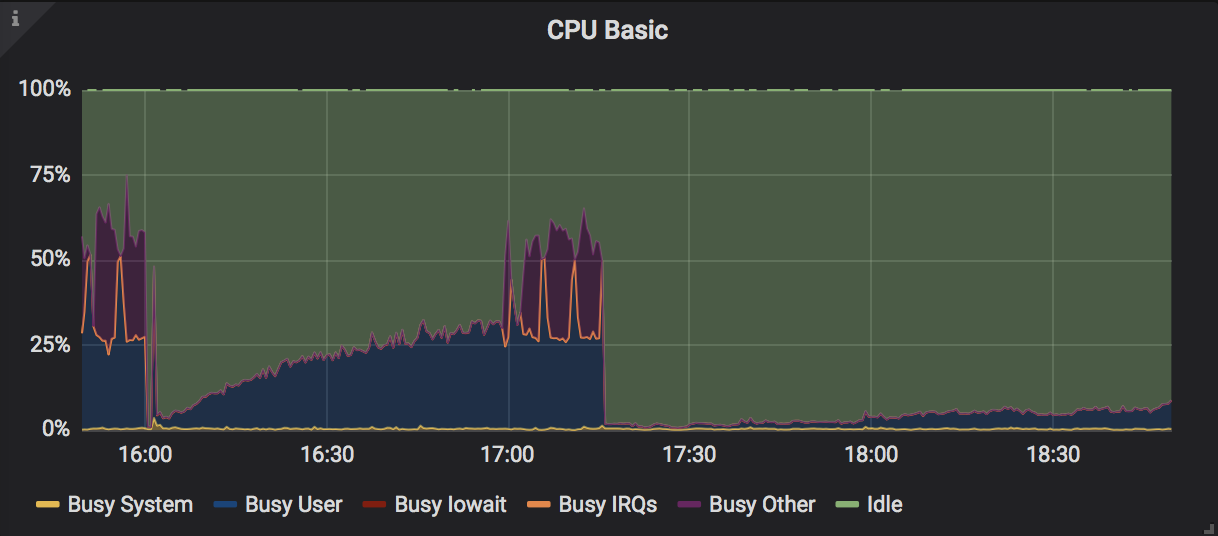
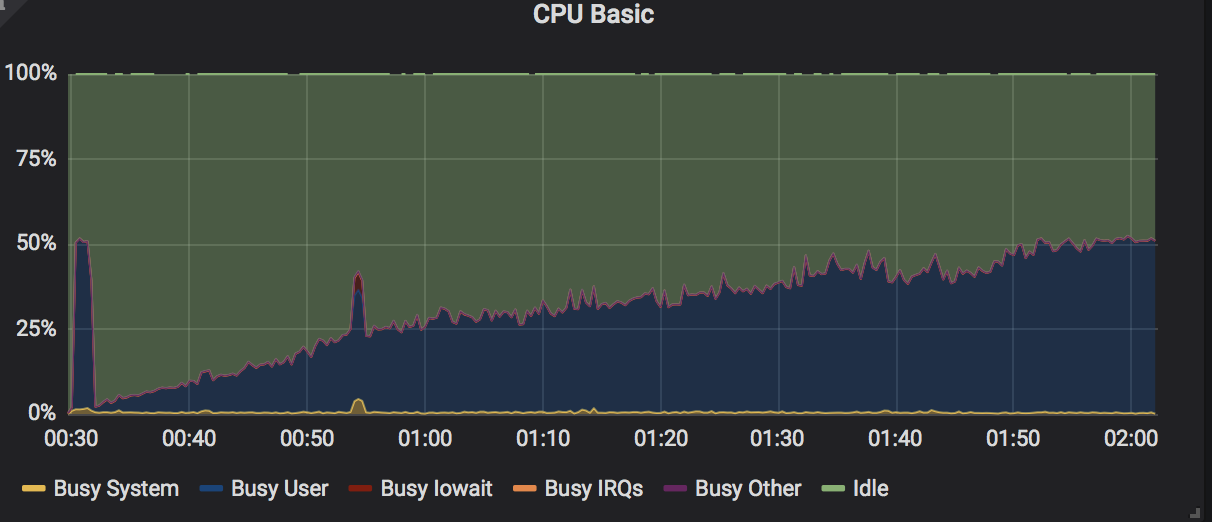
Observations: Increase in CPU, culminating with spikes in cpu usage and associated spikes in tcp connections, socket memory, and tcp memory. Jormungandr terminates in error via a "network" panic. See below.
Jan 09 19:32:53.982 WARN response canceled by the processing task, request: PushHeaders, sub_task: server, task: network
Jan 09 19:32:54.152 WARN response canceled by the processing task, request: PushHeaders, sub_task: server, task: network
Jan 09 19:32:54.187 WARN response canceled by the processing task, request: PushHeaders, sub_task: server, task: network
thread 'network1' panicked at 'called `Result::unwrap()` on an `Err` value: SpawnError { is_shutdown: true }', src/libcore/result.rs:1165:5
note: run with `RUST_BACKTRACE=1` environment variable to display a backtrace.
Jan 09 20:56:17.226 CRIT Task panicked, task: network

UPDATE: I notice the same behavior with the default max_connections of 256. The period of these observations are about 50 min to 1 hour from node restart.
 jalora8
on 9 Jan 2020
jalora8
on 9 Jan 2020
Further update:
After adjusting my config.yaml to remove listen_address and public_address, I am no longer observing the spikes and my cpu is behaving well. Also, I have set my max_connections=512. Node is stable.
Note that the far right corner (after 17:15) is the behavior that I am seeing.
jalora8
on 10 Jan 2020
But isn't listen_address be configured to receive block announcements being published to all the nodes in the network to keep the blockchain upto date? but otherwise how would keep your node be in sycn other than your node connecting to other node pull the last update on blocks/slots. What happens if every node (other than trusted peers) in the network has this listen_address removed? will any node be able to keep up - updated & synched???? if that becomes the situation then I can think the only way to make your node sycned is to bootstrap every time by connecting to trusted peers..! Any thoughts????
 hemants1
on 10 Jan 2020
hemants1
on 10 Jan 2020
Further update:
After adjusting my config.yaml to removelisten_addressandpublic_address, I am no longer observing the spikes and my cpu is behaving well. Also, I have set mymax_connections=512. Node is stable.Note that the far right corner (after 17:15) is the behavior that I am seeing.
How are you able to keep your node in sync? by just connecting to peers in network? Are you not receiving any "failed to connect to peer, reason: Connection refused (os error 111), " if the peer has removed the "LISTEN_ADDRESS" settings?
hemants1
on 10 Jan 2020
Max Connections set to: 1024
Also as per my understanding, Max Connections is for inbound connections to your node...! I believe if you remove LISTEN_ADDRESS then this parameter is not applicable..! and obviously your node will not be bombarded with inbound connections from other node in the network hence CPU and MEM remain utilized very low...!
hemants1
on 10 Jan 2020
After adjusting my
config.yamlto removelisten_addressandpublic_address, I am no longer observing the spikes and my cpu is behaving well.
This suggests that the problem in the gRPC server implementation; one fix is pending in #1531.
mzabaluev
on 10 Jan 2020
I'm still seeing this on b45d2355. Observed the same network panic.
Jan 11 08:07:50 ip-172-31-2-14 startFRG.sh[24483]: thread 'network1' panicked at 'called `Result::unwrap()` on an `Err` value: SpawnError { is_shutdow
Jan 11 08:07:50 ip-172-31-2-14 startFRG.sh[24483]: Jan 11 08:07:50.087 CRIT Task panicked, task: network
I set max_connections=512, max_unreachable_nodes_to_connect_per_event=2, and gossip_interval=3s with both listen_address and public_address activated. See below snapshots for more details. Hope it helps.
Gradual build up in CPU load but no longer seeing a spike at the end
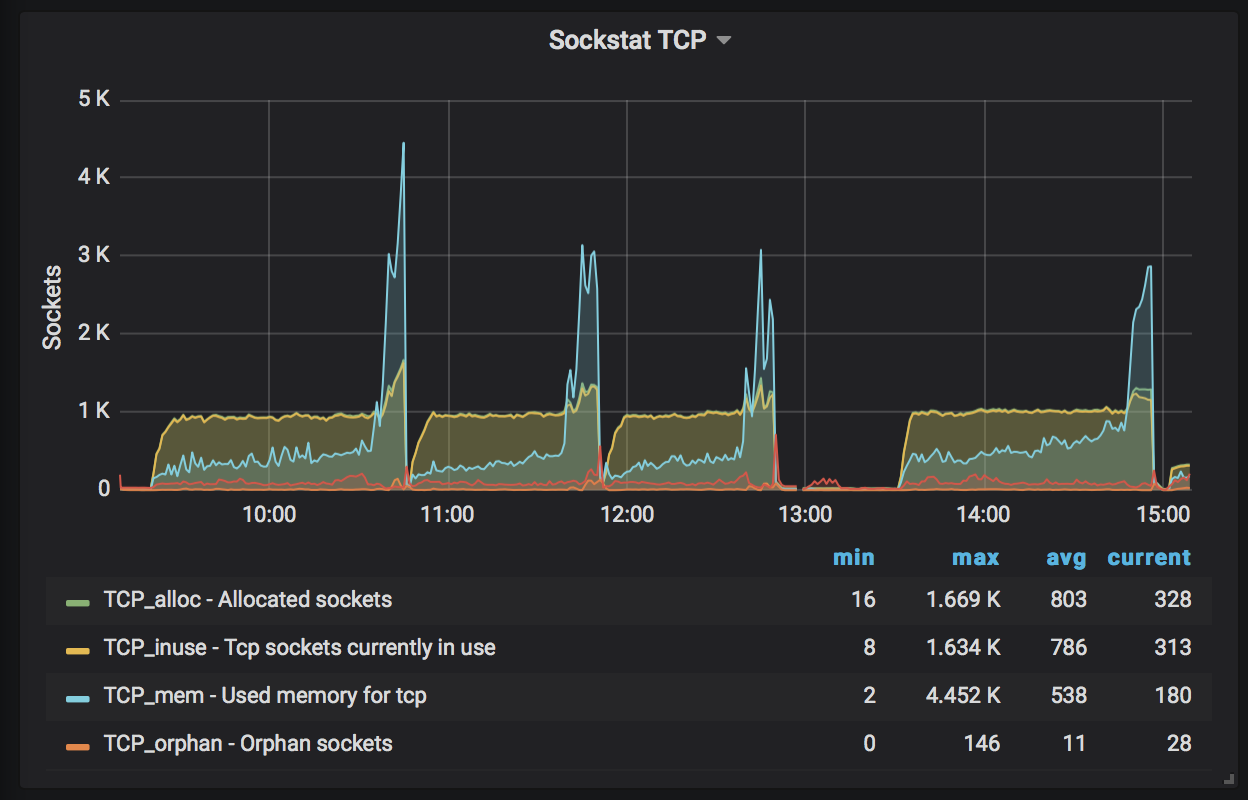
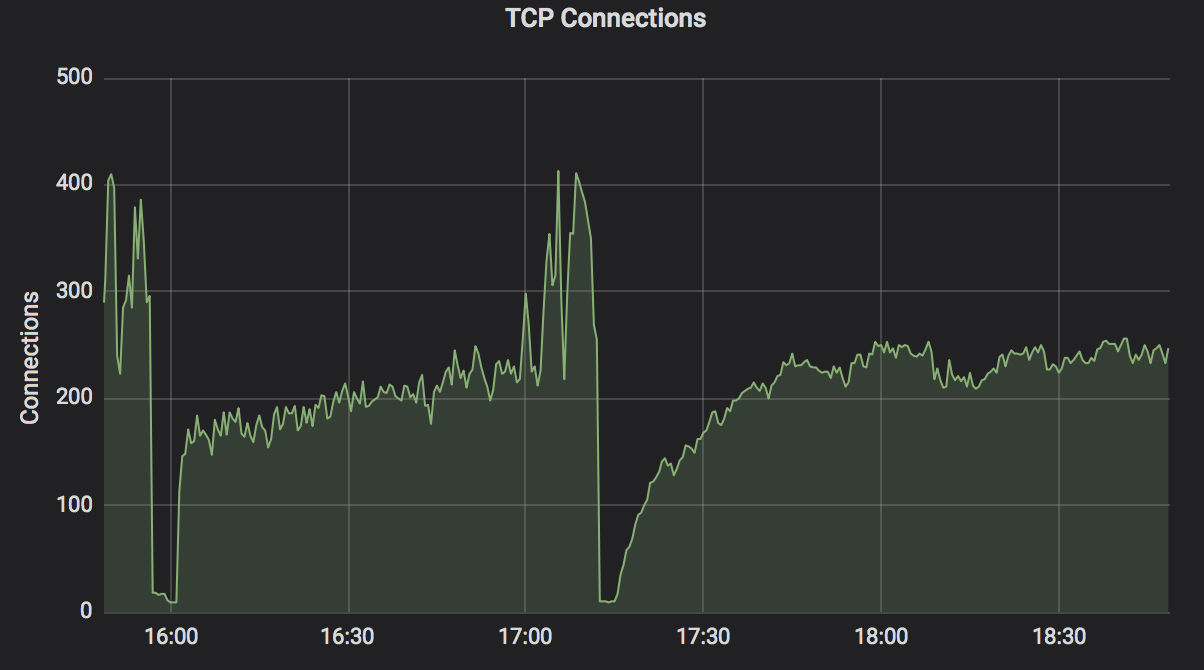
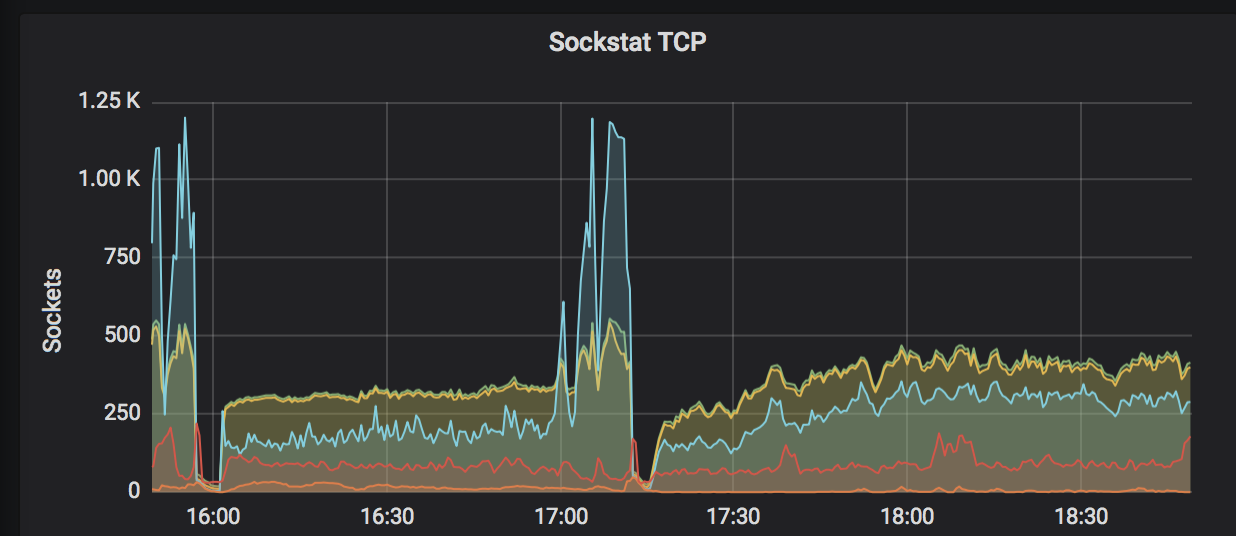
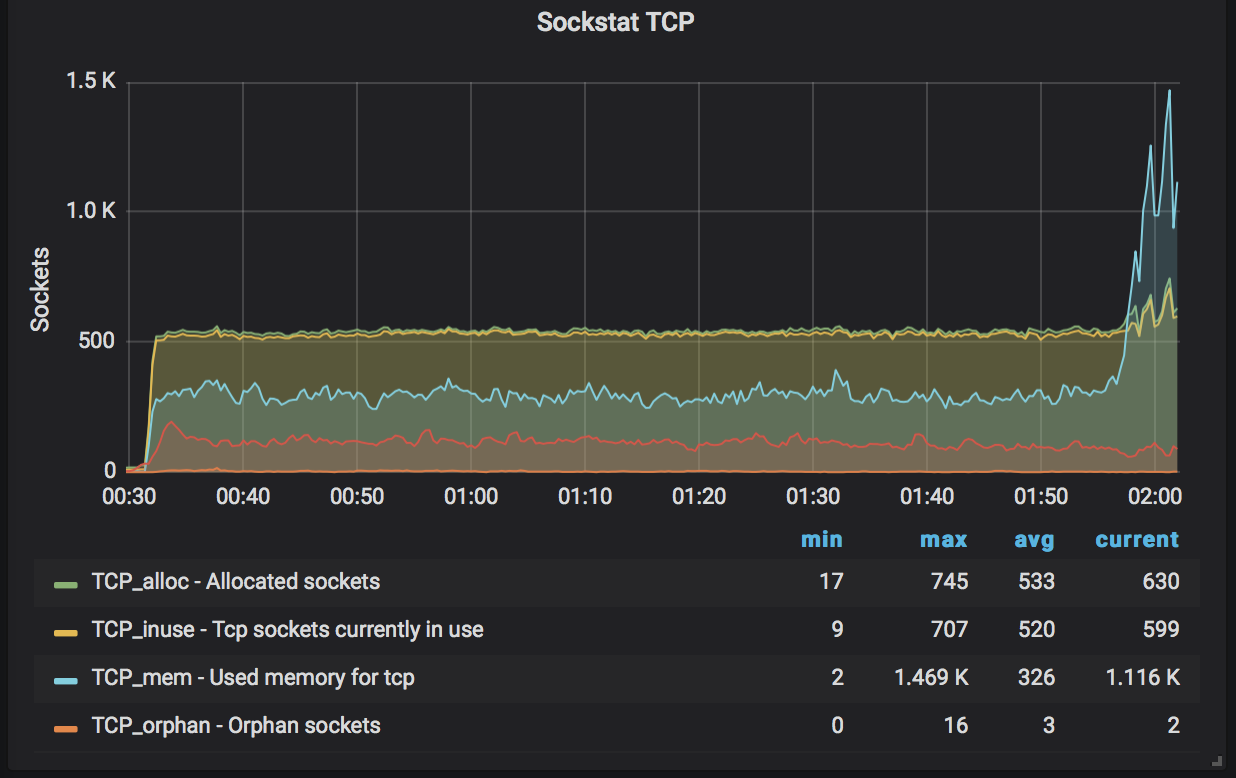
Same spike on socket TCP and TCP connections

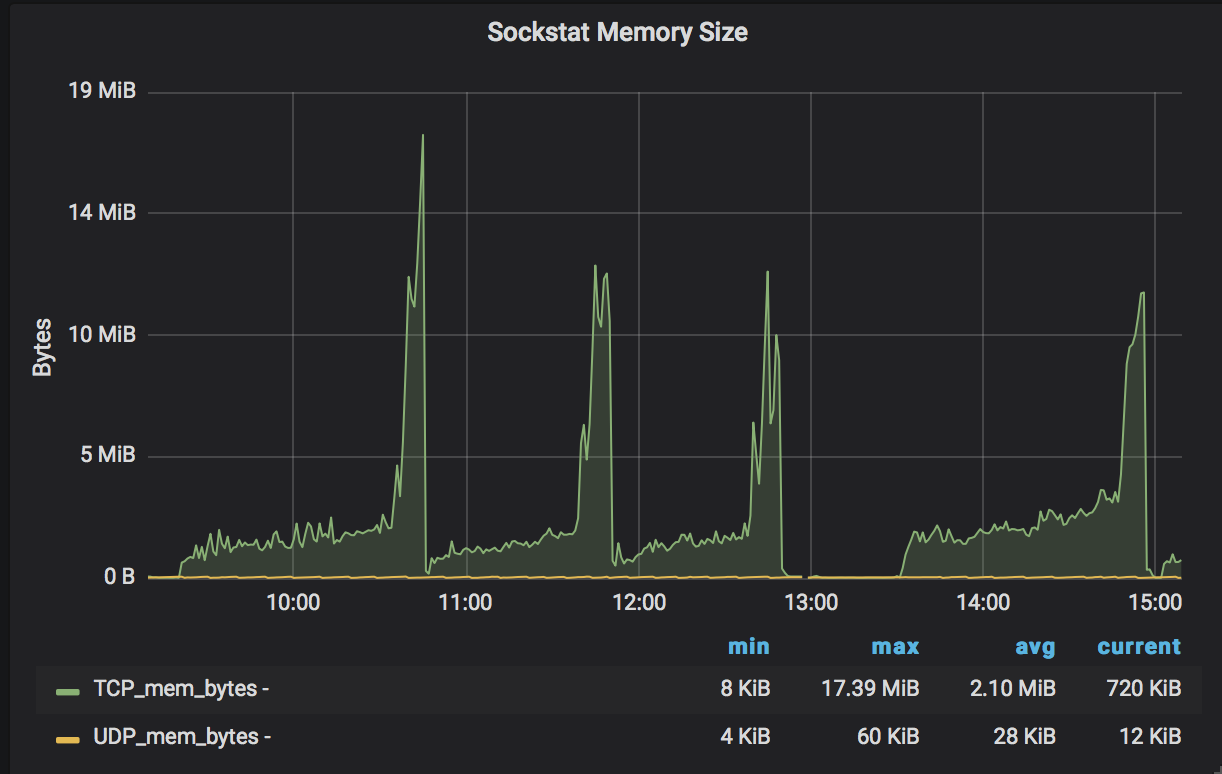
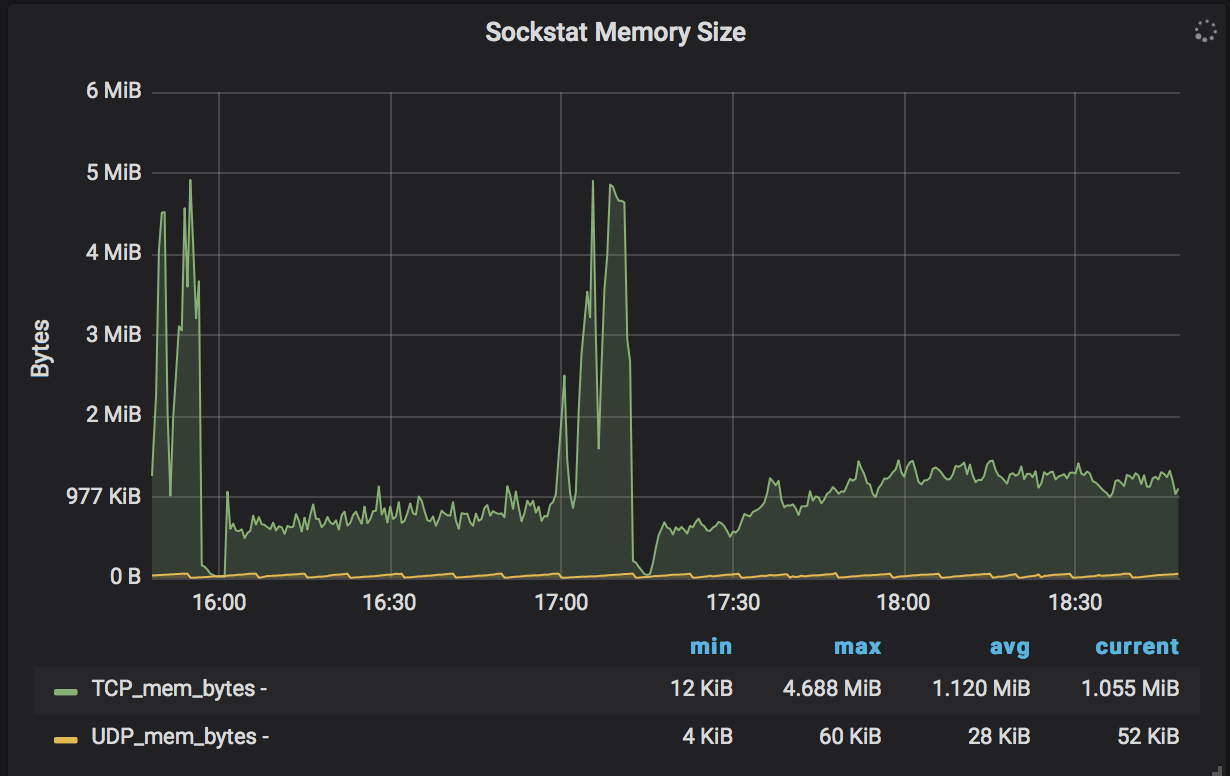
AND... Socket memory

During TCP and socket memory spike, scraper was having difficulty getting block height and node becomes stuck

jalora8
on 11 Jan 2020
Looking further into my logs I saw the following
Jan 11 08:07:50 ip-172-31-2-14 startFRG.sh[24483]: Jan 11 08:07:50.087 CRIT Task panicked, task: network
Jan 11 08:07:50 ip-172-31-2-14 startFRG.sh[24483]: thread 'network1' panicked at 'called `Result::unwrap()` on an `Err` value: SpawnError { is_shutdown: true }', src/libcore/result.rs:1165:5
Jan 11 08:07:48 ip-172-31-2-14 startFRG.sh[24483]: Jan 11 08:07:48.778 WARN response canceled by the processing task, request: PushHeaders, sub_task: server, task: network
Jan 11 08:07:48 ip-172-31-2-14 startFRG.sh[24483]: Jan 11 08:07:48.139 WARN response canceled by the processing task, request: PushHeaders, sub_task: server, task: network
Jan 11 08:07:45 ip-172-31-2-14 startFRG.sh[24483]: Jan 11 08:07:45.546 WARN response canceled by the processing task, request: PushHeaders, sub_task: server, task: network
Jan 11 08:07:43 ip-172-31-2-14 startFRG.sh[24483]: Jan 11 08:07:43.248 WARN response canceled by the processing task, request: PushHeaders, sub_task: server, task: network
Jan 11 08:07:42 ip-172-31-2-14 startFRG.sh[24483]: Jan 11 08:07:42.447 WARN response canceled by the processing task, request: PushHeaders, sub_task: server, task: network
Jan 11 08:07:42 ip-172-31-2-14 startFRG.sh[24483]: Jan 11 08:07:42.447 WARN response canceled by the processing task, request: PushHeaders, sub_task: server, task: network
Jan 11 08:07:42 ip-172-31-2-14 startFRG.sh[24483]: Jan 11 08:07:42.446 WARN response canceled by the processing task, request: PushHeaders, sub_task: server, task: network
Jan 11 08:07:42 ip-172-31-2-14 startFRG.sh[24483]: Jan 11 08:07:42.445 WARN response canceled by the processing task, request: PushHeaders, sub_task: server, task: network
.........
Jan 11 08:05:44 ip-172-31-2-14 startFRG.sh[24483]: Jan 11 08:05:44.067 WARN response canceled by the processing task, request: PushHeaders, sub_task: server, task: network
Jan 11 08:05:44 ip-172-31-2-14 startFRG.sh[24483]: Jan 11 08:05:44.066 WARN response canceled by the processing task, request: PushHeaders, sub_task: server, task: network
Jan 11 08:05:44 ip-172-31-2-14 startFRG.sh[24483]: Jan 11 08:05:44.066 WARN response canceled by the processing task, request: PushHeaders, sub_task: server, task: network
Jan 11 08:05:44 ip-172-31-2-14 startFRG.sh[24483]: Jan 11 08:05:44.065 WARN response canceled by the processing task, request: PushHeaders, sub_task: server, task: network
Jan 11 08:05:44 ip-172-31-2-14 startFRG.sh[24483]: Jan 11 08:05:44.065 WARN response canceled by the processing task, request: PushHeaders, sub_task: server, task: network
Jan 11 08:05:44 ip-172-31-2-14 startFRG.sh[24483]: Jan 11 08:05:44.064 WARN response canceled by the processing task, request: PushHeaders, sub_task: server, task: network
Jan 11 08:05:17 ip-172-31-2-14 startFRG.sh[24483]: Jan 11 08:05:17.114 CRIT Task panicked, task: block
Jan 11 08:05:17 ip-172-31-2-14 startFRG.sh[24483]: note: run with `RUST_BACKTRACE=1` environment variable to display a backtrace.
Jan 11 08:05:17 ip-172-31-2-14 startFRG.sh[24483]: thread 'block0' panicked at 'referential integrity failure in CandidateForest', src/libcore/option.rs:1185:5
TLDR; It looks like I got a block panic prior to the network panic.
jalora8
on 11 Jan 2020
How long your are able to keep the node up and running with these settings before it is stuck?
Regards,
Hemant Srinivas
1 262-290-6475 (M)
1 414-524-5536 (O)
From: jalora8 notifications@github.com
Sent: Saturday, January 11, 2020 2:18 AM
To: input-output-hk/jormungandr
Cc: hemants1; Comment
Subject: Re: [input-output-hk/jormungandr] Spikes of TCP connections before getting stuck (#1521)
I'm still seeing this on b45d2355. No longer observed the original panic (although I may not have run it long enough to get there). I set max_connections=512, max_unreachable_nodes_to_connect_per_event=2, and gossip_interval=3s . See below snapshots for more details. Hope it helps.
Gradual build up in CPU load but no longer seeing a spike w/ associated panic
[CPU]https://user-images.githubusercontent.com/58919321/72201239-85172480-3417-11ea-9ccc-91f26a2e0f79.png
Same spike on socket TCP and TCP connections
[Sockstat TCP]https://user-images.githubusercontent.com/58919321/72201264-b0017880-3417-11ea-8ba7-70f41c7e8499.png
[TCP spike]https://user-images.githubusercontent.com/58919321/72201339-711ff280-3418-11ea-88a2-8cbe05716027.png
AND... Socket memory
[Socket Memory]https://user-images.githubusercontent.com/58919321/72201271-ca3b5680-3417-11ea-955b-23f51168a122.png
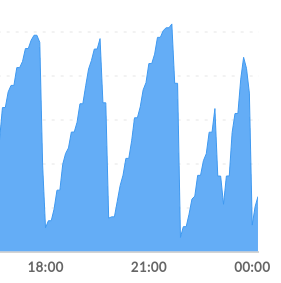
During TCP and socket memory spike, scraper was having difficulty getting block height and node becomes stuck
[blockheight]https://user-images.githubusercontent.com/58919321/72201304-feaf1280-3417-11ea-89df-7e3d48f5f140.png
—
You are receiving this because you commented.
Reply to this email directly, view it on GitHubhttps://github.com/input-output-hk/jormungandr/issues/1521?email_source=notifications&email_token=ADYS4UWSDMZILCKQJNW5ORDQ5F6GVA5CNFSM4KEDTLB2YY3PNVWWK3TUL52HS4DFVREXG43VMVBW63LNMVXHJKTDN5WW2ZLOORPWSZGOEIV4RAA#issuecomment-573294720, or unsubscribehttps://github.com/notifications/unsubscribe-auth/ADYS4UUXLBPEEIKVMYA7Y2LQ5F6GVANCNFSM4KEDTLBQ.
hemants1
on 11 Jan 2020
How long your are able to keep the node up and running with these settings before it is stuck?
Same as what I experienced in my first comment... a period of about 1 hour.
jalora8
on 12 Jan 2020
I notice the same behaviour. with settings below
public_address: "/ip4/..../tcp/3000"
listen_address: "/ip4/0.0.0.0/tcp/3000"
public_id: ....
max_unreachable_nodes_to_connect_per_event: 1
max_connections: 256
rest:
listen: 127.0.0.1:3100
leadership:
log_ttl: 24h
garbage_collection_interval: 10m
storage:...
explorer:
enabled: false
mempool:
fragment_ttl: 30m
log_ttl: 24h
garbage_collection_interval: 10m
pool_max_entries: 100000
log_max_entries: 1000000
 skokasik
on 13 Jan 2020
skokasik
on 13 Jan 2020
Same issue with 0.8.6, just that it only took about 5 minutes to reach the impasse.
manveru
on 15 Jan 2020
CPU load is still ramping up. TCP connections and TCP socket memory still spiking as well on 0.8.6.


jalora8
on 15 Jan 2020
I can confirm we are seeing this on 0.8.6. as well.
 mmahut
on 15 Jan 2020
mmahut
on 15 Jan 2020
confirming too!
 cardanians
on 15 Jan 2020
cardanians
on 15 Jan 2020
Confirming too. My Node settings are:
topics_of_interest:
blocks: high
messages: high
max_connections: 256
max_unreachable_nodes_to_connect_per_event: 2
gossip_interval: 1s
policy:
quarantine_duration: 30m
mempool:
fragment_ttl: 30m
log_max_entries: 300000
pool_max_entries: 30000
log_ttl: 1h
garbage_collection_interval: 10m
leadership:
log_ttl: 1h
garbage_collection_interval: 10m
On Wed, Jan 15, 2020 at 4:25 PM cardanians notifications@github.com wrote:
confirming too!
—
You are receiving this because you commented.
Reply to this email directly, view it on GitHub
https://github.com/input-output-hk/jormungandr/issues/1521?email_source=notifications&email_token=ADYS4UWNJ5YGYEVA4BMJVFTQ56ENJA5CNFSM4KEDTLB2YY3PNVWWK3TUL52HS4DFVREXG43VMVBW63LNMVXHJKTDN5WW2ZLOORPWSZGOEJCA77I#issuecomment-574885885,
or unsubscribe
https://github.com/notifications/unsubscribe-auth/ADYS4UU2F6ON7JELGC6ORKLQ56ENJANCNFSM4KEDTLBQ
.
hemants1
on 15 Jan 2020
I can also confirm that I'm seeing this on 8.6 release on Ubuntu.
 Linicks
on 16 Jan 2020
Linicks
on 16 Jan 2020
I am also seeing this on 8.6 and all previous versions. Running Ubuntu on a RockPi. Coincides with the following netstats and falling behind in block height. Can't keep this thing going for longer than 10 minutes it seems.
root@rockpi:~/jormungandr-node# netstat -tn | tail -n +3 | awk "{ print \$6 }" | sort | uniq -c | sort -n
1 LAST_ACK
20 TIME_WAIT
66 SYN_SENT
173 CLOSE_WAIT
1758 ESTABLISHED
root@rockpi:~/jormungandr-node# netstat -tn | tail -n +3 | awk "{ print \$6 }" | sort | uniq -c | sort -n
1 LAST_ACK
12 TIME_WAIT
60 SYN_SENT
227 CLOSE_WAIT
1689 ESTABLISHED
root@rockpi:~/jormungandr-node# netstat -tn | tail -n +3 | awk "{ print \$6 }" | sort | uniq -c | sort -n
13 TIME_WAIT
58 SYN_SENT
227 CLOSE_WAIT
1690 ESTABLISHED
_systemctl service stops jormungandr here:_
root@rockpi:~/jormungandr-node# netstat -tn | tail -n +3 | awk "{ print \$6 }" | sort | uniq -c | sort -n
1 CLOSING
1 LAST_ACK
12 ESTABLISHED
121 FIN_WAIT1
564 TIME_WAIT
root@rockpi:~/jormungandr-node# netstat -tn | tail -n +3 | awk "{ print \$6 }" | sort | uniq -c | sort -n
3 TIME_WAIT
12 ESTABLISHED
_Here is the block height trail:_
No block height
No block height
No block height
2020-01-15 23:45:18 New block height: "100729"
2020-01-15 23:45:38 Current block height: "100729" - No new block for 20 sec.
2020-01-15 23:45:58 New block height: "100840"
2020-01-15 23:46:18 New block height: "100872"
2020-01-15 23:46:38 New block height: "100938"
2020-01-15 23:46:58 New block height: "101098"
2020-01-15 23:47:19 New block height: "101130"
2020-01-15 23:47:39 New block height: "101194"
2020-01-15 23:47:59 New block height: "101234"
2020-01-15 23:48:19 New block height: "101330"
2020-01-15 23:48:39 New block height: "101362"
2020-01-15 23:48:59 New block height: "101507"
2020-01-15 23:49:19 New block height: "101577"
2020-01-15 23:49:39 New block height: "101673"
2020-01-15 23:49:59 New block height: "101769"
2020-01-15 23:50:19 New block height: "101801"
2020-01-15 23:50:39 New block height: "101888"
2020-01-15 23:51:00 Current block height: "101888" - No new block for 20 sec.
2020-01-15 23:51:20 Current block height: "101888" - No new block for 40 sec.
2020-01-15 23:51:40 Current block height: "101888" - No new block for 60 sec.
2020-01-15 23:52:00 Current block height: "101888" - No new block for 80 sec.
2020-01-15 23:52:20 Current block height: "101888" - No new block for 100 sec.
2020-01-15 23:52:40 Current block height: "101888" - No new block for 120 sec.
2020-01-15 23:53:00 Current block height: "101888" - No new block for 140 sec.
2020-01-15 23:53:20 Current block height: "101888" - No new block for 160 sec.
2020-01-15 23:53:40 Current block height: "101888" - No new block for 180 sec.
2020-01-15 23:54:00 New block height: "101889"
2020-01-15 23:54:20 New block height: "101890"
2020-01-15 23:54:41 Current block height: "101890" - No new block for 20 sec.
2020-01-15 23:55:01 Current block height: "101890" - No new block for 40 sec.
2020-01-15 23:55:21 Current block height: "101890" - No new block for 60 sec.
2020-01-15 23:55:41 Current block height: "101890" - No new block for 80 sec.
2020-01-15 23:56:01 Current block height: "101890" - No new block for 100 sec.
2020-01-15 23:56:21 Current block height: "101890" - No new block for 120 sec.
2020-01-15 23:56:41 Current block height: "101890" - No new block for 140 sec.
2020-01-15 23:57:01 Current block height: "101890" - No new block for 160 sec.
2020-01-15 23:57:21 Current block height: "101890" - No new block for 180 sec.
2020-01-15 23:57:41 Current block height: "101890" - No new block for 201 sec.
2020-01-15 23:58:02 Current block height: "101890" - No new block for 221 sec.
2020-01-15 23:58:22 Current block height: "101890" - No new block for 241 sec.
2020-01-15 23:58:42 Current block height: "101890" - No new block for 261 sec.
2020-01-15 23:59:02 Current block height: "101890" - No new block for 281 sec.
2020-01-15 23:59:22 Current block height: "101890" - No new block for 301 sec.
2020-01-15 23:59:42 Current block height: "101890" - No new block for 321 sec.
2020-01-16 00:00:02 Current block height: "101890" - No new block for 341 sec.
2020-01-16 00:00:22 Current block height: "101890" - No new block for 361 sec.
2020-01-16 00:00:22 Stopping jormungandr
Success
Sleeping for 5 sec.
Restarting shelley.service
Sleeping for 60 sec.
No block height
No block height
 kakerley
on 16 Jan 2020
kakerley
on 16 Jan 2020
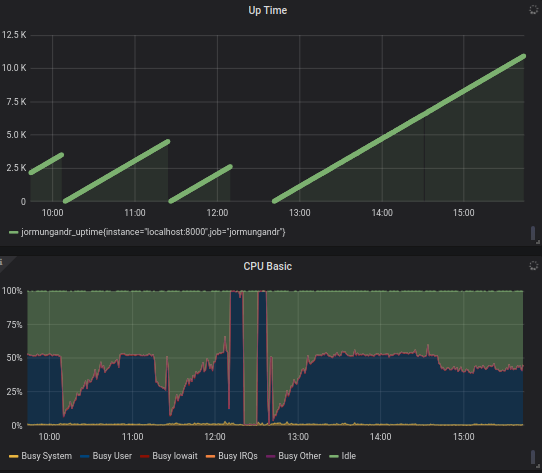
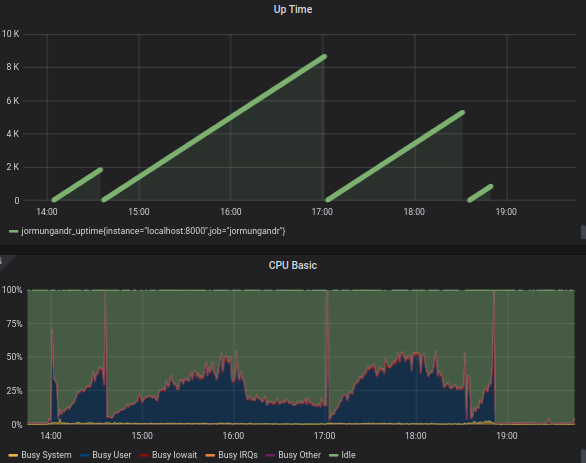
0.8.6 has been super stable for me. Thank you. Here is my config, hopefully it helps others finding that the needle in the hay stack. don't forget about other tweak such as ulimit open files, sync the clock with ntp, tcp configuration tweak. Notice the last few hours in the chart, that uses 0.8.6.
-sk
log:
- output: stderr
  format: plain
  level: debug
p2p:
  topics_of_interest:
    blocks: high
    messages: high
  public_address: "/ip4/<ip>/tcp/3000"
  listen_address: "/ip4/0.0.0.0/tcp/3000"
  public_id: <public id>
  max_unreachable_nodes_to_connect_per_event: 10
  max_connections: 480
  trusted_peers:
    - address: /ip4/54.183.149.167/tcp/3000
      id: df02383863ae5e14fea5d51a092585da34e689a73f704613
    - address: "/ip4/52.8.15.52/tcp/3000"
      id: 18bf81a75e5b15a49b843a66f61602e14d4261fb5595b5f5
    - address: "/ip4/52.28.91.178/tcp/3000"
      id: 23b3ca09c644fe8098f64c24d75d9f79c8e058642e63a28c
    - address: "/ip4/3.125.75.156/tcp/3000"
      id: 22fb117f9f72f38b21bca5c0f069766c0d4327925d967791
    - address: "/ip4/13.114.196.228/tcp/3000"
      id: 7e1020c2e2107a849a8353876d047085f475c9bc646e42e9
    - address: "/ip4/13.112.181.42/tcp/3000"
      id: 52762c49a84699d43c96fdfe6de18079fb2512077d6aa5bc
    - address: "/ip4/3.124.116.145/tcp/3000"
      id: 99cb10f53185fbef110472d45a36082905ee12df8a049b74
    - address: /ip4/13.56.0.226/tcp/3000
      id: 7ddf203c86a012e8863ef19d96aabba23d2445c492d86267
    - address: /ip4/52.9.77.197/tcp/3000
      id: fcdf302895236d012635052725a0cdfc2e8ee394a1935b63
    - address: /ip4/18.177.78.96/tcp/3000
      id: fc89bff08ec4e054b4f03106f5312834abdf2fcb444610e9
    - address: /ip4/3.115.154.161/tcp/3000
      id: 35bead7d45b3b8bda5e74aa12126d871069e7617b7f4fe62
    - address: /ip4/18.182.115.51/tcp/3000
      id: 8529e334a39a5b6033b698be2040b1089d8f67e0102e2575
    - address: /ip4/18.184.35.137/tcp/3000
      id: 06aa98b0ab6589f464d08911717115ef354161f0dc727858
    - address: /ip4/3.125.31.84/tcp/3000
      id: 8f9ff09765684199b351d520defac463b1282a63d3cc99ca
    - address: /ip4/3.125.183.71/tcp/3000
      id: 9d15a9e2f1336c7acda8ced34e929f697dc24ea0910c3e67
rest:
  listen: 127.0.0.1:3100
leadership:
  log_ttl: 24h
  garbage_collection_interval: 15m
storage: /home/sk/storage
explorer:
  enabled: false
mempool:
  fragment_ttl: 5m
  log_ttl: 24h
  garbage_collection_interval: 15m
  pool_max_entries: 10000
  log_max_entries: 100000
blockRecvCnt: 1236
lastBlockContentSize: 0
lastBlockDate: "33.22705"
lastBlockFees: 0
lastBlockHash: d35992e668622c01a4f440cb4a3577cbde564ca657faa356944972ac1d98dd24
lastBlockHeight: "102887"
lastBlockSum: 0
lastBlockTime: "2020-01-16T07:50:27+00:00"
lastBlockTx: 0
lastReceivedBlockTime: "2020-01-16T07:50:32+00:00"
state: Running
txRecvCnt: 406
uptime: 11466
version: jormungandr 0.8.6-76863977
skokasik
on 16 Jan 2020
confirming - 0.8.6.
cardanians
on 16 Jan 2020
One helpful way to debug this is to obtain a backtrace for all threads when the CPU busy-looping is reproduced, by performing either of these:
- Attach to the jormungandr process with the debugger and dump the backtraces for all threads;
- On Linux or Mac OS, kill jormungandr with
kill -ABRTand dump the backtraces with the debugger from the core dump (which needs to be enabled).
mzabaluev
on 16 Jan 2020
Also, dump the sockets that the jormungandr process has open at this time, with lsof -nP or ss. Please make sure to filter the output so that only TCP sockets used by jormungandr are included.
mzabaluev
on 16 Jan 2020
Even though I do not get CPU spikes when the node goes into zombie mode and falls behind, the sockets used continue to increase...
Running for an extended period of time:
$  cat lsof.out | wc -l # Only Jormungandr
435
$ vmstat -z | grep socket
# ITEM                   SIZE  LIMIT     USED     FREE      REQ FAIL SLEEP
socket:                 872, 129716,    1498,      10,  179134,   0,   0
Here is the logs when the CPU spiked:
logs.zip
 stanfieldr
on 16 Jan 2020
stanfieldr
on 16 Jan 2020
public_id:
max_unreachable_nodes_to_connect_per_event: 10
max_connections: 480
Are all invalid options both in p2p and in the global section so how did you actually put these in? Maybe use the insert code
<?php phpinfo(); ?>
next time when you post, it works as intended unlike your rant.
 ghost
on 16 Jan 2020
ghost
on 16 Jan 2020
Related issues
stanfieldr
·
42Comments
 rinor
·
11Comments
rinor
·
11Comments
 dorin100
·
13Comments
dorin100
·
13Comments
 disassembler
·
14Comments
disassembler
·
14Comments
 MarcelKlammer
·
12Comments
MarcelKlammer
·
12Comments
Most helpful comment
I am experiencing the same problem.
Required Info
Max Connections set to: 1024Observations: Increase in CPU, culminating with spikes in cpu usage and associated spikes in tcp connections, socket memory, and tcp memory. Jormungandr terminates in error via a "network" panic. See below.
UPDATE: I notice the same behavior with the default max_connections of 256. The period of these observations are about 50 min to 1 hour from node restart.