Jormungandr: REST service times out
Describe the bug
Initially after bootstrapping you can use the node stats via the rest api just fine. But for some reason as time goes on when you try to get node stats it starts to time out. This started happening in 8.7
Mandatory Information
1 .jcli 0.8.7 (HEAD-364cd84e, release, linux [x86_64]) - [rustc 1.40.0 (73528e339 2019-12-16)]
- jormungandr 0.8.7 (HEAD-364cd84e, release, linux [x86_64]) - [rustc 1.40.0 (73528e339 2019-12-16)]
To Reproduce
Steps to reproduce the behavior:
- Bootstrap a node off 8.7
- Wait for 200-800 sec uptime
- Try to get node stats
- See error
Expected behavior
The stats to be returned
 stanfieldr
All 42 comments
@stanfieldr thanks for the report. Can you check and report what is the total memory usage of your machine at the moment the issue happens.
 rinor
on 23 Jan 2020
rinor
on 23 Jan 2020
@rinor
I have the same issue and my total memory usage was 1,5Go-1,6Go out of 4Go.
When using 0.8.6, my memory usage is 1,3Go max
 ofakem-banock
on 23 Jan 2020
ofakem-banock
on 23 Jan 2020
I have the same issue on one of my nodes so cannot do a proper failover. @stanfieldr could you please set a proper title for this issue which is actually meaningful?
Suggestion: "Stats timeout on v0.8.7"
 Straightpool
on 23 Jan 2020
Straightpool
on 23 Jan 2020
I've seen this issue as well.

 rickymac68
on 23 Jan 2020
rickymac68
on 23 Jan 2020
Interestingly when I had this happen the REST query leader logs was still working instantly, it was just the stats query which was slow or timing out.
Straightpool
on 23 Jan 2020
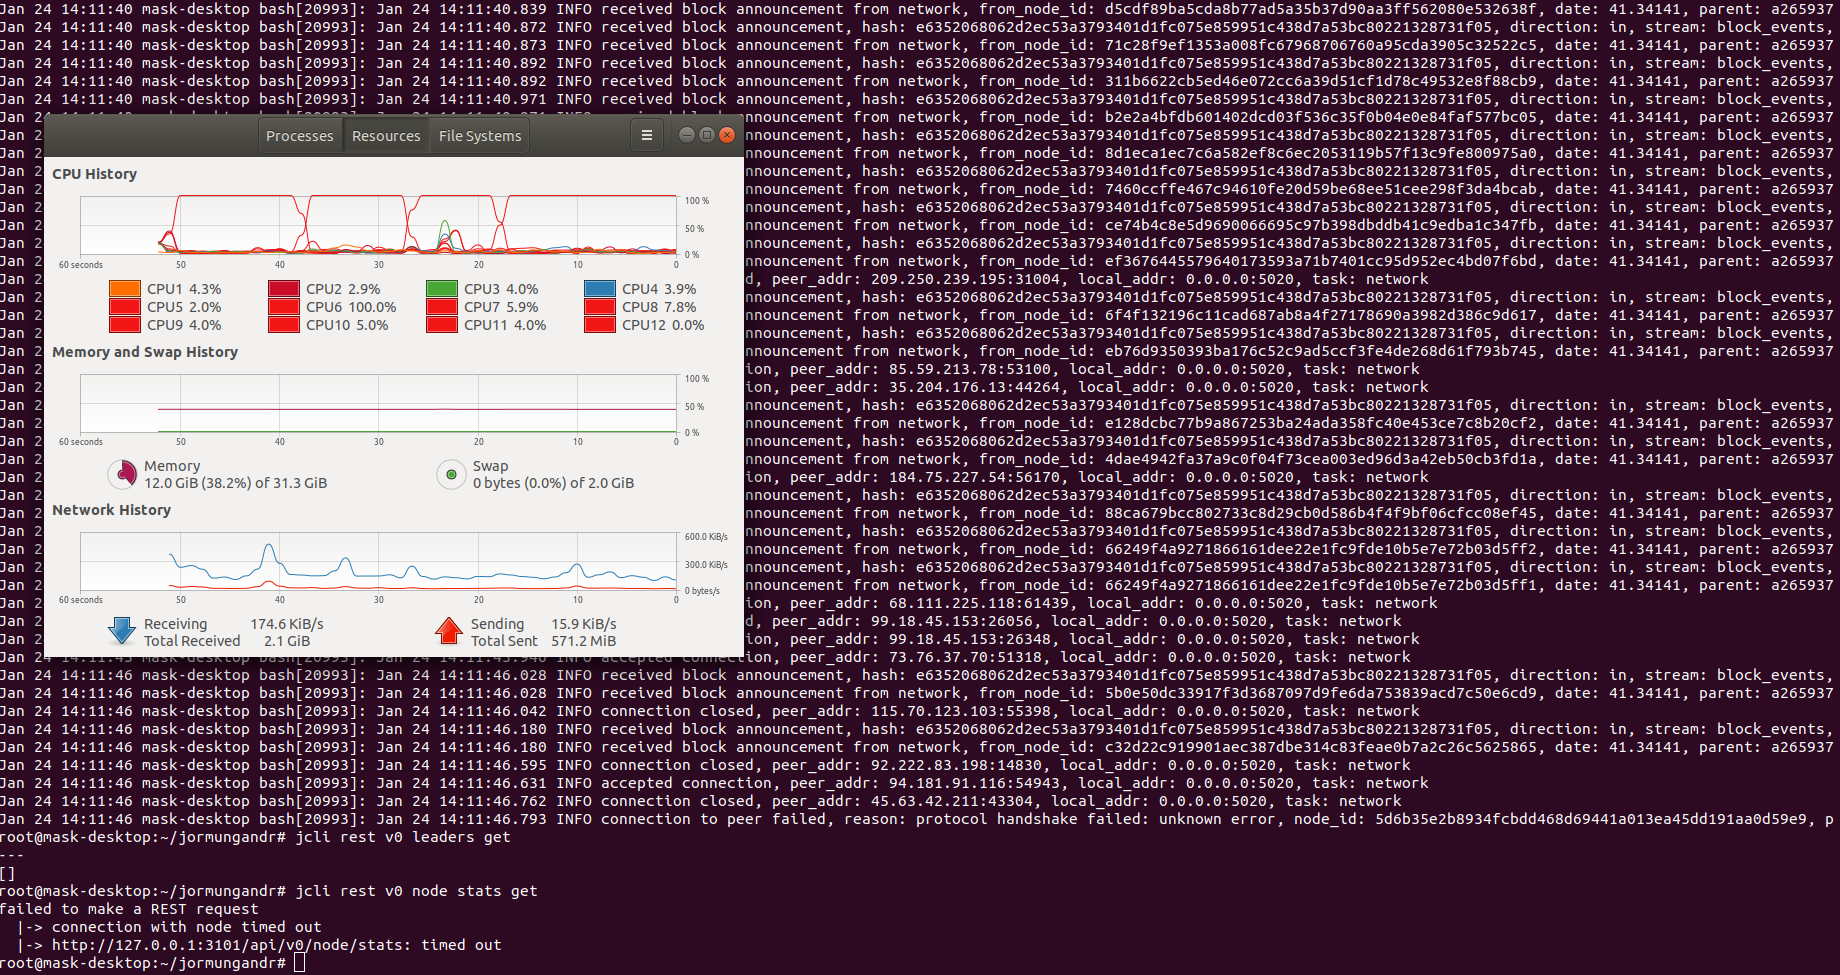
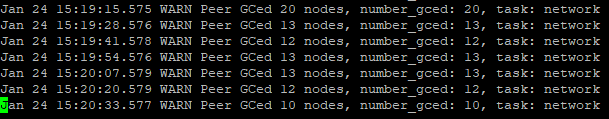
On my pool the rest service becomes unavailable after CPU hits over 100% for a minute or so. Then the following messages start to appear in the logs:
Jan 24 00:17:20.744 WARN Peer GCed 41 nodes, number_gced: 41, task: network
Jan 24 00:17:33.744 WARN Peer GCed 62 nodes, number_gced: 62, task: network
Jan 24 00:18:12.743 WARN Peer GCed 61 nodes, number_gced: 61, task: network
Jan 24 00:18:25.743 WARN Peer GCed 60 nodes, number_gced: 60, task: network
Jan 24 00:18:38.748 WARN Peer GCed 55 nodes, number_gced: 55, task: network
Jan 24 00:18:51.742 WARN Peer GCed 47 nodes, number_gced: 47, task: network
Jan 24 00:19:04.743 WARN Peer GCed 49 nodes, number_gced: 49, task: network
Jan 24 00:19:17.747 WARN Peer GCed 37 nodes, number_gced: 37, task: network
Jan 24 00:19:30.743 WARN Peer GCed 27 nodes, number_gced: 27, task: network
Jan 24 00:19:43.743 WARN Peer GCed 15 nodes, number_gced: 15, task: network
...
...
Jan 24 00:21:02.637 WARN response canceled by the processing task, request: PushHeaders, sub_task: server, task: network
Jan 24 00:21:02.637 WARN response canceled by the processing task, request: PushHeaders, sub_task: server, task: network
Jan 24 00:21:02.653 ERRO cannot process network headers, reason: Error(Elapsed), sub_task: chain_pull, task: block
Jan 24 00:21:02.654 WARN response canceled by the processing task, request: PushHeaders, sub_task: server, task: network
Jan 24 00:21:02.666 ERRO cannot process network headers, reason: Error(Elapsed), sub_task: chain_pull, task: block
Jan 24 00:21:02.667 WARN response canceled by the processing task, request: PushHeaders, sub_task: server, task: network
Jan 24 00:21:02.686 ERRO cannot process network headers, reason: Error(Elapsed), sub_task: chain_pull, task: block
Jan 24 00:21:02.687 WARN response canceled by the processing task, request: PushHeaders, sub_task: server, task: network
Jan 24 00:21:02.688 ERRO cannot process network headers, reason: Error(Elapsed), sub_task: chain_pull, task: block
Jan 24 00:21:02.688 WARN response canceled by the processing task, request: PushHeaders, sub_task: server, task: network
Jan 24 00:21:02.733 ERRO cannot process network headers, reason: Error(Elapsed), sub_task: chain_pull, task: block
Before that node bootstrapped very quickly and it run approximately for 700 seconds before the messages above started to appear. Memory was OK - within limits.
 uipavec
on 24 Jan 2020
uipavec
on 24 Jan 2020
I was testing out a new machine with the E3-1270v6 cpu and 32GB of RAM @ 2048 connections with a gossip interval of 1s and a 1gbps uplink. When I noticed I was forking the network due to connection time outs I stopped paying for the server immediately, so I'm not sure how much RAM I was using. I can however say I was, and still am running another server with much lower specs on commit ac36553c in master and I have not experienced this issue, so it must have been a change after that. JCLI on that machine was compiled back in 8.5 though, not sure if the two projects may impact each other. If useful, my script was calling the rest api directly through port 80, not through jcli. SSHing into the machine manually and running jcli had the same timeout problem though
stanfieldr
on 24 Jan 2020
I found hitting the REST API twice per second causes it to crash but for the last ~24 hours only hitting it once per second it did not crash.
Edit: correction - it just crashed a node.
rickymac68
on 24 Jan 2020
Seems to only occur with the JCLI Node stats and Network stats get for me.
 adavibesp
on 24 Jan 2020
adavibesp
on 24 Jan 2020
observation i made:
- get node stats works after initial bootstrap.
- new field peerUnreachableCnt is at +-100
- 2th time display of node stats takes a bit longer, when node stats shows i saw peerUnreachableCnt at +- 200
-3th time the same, display node stats takes a bit longer than the 2th time peerUnreachableCnt rised to +400 - 4th time -> fail
after this node stats give a time out.
 jeroenvhove
on 24 Jan 2020
jeroenvhove
on 24 Jan 2020
@jeroenvhove Not sure this is related to the peerUnreachableCnt.
I have two nodes well over 400 of this and they are running fine (no delay in node stats get)
blockRecvCnt: 3014
lastBlockContentSize: 0
lastBlockDate: "41.33627"
lastBlockFees: 0
lastBlockHash: d04d855dd918535ff2cb279ad67e8f3caad34925cde598c4c8c70ebbbdddf642
lastBlockHeight: "127419"
lastBlockSum: 0
lastBlockTime: "2020-01-24T13:54:31+00:00"
lastBlockTx: 0
lastReceivedBlockTime: "2020-01-24T13:54:31+00:00"
peerAvailableCnt: "62707"
peerQuarantinedCnt: "59330"
peerUnreachableCnt: "1972"
state: Running
txRecvCnt: 1330
uptime: 62484
version: jormungandr 0.8.7-364cd84
blockRecvCnt: 3154
lastBlockContentSize: 315
lastBlockDate: "41.33684"
lastBlockFees: 800000
lastBlockHash: 52853b9da1d28c531614d84304e1b64fd16e578d81a409ead8cba1a014c7b168
lastBlockHeight: "127425"
lastBlockSum: 1003912904971
lastBlockTime: "2020-01-24T13:56:25+00:00"
lastBlockTx: 1
lastReceivedBlockTime: "2020-01-24T13:56:25+00:00"
peerAvailableCnt: "74174"
peerQuarantinedCnt: "51835"
peerUnreachableCnt: "1955"
state: Running
txRecvCnt: 1384
uptime: 62604
version: jormungandr 0.8.7-364cd84
What I have observed is that if the server is running close to 100% CPU and Memory utilisation, this hang is more likely to happen (which I've seen on my other busy host)
 PegasusPool
on 24 Jan 2020
PegasusPool
on 24 Jan 2020
I've just bootstrapped from yet another machine and I never got to see the node stats after the bootsrap status was gone.
jcli rest v0 leaders getreturns without delayjcli rest v0 node stats gethangs for 20-30s then times out- One of my cores are always on 100% utilisation (note the cycles), even while not querying node stats as well.
PegasusPool
on 24 Jan 2020
After restarting jormungandr, the CPU utilisation seems to be normal and there is no issue with the node stats endpoint.

After a few minutes, node stats call times out again and I can see one of the CPU cores are always on 100% utilisation
PegasusPool
on 24 Jan 2020
found hitting the REST API twice per second causes it to crash
As I was using graphana to monitor my pool, I noticed that everything went back to normal (no timed-out error) after stopping it. So maybe the problem really comes from hitting the REST API too much as @rickymac68 said
ofakem-banock
on 24 Jan 2020
Unlikely @ofakem-banock I'm not hitting the rest API periodically at all, and I still observe the issue.
PegasusPool
on 24 Jan 2020
Same here, 1 of the 6 CPU's is always at 100%.
With or without grafana/prometheus active issue seems to be same.
no special things found in the logs only this:
Thats about all i can tell.
jeroenvhove
on 24 Jan 2020
There is a whole lot of synchronous locking over gratuitously shared state for the REST server.
The REST handlers for stats requests also lock the topology object; while this has been converted to use async-friendly locking, data extraction operations performed across the entire peer map lock out network threads.
This needs to be refactored, otherwise we'll keep running into these issues.
 mzabaluev
on 24 Jan 2020
mzabaluev
on 24 Jan 2020
I think this issue applies to more than just node stats get. It just so happens that people use that one the most. Probably applies to all the jcli commands that call the REST interface.
rickymac68
on 25 Jan 2020
I get it only on the Node Stats and Network Stats get. Probably has to do with the new network info that has been introduced in 0.8.7 ?
adavibesp
on 25 Jan 2020
These log messages from 0.8.8 may be related:
Jan 30 09:59:34.557 INFO connection closed, peer_addr: 136.34.11.185:64518, local_addr: 0.0.0.0:3000, task: network
Jan 30 09:59:34.557 DEBG a client peer connection has been closed, active_connections: 255, local_addr: 0.0.0.0:3000, task: network
Jan 30 09:59:34.671 INFO connection closed, peer_addr: 68.75.78.164:51674, local_addr: 0.0.0.0:3000, task: network
Jan 30 09:59:34.671 DEBG a client peer connection has been closed, active_connections: 254, local_addr: 0.0.0.0:3000, task: network
Jan 30 09:59:34.691 DEBG subscription stream closed, direction: out, stream: block_events, node_id: 05a5641c2c26b07c7a7ef325987499e3150f88e6772c126c, sub_task: server, task
: network
Jan 30 09:59:34.691 DEBG subscription stream closed, direction: in, stream: block_events, node_id: 05a5641c2c26b07c7a7ef325987499e3150f88e6772c126c, sub_task: server, task:
 network
Jan 30 09:59:34.691 DEBG subscription stream closed, direction: out, stream: fragments, node_id: 05a5641c2c26b07c7a7ef325987499e3150f88e6772c126c, sub_task: server, task: n
etwork
Jan 30 09:59:34.691 DEBG subscription stream closed, direction: in, stream: fragments, node_id: 05a5641c2c26b07c7a7ef325987499e3150f88e6772c126c, sub_task: server, task: ne
twork
Jan 30 09:59:34.691 DEBG subscription stream closed, direction: out, stream: gossip, node_id: 05a5641c2c26b07c7a7ef325987499e3150f88e6772c126c, sub_task: server, task: netw
ork
Jan 30 09:59:34.691 DEBG subscription stream closed, direction: in, stream: gossip, node_id: 05a5641c2c26b07c7a7ef325987499e3150f88e6772c126c, sub_task: server, task: netwo
rk
Jan 30 09:59:34.924 DEBG subscription stream closed, direction: in, stream: fragments, node_id: 6169eba2b337d52728053a27f36e0467024ac851dd62a3d9, sub_task: server, task: ne
twork
Jan 30 09:59:34.924 DEBG inbound subscription stream terminated by the peer, direction: in, stream: fragments, node_id: 6169eba2b337d52728053a27f36e0467024ac851dd62a3d9, su
b_task: server, task: network
Jan 30 09:59:34.924 DEBG subscription stream closed, direction: in, stream: gossip, node_id: 6169eba2b337d52728053a27f36e0467024ac851dd62a3d9, sub_task: server, task: netwo
rk
Jan 30 09:59:34.924 DEBG inbound subscription stream terminated by the peer, direction: in, stream: gossip, node_id: 6169eba2b337d52728053a27f36e0467024ac851dd62a3d9, sub_t
ask: server, task: network
Jan 30 09:59:34.926 INFO connection closed, peer_addr: 77.68.3.39:42534, local_addr: 0.0.0.0:3000, task: network
Jan 30 09:59:34.926 DEBG a client peer connection has been closed, active_connections: 253, local_addr: 0.0.0.0:3000, task: network
Jan 30 09:59:34.945 INFO connection closed, peer_addr: 126.2.173.74:52005, local_addr: 0.0.0.0:3000, task: network
Jan 30 09:59:34.945 DEBG a client peer connection has been closed, active_connections: 252, local_addr: 0.0.0.0:3000, task: network
Jan 30 09:59:37.049 ERRO cannot process network blocks, reason: Error(Elapsed), task: block
Jan 30 09:59:37.379 INFO received block announcement from network, from_node_id: 7ddf203c86a012e8863ef19d96aabba23d2445c492d86267, date: 47.24780, parent: f0fc5a51e44daf395ea6fe62b1185c266f0ee4151335da95c71248f4809451bd, hash: 68a0706353c6eb7492c4be8807a75070d590b4a5cd5dd6e4e902c4500b81180f, task: block
Jan 30 09:59:37.379 DEBG block is missing a locally stored parent, from_node_id: 7ddf203c86a012e8863ef19d96aabba23d2445c492d86267, date: 47.24780, parent: f0fc5a51e44daf395ea6fe62b1185c266f0ee4151335da95c71248f4809451bd, hash: 68a0706353c6eb7492c4be8807a75070d590b4a5cd5dd6e4e902c4500b81180f, task: block
 mark-stopka
on 30 Jan 2020
mark-stopka
on 30 Jan 2020
@mark-stopka, you still have this issue?
For me on 8.8 it is as fast as lightning.
also, i just reverted back to 8.7 to test for this ticket and... its also super fast, even after 2000sec uptime -> problem is gone.
what i have found out though is following: recently i switched to a new provider. with new provider it went good untill suddenly they did a firmware update of the modem.
after that i had to limit max connections to max 150 to make it work more or less.
no good support from provider, a lot of calls to support team,...
long story short -> if found issue myself with some handy google work, modem had issue with NAT loopback
replaced modem with new one WITH NAT loopback support and presto.
super happy for the moment
maybe you should check the NAT loopback as well?
-> would mean that jormungandr is using the external IP as well to perform some actions
Jeroen
jeroenvhove
on 30 Jan 2020
@jeroenvhove,
yes the issue is still present and will be until #1645 is resolved as the root-cause has been identified.
mark-stopka
on 30 Jan 2020
root cause = NAT loopback?
you can find lists online for what modem supports it and which one does'nt.
solution in #1645 seems more like a workaround and not the real root cause.
Anyway, for me it seems fixed. I hope you find a solution/fix for you as well.
jeroenvhove
on 30 Jan 2020
I suspect this is a related to changing the p2p topology lock from RW to a standard Mutex lock. A revert was proposed in #1653 as there was no suitable asynchornous locking mechanism available without upgrading everything to tokio 0.2 at the time (unless just going back to an Arc ref lock is okay?).
It makes sense that its a deadlock to me given that peer stats were introduced around the same time and added to this specific rest handler. At the time, this would result in the handler thread requesting a read lock. Now it will request the same write lock as other threads querying or updating the p2p topology state. Will try to confirm later tonight.
 michaeljfazio
on 30 Jan 2020
michaeljfazio
on 30 Jan 2020
Hi guys, good news I just installed v0.8.9 and the issue is resolved. In v0.8.8 I still had the problem. Also bootstrapping was really fast.
 cardaspians
on 30 Jan 2020
cardaspians
on 30 Jan 2020
Sorry, looks like I was too fast. The bug is still there, the node stopped responding to JCLI request after 15 min. The number of incoming connections stayed the same 365, number of outgoing connections 0
cardaspians
on 30 Jan 2020
In v8.8 I experienced it as well and noticed when it started having issues correlated with a large amount of connections being made. Went from 400 connections to 700 within the time it started spiking CPU and not responding. #1645 will probably fix it :crossed_fingers:
stanfieldr
on 30 Jan 2020
It is indeed only the jcli rest v0 node stats which times out. The other jcli commands are still working. The stats commands responses are becoming slower and slower until it times out after around 15min. At the same moment the number of outgoing connection also decrease to almost 0, 1 or max 3 connections. So according to me the stats commands also blocks the opening of new outgoing connections. Incoming connections remain the same, around 325 connections. Hopefully this helps the developers. Succes.
cardaspians
on 30 Jan 2020
just curious, do you guys see
update current branch tip OR
INFO switching branch from
loggings after rest stats call stopped responding?
from the OP's screen shot, the cause of this issue looks similar to #1607,
at least 3 of my nodes has been experiencing it.
basically this will happen when the node receives many incoming block notifications on the same slot, and if that block is deemed missing local parent.. EACH incoming block will start it's own connection to find its parent.
And that's the start of a snowball effect from what I can tell, because most likely the next incoming block will start the same process because it'd take some time before the previous block is applied to the storage and it's usually too late.
 fish2plain
on 30 Jan 2020
fish2plain
on 30 Jan 2020
To add a bit of maybe related info. We're seeing this happen mainly on nodes that differ only in having the max unreachable nodes set to 0. After increasing it to 100 the nodes seem much more stable now.
 manveru
on 31 Jan 2020
manveru
on 31 Jan 2020
I consistently have the problem on nodes with max_unreachable_nodes_to_connect_per_event set to 16, 64, or 128.
On Friday, January 31, 2020, 4:54:01 AM PST, Michael Fellinger <[email protected]> wrote:
To add a bit of maybe related info. We're seeing this happen mainly on nodes that differ only in having the max unreachable nodes set to 0. After increasing it to 100 the nodes seem much more stable now.
—
You are receiving this because you are subscribed to this thread.
Reply to this email directly, view it on GitHub, or unsubscribe.
 shawnim
on 1 Feb 2020
shawnim
on 1 Feb 2020
Just a heads-up; issue appears to be still present in 0.8.10.
mark-stopka
on 14 Feb 2020
The issue is still present in 0.8.11, rolling back to 0.8.6
cardaspians
on 19 Feb 2020
I think this issue is reproducible only when running multiple Jormungandr instances on a same host with NAT without proper isolation between individual instances. When I set-up multiple instances but block traffic between them I am not getting this issue even though my HEALTHCHECK is querying the API every 1s.
mark-stopka
on 25 Feb 2020
I really think you should lookup NAT loopback like i mentioned before (twice). Your latest description seems to confirm my suspicion.
To check my theory I would suggest you add a static route on your server for your external IP pointing to a non-existing IP within your local subnet. (make sure its within your local subnet)
I'm not a specialist, just somebody who likes to help and uses google from time to time.
don't shoot at me if it does not work :)
jeroenvhove
on 25 Feb 2020
@jeroenvhove, yes we are aware of RFC5128 that describes how applications should deal with the issue. hairpinning is only a workaround that many enterprise-grade NAT deployments don't support. The issue is with the software, as the implications are quite obvious, see #1839, #1072 and #839 where we discussed issues connected with dynamic IPs, user-configured NAT and Carrier Grade NAT quite extensively.
mark-stopka
on 25 Feb 2020
I am not running multiple nodes on a single server. I am not using NAT, I have a static IP.As mentioned in #1812 this still happens for me on v0.8.11 although much less often now.
On Tuesday, February 25, 2020, 9:18:37 AM PST, Mark Stopka <[email protected]> wrote:
@jeroenvhove, yes we are aware of RFC5128 that describes how applications should deal with the issue. hairpinning is only a workaround that many enterprise-grade NAT deployments don't support. The issue is with the software, as the implications are quite obvious, see #1839, #1072 and #839 where we discussed issues connected with dynamic IPs, user-configured NAT and Carrier Grade NAT quite extensively.
—
You are receiving this because you are subscribed to this thread.
Reply to this email directly, view it on GitHub, or unsubscribe.
shawnim
on 25 Feb 2020
Hi guys, good news I just installed v0.8.13 and the issue seems to be resolved for me. The node stays stable. I noticed that the number of incoming connections is much lower (~11) compared to v0.8.6 (~100). I am running a 1:1 NAT setup on VPS setup.
cardaspians
on 26 Feb 2020
Altough the REST node stats keeps running, the node cannot keep in sync with the tip. My number of outgoing connections is still very low ~10 compared to the incoming ones ~100. I had to roll back to v.0.8.6, there the nodes stays in sync for most of the time, ~1 forced restart due to stalled block height. The number of outgoing connections is now ~100. It seems that for some reason the node running v0.8.13 is blocked somewhere in opening new outgoing connections? Anybody an idea what could be the reason for this?
cardaspians
on 29 Feb 2020
@cardaspians
v0.8.13 seems to build up connections slower than previous versions, but supposedly the connections are better quality..
But you would need to give it a chance to build up the connections though.
So I would suggest run v0.8.13 as a passive node along with your v0.8.9 node.. For v0.8.13, set public ip/id(you can use the same IP but different port than your V0.8.9 node), max connection to 1028 or above, 15s gossip; and just let it run for couple days( of course you should restart it if the tip is off too much, sounds like you already have a restart script, just use it with a higher threshold like 20 mins).
Basically just try to get your ip/port out there and hopefully the new node will eventually connect to a ring that has lots of good peers..
Couple things you should monitor, for both your new 8.12 and 8.9 nodes:
you should monitor the INFO log for the number of incoming block announcements per each slot.. that's in additional to monitoring of the tip because not only you want your node getting the latest block, preferable there are more than a few of peers sending you the same block.
Good luck!
fish2plain
on 3 Mar 2020
@fish2plain thanks for the useful info. Am I correct that when the v0.8.13 is running stable in passive mode I can promote the node to leader via jcli rest v0 leaders post -f node_secret.yaml -h and demote my other node to passive? I am using a stuck_node_mon.sh restart script with a block timeout of 10min. I will increase it to 20min. Any advice what I should use to monitor the incoming block anouncement per slot?
cardaspians
on 3 Mar 2020
on multiple leaders setup I know couple popular choices
- use a 2 nodes setup script by rdlrt:
- more elaborate setup, more than 2 nodes, Andrew(author) has a TQ channel: https://t.me/jormanager
https://bitbucket.org/muamw10/jormanager/src/develop/
But the basic flow is as follows:
- start all nodes with the node secret, if you are doing this manually, nodes can be on different hosts.
immediately demote nodes that you don’t want as leader after bootstrapped using jcli rest v0 leaders delete $slot (get the $slot using jcli rest v0 leaders get)
just ON or BEFORE the epoch switch time: 19:13 UTC, use jcli rest v0 leaders post -f to promote all those demoted nodes in step 2 as leader nodes. So they get the leader logs , and they all can be readily promote to leader for the new epoch if needed. After epoch switch is over, I think it will take less than 1 min.. demote all but one node.
couple things I usually look for in the INFO or DEBUG log..
- check number of incoming announcements per slot.. you might need modify to suit your need, especially the
$13, it’s the date slot in epoch.slot format that I’m interested in),
grep "date:” jormungandr.log | grep "INFO” | awk '{print $13}’ | sort -g | uniq -c | sort -k 2
- also the branch/tip INFO (you can tail the log as well)
egrep “update current|switch” jormungandr.log
and if you have DEBUG logging, I like to see the following as well. “applying” and “applied” timestamp will tell you if there is latency in disk write. “missing” is to monitor for issue #1607, which still happens with new version but less often.
egrep “update current|switch|applied|applying|missing” jormungandr.log
Good luck and please let us know if you found better alternatives.
On Mar 3, 2020, at 11:52 AM, cardaspians notifications@github.com wrote:
@fish2plain https://github.com/fish2plain thanks for the useful info. Am I correct that when the v0.8.13 is running stable in passive mode I can promote the node to leader via jcli rest v0 leaders post -f node_secret.yaml -h and demote my other node to passive? I am using a stuck_node_mon.sh restart script with a block timeout of 10min. I will increase it to 20min. Any advice what I should use to monitor the incoming block anouncement per slot?
—
You are receiving this because you were mentioned.
Reply to this email directly, view it on GitHub https://github.com/input-output-hk/jormungandr/issues/1626?email_source=notifications&email_token=AGDR3MOJLDAFQSAVJ5GYOWLRFVNWDA5CNFSM4KKSPPSKYY3PNVWWK3TUL52HS4DFVREXG43VMVBW63LNMVXHJKTDN5WW2ZLOORPWSZGOENU45II#issuecomment-594136737, or unsubscribe https://github.com/notifications/unsubscribe-auth/AGDR3MN3YJKSYJJJBRPBATDRFVNWDANCNFSM4KKSPPSA.
fish2plain
on 3 Mar 2020
Related issues
 consuman
·
16Comments
consuman
·
16Comments
 NicolasDP
·
19Comments
NicolasDP
·
19Comments
 Linicks
·
13Comments
rickymac68
·
18Comments
Linicks
·
13Comments
rickymac68
·
18Comments
 bjarnekvae
·
12Comments
bjarnekvae
·
12Comments
Most helpful comment
There is a whole lot of synchronous locking over gratuitously shared state for the REST server.
The REST handlers for stats requests also lock the topology object; while this has been converted to use async-friendly locking, data extraction operations performed across the entire peer map lock out network threads.
This needs to be refactored, otherwise we'll keep running into these issues.