Jormungandr: error while streaming response: Error { code: Internal, cause: CannotIterate }, sub_task: server, task: network
Describe the bug
Under certain (not easily) reproducible circumstances the node fails to broadcast the blocks to another node (while being able to receive blocks from this other node). To simplify the logs analysis we will focus on two nodes only, expanding later on cases with more nodes, explaining what are the possible effects of this issue (forking being the main one).
When this happens we see the following respective logs:
- on sending side:
Oct 31 19:57:36.107 WARN error while streaming response: Error { code: Internal, cause: CannotIterate }, sub_task: server, task: network
Oct 31 19:57:36.108 DEBG encoder inner stream error: Status { code: Internal, message: "internal processing error" }, scope: global
- on receiving side:
Oct 31 19:57:36.109 INFO PullBlocksToTip response stream failed: Error { code: Internal, source: Status { code: Internal, message: "internal processing error" } }, node_id: 5dfaeed5c64de65bdca6ffdf5985c50b1ed9226cc72657cdc580b814b8b4fb27, peer_addr: 127.0.0.11:9001, task: network
Let's define some terms first.
- GenesisWithActiveStake - (a93cf67dac50f84f2b74f3cccad1c21a2df2c364037e5dc1dd8017c1d320fc9d) - is a genesis node with an active stake
- ExtraPoolWithActiveStake - (2f3471d99a42e3c75362ea3a217f190143675300ca9893edd86519eff118c9aa) - is a stake pool node with active stake (stake is encoded on genesi block)
- ExtraPoolWithActiveStake --trusts--> GenesisWithActiveStake
- The connections broken and works refers only to block propagation direction status (not to solicitation/messages/gossip/...)
A visual representation of the simplified issue looks like:
Since both nodes can and will produce blocks and Genesis receives blocks from ExtraPool, but ExtraPool does NOT receive block from Genesis, the nodes (chain) fork and have a different view of the chain.
The following stats are from 2 nodes left in this situation for more then 2 hours.
- Please note that the numbers may not match exactly the provided logs and reports since 1 additional block may have been produced in between reports and shutdown, but hope the idea is still valid.
- Genesis
---
blockRecvCnt: 342
lastBlockDate: "73239.357"
lastBlockFees: 0
lastBlockHash: cb3ca2758432c23c12c1d07c7506c30567a4f6695462c00a4219b2a04b4f1aa1
lastBlockHeight: "221"
lastBlockSum: 0
lastBlockTime: "2019-10-31T21:56:54+00:00"
lastBlockTx: 0
state: Running
txRecvCnt: 0
uptime: 7307
- ExtraPool
---
blockRecvCnt: 121
lastBlockDate: "73239.328"
lastBlockFees: 0
lastBlockHash: deeb2e95269fac5a20614d765c5781ba691f3b3af11f9fc42ae540016c2ad122
lastBlockHeight: "122"
lastBlockSum: 0
lastBlockTime: "2019-10-31T21:55:56+00:00"
lastBlockTx: 0
state: Running
txRecvCnt: 0
uptime: 7252
Blocks and Producers per epoch according to:
- Genesis Node
{
  "73239": {
    "a93cf67dac50f84f2b74f3cccad1c21a2df2c364037e5dc1dd8017c1d320fc9d": 16
  },
  "73238": {
    "a93cf67dac50f84f2b74f3cccad1c21a2df2c364037e5dc1dd8017c1d320fc9d": 22
  },
  "73237": {
    "a93cf67dac50f84f2b74f3cccad1c21a2df2c364037e5dc1dd8017c1d320fc9d": 25
  },
  "73236": {
    "a93cf67dac50f84f2b74f3cccad1c21a2df2c364037e5dc1dd8017c1d320fc9d": 35
  },
  "73235": {
    "a93cf67dac50f84f2b74f3cccad1c21a2df2c364037e5dc1dd8017c1d320fc9d": 33
  },
  "73234": {
    "a93cf67dac50f84f2b74f3cccad1c21a2df2c364037e5dc1dd8017c1d320fc9d": 23
  },
  "73233": {
    "a93cf67dac50f84f2b74f3cccad1c21a2df2c364037e5dc1dd8017c1d320fc9d": 33
  },
  "73232": {
    "a93cf67dac50f84f2b74f3cccad1c21a2df2c364037e5dc1dd8017c1d320fc9d": 28
  },
  "73231": {
    "a93cf67dac50f84f2b74f3cccad1c21a2df2c364037e5dc1dd8017c1d320fc9d": 6
  }
}
- ExtraPool Node
{
  "73239": {
    "2f3471d99a42e3c75362ea3a217f190143675300ca9893edd86519eff118c9aa": 17
  },
  "73238": {
    "2f3471d99a42e3c75362ea3a217f190143675300ca9893edd86519eff118c9aa": 11
  },
  "73237": {
    "2f3471d99a42e3c75362ea3a217f190143675300ca9893edd86519eff118c9aa": 12
  },
  "73236": {
    "2f3471d99a42e3c75362ea3a217f190143675300ca9893edd86519eff118c9aa": 16
  },
  "73235": {
    "2f3471d99a42e3c75362ea3a217f190143675300ca9893edd86519eff118c9aa": 18
  },
  "73234": {
    "2f3471d99a42e3c75362ea3a217f190143675300ca9893edd86519eff118c9aa": 14
  },
  "73233": {
    "2f3471d99a42e3c75362ea3a217f190143675300ca9893edd86519eff118c9aa": 16
  },
  "73232": {
    "2f3471d99a42e3c75362ea3a217f190143675300ca9893edd86519eff118c9aa": 14
  },
  "73231": {
    "2f3471d99a42e3c75362ea3a217f190143675300ca9893edd86519eff118c9aa": 4,
    "a93cf67dac50f84f2b74f3cccad1c21a2df2c364037e5dc1dd8017c1d320fc9d": 1
  }
}
Now let`s try this with one more node. This case was was reproduced several times, but is much more harder than the first one. The network still forks.
Let's define some additional terms first.
- DynPoolWithoutActiveStake - is a stake pool node with an INACTIVE stake (stake not yet registered), hence you can treat it as a passive one (just laying ground for the next case).
- DynPoolWithoutActiveStake --trusts--> GenesisWithActiveStake
- DynPoolWithoutActiveStake --trusts--> ExtraPoolWithActiveStake
- The connections
brokenandworksrefers only to block propagation direction status (not to solicitation/messages/gossip/...)
A visual representation of this case looks like:
Another _possible_ case where the network forks more. I didn't went to reproduce/hunt this case since thought was no need to get the general idea, but still presenting it here lke a likely possible situation.
Let's define some additional terms first.
- DynPoolWithActiveStake - is a stake pool node with an ACTIVE stake.
- DynPoolWithActiveStake --trusts--> GenesisWithActiveStake
- DynPoolWithActiveStake --trusts--> ExtraPoolWithActiveStake
- The connections
brokenandworksrefers only to block propagation direction status (not to solicitation/messages/gossip/...)
A visual representation of this case looks like:
Mandatory Information
jcli 0.7.0-rc3 (master-d30f63f7, debug, linux [x86_64]) - [rustc 1.38.0 (625451e37 2019-09-23)]jormungandr 0.7.0-rc3 (master-d30f63f7, debug, linux [x86_64]) - [rustc 1.38.0 (625451e37 2019-09-23)]
To Reproduce
Steps to reproduce the behavior:
- Start Genesis Node and let it produce at least a block
- Check Genesis Leader Logs and get the next leadership event
- Start ExtraPool a few seconds before (2 - Genesis next leadership event). This may require some attempts since there is a specific flow needed to happen that causes the issue and the easiest way is when both nodes produce a block one after the other so there are solicit/pull requests. The attached logs will show better the flow...
blocks_produced_view.txt
genesis_stdout.log
extrapool_stdout.log
Expected behavior
This not to happen, or at least to be detected and recovered (keeping the same structure in place, since there are cases when the chain (not the problematic connection) can recover when new connections are made...)
Additional context
I posted here some cases that have negative effects on the chain, leaving out the cases where even if a connection between 2 (or more) nodes is broken, the network may recover (discarding one+ fork) when a third,fourth,.. node connects fine to both+ problematic nodes and can serve as a proxy since it forwards fine all the blocks from each node...There is more to it, but I think this got long enough and feeling a bit overwhelmed...
I have no proof if this is happening on the public testnet or not, but it may be one of the causes.
 rinor
rinor
All 11 comments
Excellent one @rinor !!
 rdlrt
on 1 Nov 2019
rdlrt
on 1 Nov 2019
@rinor Holmes!
 gufmar
on 1 Nov 2019
gufmar
on 1 Nov 2019
Just guessing, but might worth a try: my theory
This is not limited to the genesis pool, but any pool with a significant stake (=block producing rate) paired with an outgoing traffic shaping.
The traffic shaper drops single tcp packets, which causes special and noticeable effects inside a http2/grpc session.
gufmar
on 1 Nov 2019
@rinor we did a test in a private testnet yesterday evening.
This globally distributed testnet run fine and perfectly synchronised for many days, even with TX load tests.
We moved 70% of stake to one single node and enabled a traffic shaping. (causing packet drops and so a bit of confusion inside the http2/grpc channels.
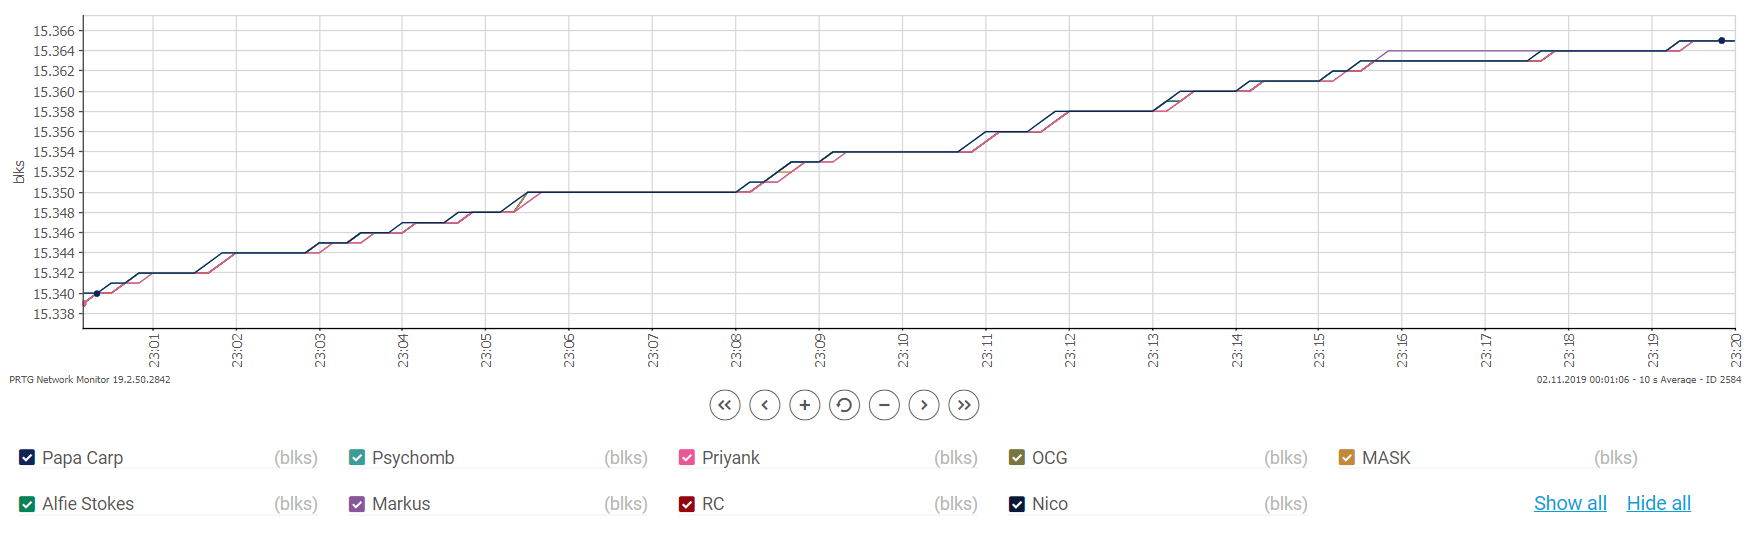
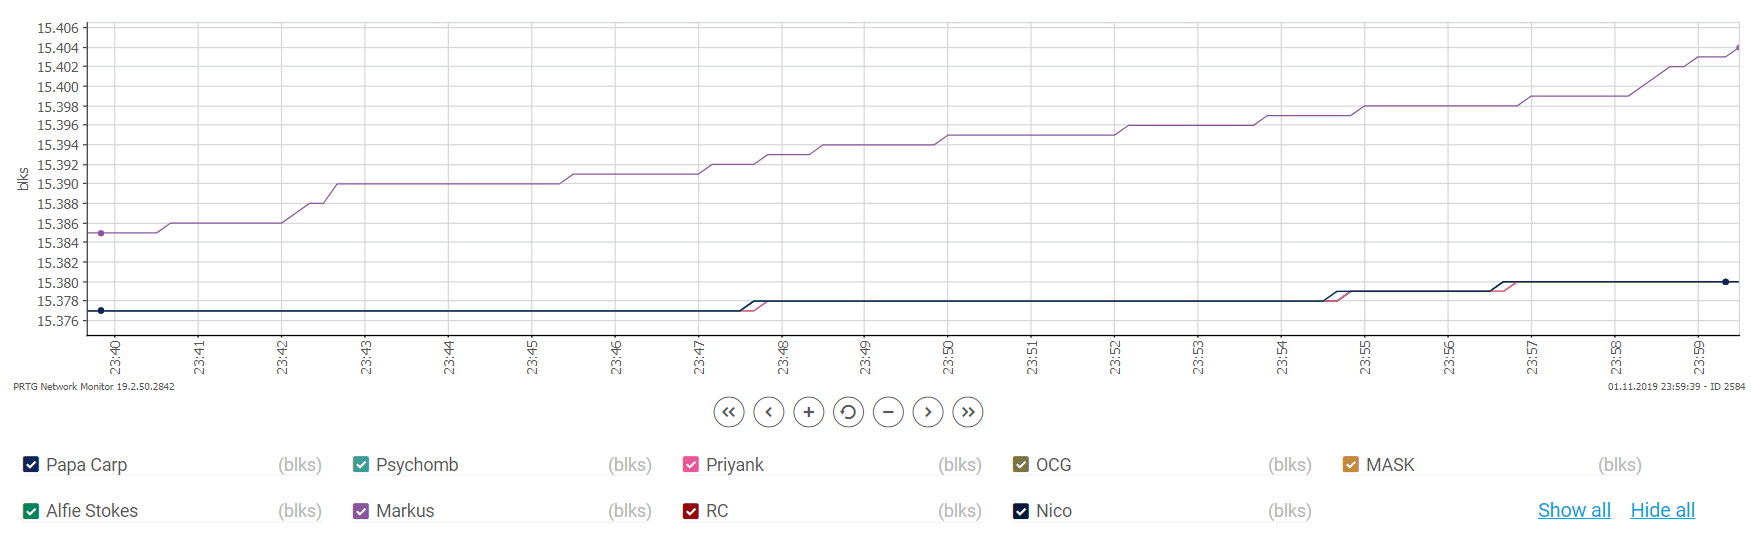
We were able to produce a fork, rollbacks and then even a complete separation of the network, and was able to record this in some screenshots and monitoring graphs, recording all participating nodes block progress.
Block synchronicity for all participating nodes before traffic shaping
Traffic shaping steps
1) slight shape (256kbits per IP)
2) more shape (80 kbits per IP)
3) serious shape (32 kbits per IP)
4) remove shaping
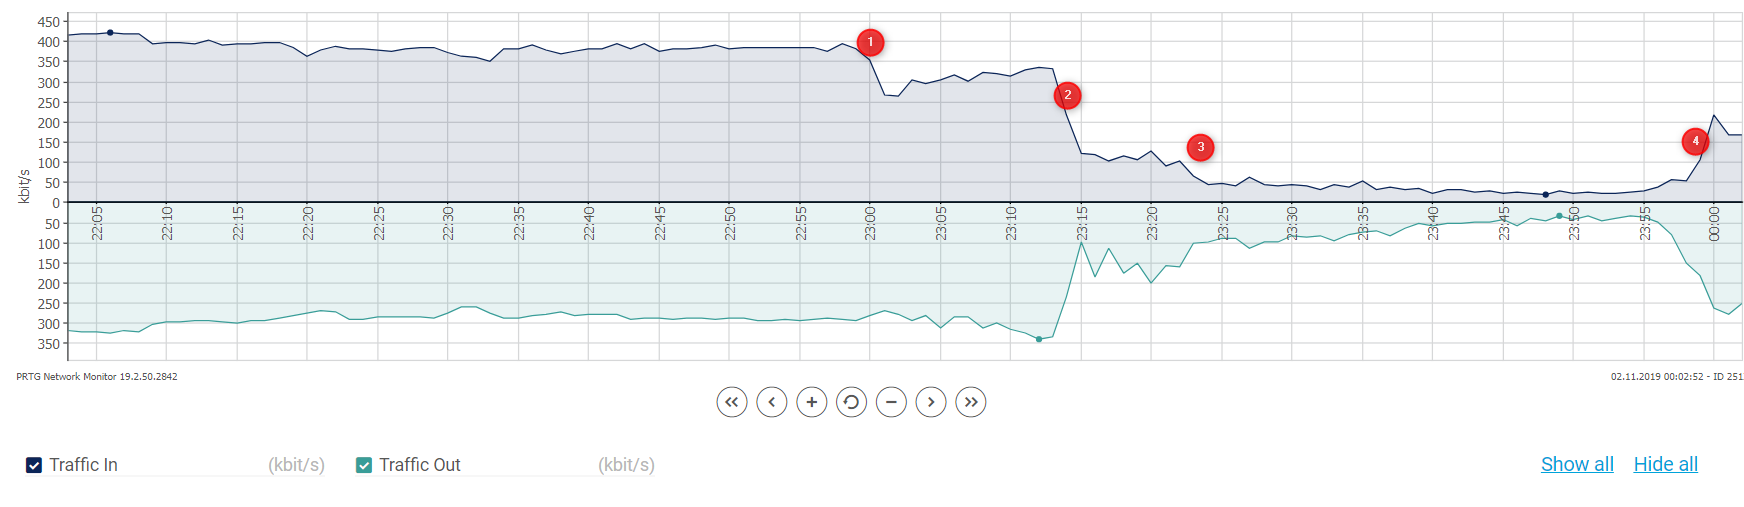
After step3 shaping, the block synchronicity went chaotic
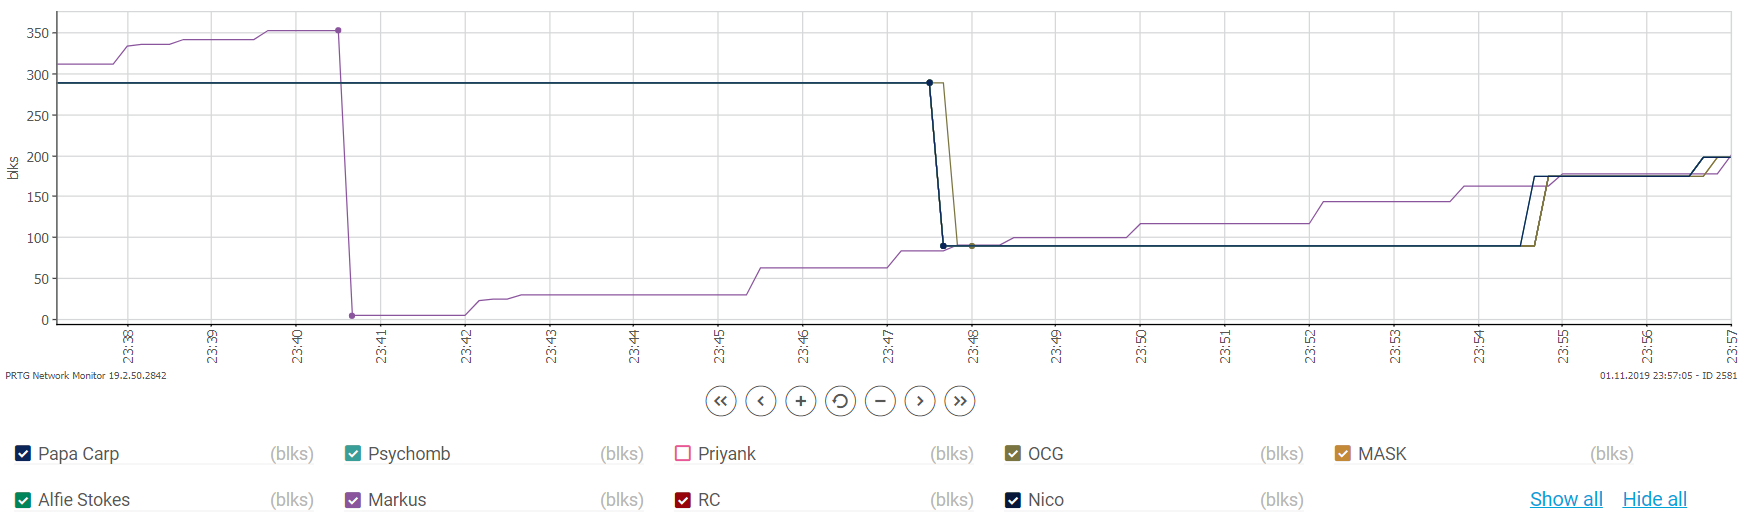
There were rollbacks
and then a complete separation
gufmar
on 2 Nov 2019
I think I reproduced the same using 2 local nodes. Adding the logs and configs in here in case they will help the investigation.
Scenario: 2 nodes running on the same win10 virtual machine - v0.7.0-rc4
- node 1 is acting as faucet and stake pool
- node 2 is acting as stake pool
- initially, node2 had a low stake and increased it at a later point
- after ~3 hours of running, at 20:31:10.073 node1 starts to display
WARN error while streaming response: Error { code: Internal, cause: CannotIterate } - at exact same moment node 2 starts to display -
Nov 02 20:31:10.073 INFO PullBlocksToTip response stream failed: Error { code: Internal, source: Status { code: Internal, message: "internal processing error" } }, node_id: 155e591d631ebf6fa8625442f194039809b4ac5b23534e16, peer_addr: 127.0.0.1:3001, task: network - from this moment node 2 does not create blocks anymore and the block creation rate decreases significantly on node 1
node 1 config and logs
node1_faucet_logs.txt
node1_configs.zipnode 2 config and logs
node2_stake_pool_logs.txt
node2_configs.zip
Node 1 network stats:
---
- establishedAt: "2019-11-02T17:37:47.061895200+00:00"
  lastBlockReceived: "2019-11-03T03:03:50.041904400+00:00"
  lastFragmentReceived: "2019-11-02T18:34:09.831087900+00:00"
  lastGossipReceived: "2019-11-03T03:03:57.104464900+00:00"
  nodeId: 27c370a12400e14ef51bacd6f7007290cbe58105071355ec
----------------------------------------------------------
Node 2 network stats:
---
- establishedAt: "2019-11-02T17:37:47.061895200+00:00"
  lastBlockReceived: "2019-11-03T03:03:58.057634700+00:00"
  lastFragmentReceived: "2019-11-02T18:34:09.831087900+00:00"
  lastGossipReceived: "2019-11-03T03:04:00.057679900+00:00"
  nodeId: 155e591d631ebf6fa8625442f194039809b4ac5b23534e16
Jormungandr Stake and Block Distribution Cross Reference:

Epoch:               243
Dangling:            0.000000 ADA
Unassigned:          0.000000 ADA
TotalADA:            49,999,999.983450 ADA
TotalBlocks:         10
TotalStaked:         49,999,999.983450 ADA
TotalPercentStaked:  100.00%

+------------------------------------------------------------------+-----------------+--------------+---------------------+---------------------+
| EPOCH 243, Pool (Node ID)                                        |     Stake (ADA) |   Blocks (#) |   PercentStaked (%) |   PercentBlocks (%) |
|------------------------------------------------------------------+-----------------+--------------+---------------------+---------------------|
| 223fe74ad117c5a012d4e08eb585803787766f784a3b5addbe0d753d39ab0966 | 15524999.988950 |              |               31.05 |                     |
| d69bee7f366820572924e949d90303fcaa111b4a099ade31c72b0dcefccffdc6 | 34474999.994500 |           10 |               68.95 |                 100 |
+------------------------------------------------------------------+-----------------+--------------+---------------------+---------------------+
Node 1 stats:
---
blockRecvCnt: 1808
lastBlockDate: "244.35"
lastBlockFees: 0
lastBlockHash: 319535779dc349adbbf0b4984f8662951c00cacb22aeeb2455908cca4a84d146
lastBlockHeight: "1447"
lastBlockSum: 0
lastBlockTime: "2019-11-03T03:08:02+00:00"
lastBlockTx: 0
state: Running
txRecvCnt: 4
uptime: 34231
----------------------------------------------------------
Node 2 stats:
---
blockRecvCnt: 987
lastBlockDate: "244.41"
lastBlockFees: 0
lastBlockHash: 726118f0b9511d4c227854e56b9ac069de4c1eb47440bc6eea9e541177cbbf4c
lastBlockHeight: "985"
lastBlockSum: 0
lastBlockTime: "2019-11-03T03:08:02+00:00"
lastBlockTx: 0
state: Running
txRecvCnt: 7
uptime: 35044
 dorin100
on 3 Nov 2019
dorin100
on 3 Nov 2019
- even a faster way to reproduce this here - https://github.com/input-output-hk/jormungandr/issues/1065
PS: with the same config, sometimes the faucet node is crashing, other times it generates the warning from the above comment.
dorin100
on 3 Nov 2019
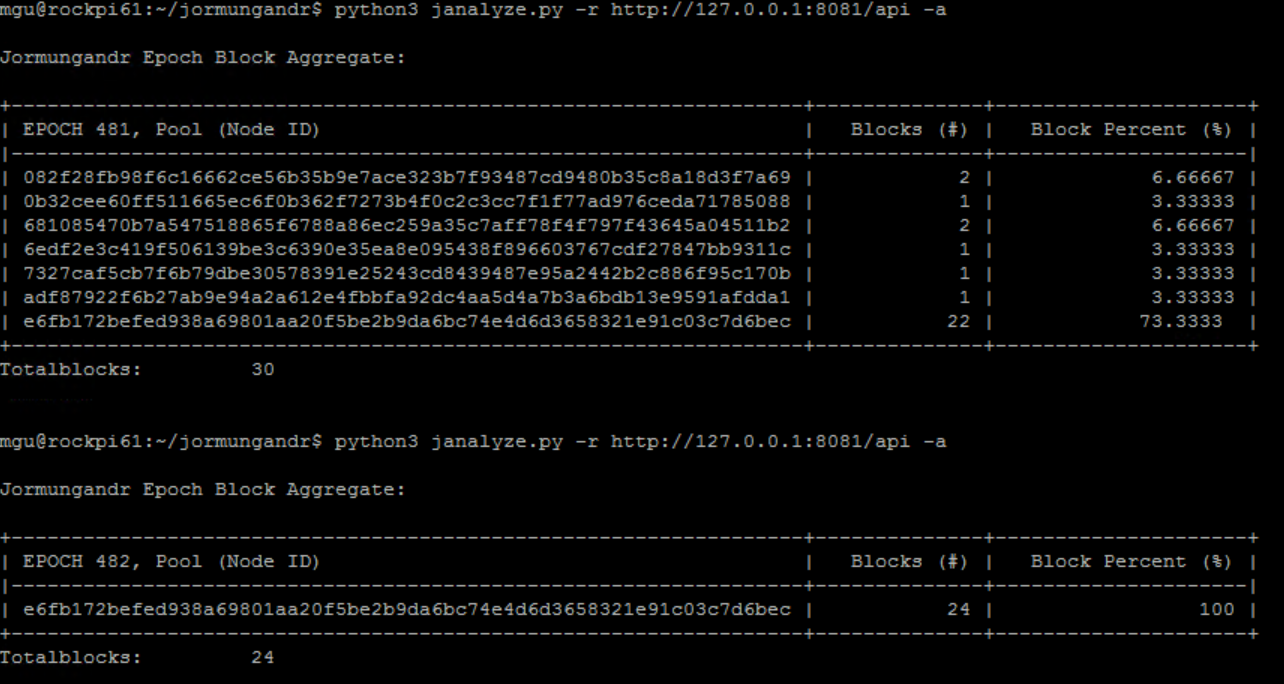
Follow up. Just tested master again today, after https://github.com/input-output-hk/jormungandr/pull/1078 was merged. Different log messages, but issue still there.
genesis_stdout_20191106.log
extrapool_stdout_20191106.log
Update: on a side note @mzabaluev is it possible (if not much hassle) to add INFO received block announcement ... also on server side, since right now is available only on client side. I can open a JIP if feasible.
rinor
on 6 Nov 2019
on a side note @mzabaluev is it possible (if not much hassle) to add
INFO received block announcement ...also on server side, since right now is available only on client side. I can open a JIP if feasible.
Thanks for the suggestion @rinor, I've addressed it as part of #1092.
 mzabaluev
on 8 Nov 2019
mzabaluev
on 8 Nov 2019
Repro'd the CannotIterate error on a local three-node setup with fresh storage and full logs, will investigate.
mzabaluev
on 8 Nov 2019
Repro'd the
CannotIterateerror on a local three-node setup with fresh storage and full logs, will investigate.
Is it possible that this is related/caused by the forks? Just hinting since there is a pattern when there are multiple slot leaders... just an idea though since have to get back to the logs to reinforce this...
rinor
on 8 Nov 2019
Is it possible that this is related/caused by the forks?
Yes indeed. The code that resolves a header pull request in storage considers all checkpoints for which blocks are present locally, but it should only take those that are ancestors of the requested end block.
mzabaluev
on 8 Nov 2019
Related issues
 tstdin
·
28Comments
tstdin
·
28Comments
 skokasik
·
36Comments
skokasik
·
36Comments
 hemants1
·
14Comments
hemants1
·
14Comments
 bjarnekvae
·
12Comments
dorin100
·
28Comments
bjarnekvae
·
12Comments
dorin100
·
28Comments
Most helpful comment
Follow up. Just tested
masteragain today, after https://github.com/input-output-hk/jormungandr/pull/1078 was merged. Different log messages, but issue still there.genesis_stdout_20191106.log
extrapool_stdout_20191106.log
Update: on a side note @mzabaluev is it possible (if not much hassle) to add
INFO received block announcement ...also on server side, since right now is available only on client side. I can open a JIP if feasible.