Holoviews: Heatmap with multiple legends
Heatmap with multiple legends
Problem:
I have multiple metrics which I need to show in a heatmap. For some of them, the greater value is good and for others smaller value is good.
I want to create heatmap where each value of x-axis can have a different legend or color_levels.
Currently when I create multiple heatmaps for each value of x-axis and then merge them using * which is merge the legends as well and the purpose of colouring doesn't make any sense.
For example:
The higher speed is Good.
Low delay is Good,
In the same heatmap how to show both with reverse the colouring levels.
 ziakayani
All 12 comments
It's hard for me to see what you're after here. Maybe you could illustrate what you mean by creating the various separate heatmaps you need and then using a graphics program to paste them together how you would like them to appear?
 jbednar
on 27 Jan 2020
jbednar
on 27 Jan 2020
It's hard for me to see what you're after here. Maybe you could illustrate what you mean by creating the various separate heatmaps you need and then using a graphics program to paste them together how you would like them to appear?
Thanks for your response. Imagine every value on the x-axis will have a different min-max range and colour cmap. Like the following map.
ziakayani
on 3 Feb 2020
Got it. Yes, that does seem like something that would be useful. It might be possible to approximate this with the right settings on a GridSpace or NdLayout of separate HeatMaps, but it would take some fiddling.
jbednar
on 3 Feb 2020
Got it. Yes, that does seem like something that would be useful. It might be possible to approximate this with the right settings on a GridSpace or NdLayout of separate HeatMaps, but it would take some fiddling.
Hi Jbednar,
I have tried both, using different examples but not able to draw that. Can you please help with the initial skeleton? For example:
import pandas as pd
df = pd.DataFrame(
{'A':[1,2,3,4,5],
'B':[0.8,0.85,0.5,0.7,0.2],
'C':['a','b','c','d','e']
}
)
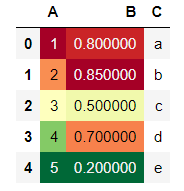
Also how to display multiple legends?
ziakayani
on 8 Apr 2020
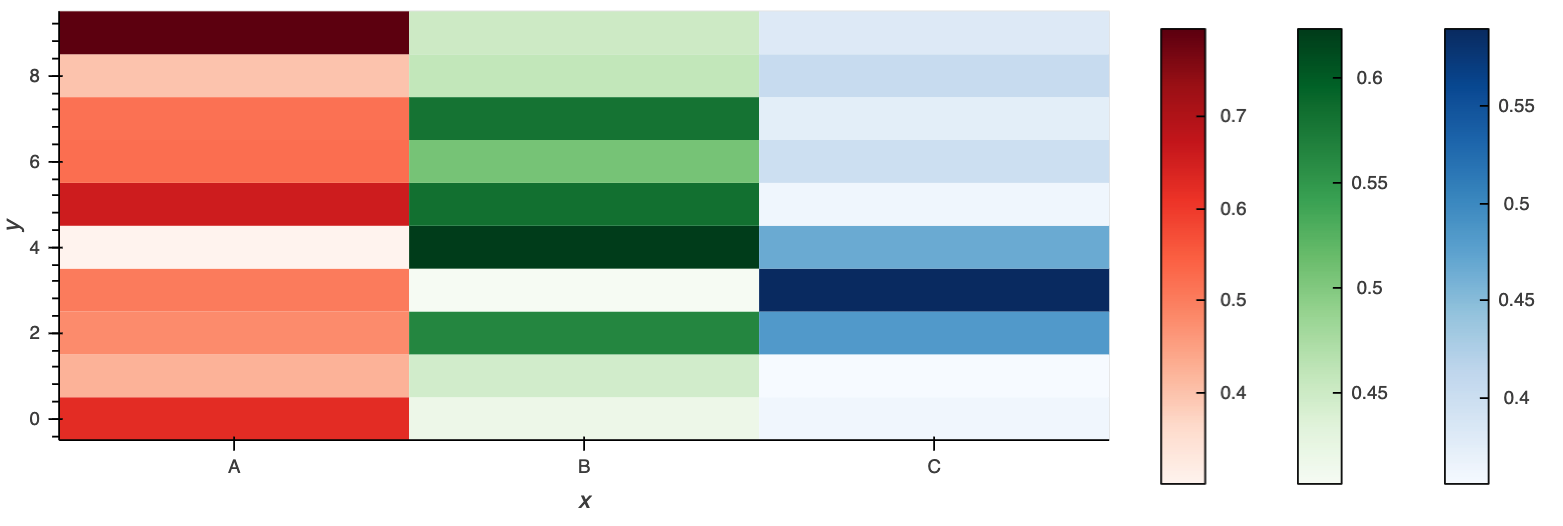
Bit hacky but it is possible already:
hm1 = hv.HeatMap(('A', np.random.randint(0, 10, 100), np.random.rand(100)), vdims='Vals0').aggregate(function=np.mean).opts(
    cmap="Reds"
)
hm2 = hv.HeatMap(('B', np.random.randint(0, 10, 100), np.random.rand(100)), vdims='Vals1').aggregate(function=np.mean).opts(
    cmap="Greens"
)
hm3 = hv.HeatMap(('C', np.random.randint(0, 10, 100), np.random.rand(100)), vdims='Vals2').aggregate(function=np.mean).opts(
    cmap="Blues"
)

legend = (hm1 + hm2 + hm3).opts(
    hv.opts.HeatMap(frame_width=0, colorbar=True, xaxis=None, yaxis=None, show_frame=False),
    clone=True
)

((hm1 * hm2 * hm3).opts(frame_width=600, padding=0) + legend)
 philippjfr
on 8 Apr 2020
philippjfr
on 8 Apr 2020
Bit hacky but it is possible already:
hm1 = hv.HeatMap(('A', np.random.randint(0, 10, 100), np.random.rand(100)), vdims='Vals0').aggregate(function=np.mean).opts(
    cmap="Reds"
)
hm2 = hv.HeatMap(('B', np.random.randint(0, 10, 100), np.random.rand(100)), vdims='Vals1').aggregate(function=np.mean).opts(
    cmap="Greens"
)
hm3 = hv.HeatMap(('C', np.random.randint(0, 10, 100), np.random.rand(100)), vdims='Vals2').aggregate(function=np.mean).opts(
    cmap="Blues"
)

legend = (hm1 + hm2 + hm3).opts(
    hv.opts.HeatMap(frame_width=0, colorbar=True, xaxis=None, yaxis=None, show_frame=False),
    clone=True
)

((hm1 * hm2 * hm3).opts(frame_width=600, padding=0) + legend)
@philippjfr Thanks for the example, it did work for me regarding the cmap, but color_levels are still not working, i.e. different color_levels for the different column,
for example: one column has values 0 to 100, 2nd column has values 1000 to 5000, I want to color them separately, but currently, on joining two heatmaps (hm1 * hm2) it adjusts the range as well and not getting the expected coloring.
ziakayani
on 22 Apr 2020
@philippjfr
For example, on right all are greens and on left all are reds, due to larger values of central columns
ziakayani
on 22 Apr 2020
Did you give each HeatMap a different vdim name?
philippjfr
on 22 Apr 2020
Did you give each HeatMap a different vdim name?
Thanks for the quick response, Yes that was the reason, just tried different names and it worked.
Really Appreciated.
ziakayani
on 22 Apr 2020
Hopefully we can implement multiple colorbars without this workaround soon.
philippjfr
on 22 Apr 2020
@philippjfr Sorry, but now I'm stuck in another issue.
I have to display this map with a dropdown (e.g different heatmap for the different weekdays) with HoloMaps.
I'm giving each column a different VDIM, as you mentioned so it is working fine for a single heatmap.
But as similar columns are repeated in all heatmaps so color_levels are again calculated using all the values of a particular column in all the heatmaps.
I want Holoviews to use different color_levels for a heatmap of a different day.
For this, I append a unique id with VDIM, which is unique for each heatmap. But now the plot is behaving awkwardly, (labels vanish for a column, no hover, missing data etc.)
How it will be possible that Holoviews doesn't aggregate heatmaps when adding all of them to Holomaps.
ziakayani
on 29 May 2020
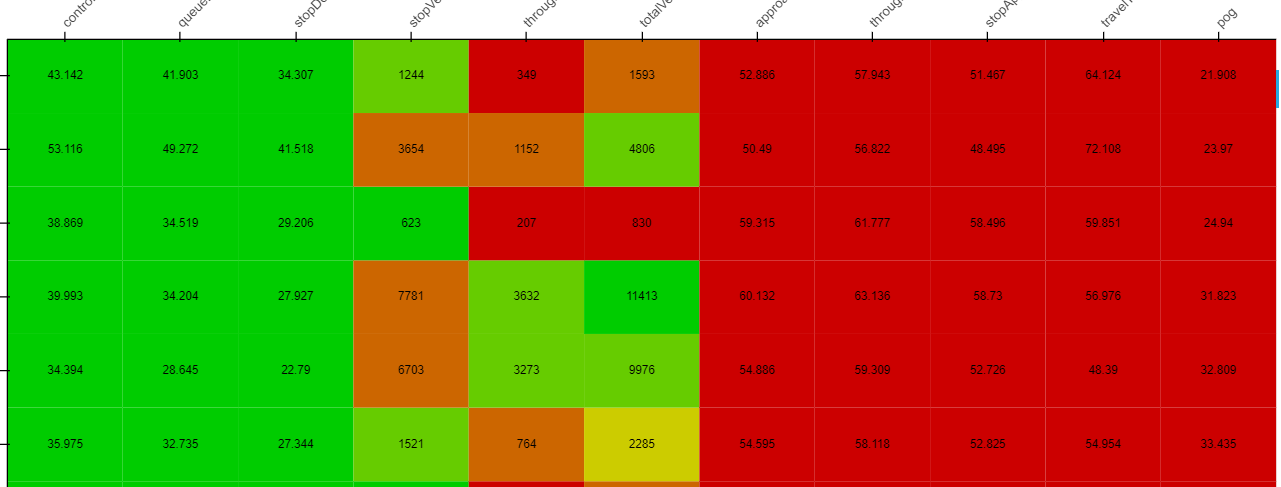
@philippjfr @jbednar I debug the issue, this is a bug, attaching the screenshot along with code snippets.
When there are two values in the select widget. It works fine
import pandas as pd
import holoviews as hv
from holoviews import opts
hv.extension('bokeh')

path = "E:\\testing\\plots\\"

df1 = pd.read_csv(path + '1.csv')
df2 = pd.read_csv(path + '2.csv')
df3 = pd.read_csv(path + '3.csv')
df4 = pd.read_csv(path + '4.csv')

print(df1)

heatmap1 = hv.HeatMap(df1, kdims=['Metric', 'Intersection'], vimds=['pog1'])
heatmap2 = hv.HeatMap(df2, kdims=['Metric', 'Intersection'], vimds=['pog2'])
heatmap4 = hv.HeatMap(df4, kdims=['Metric', 'Intersection'], vimds=['controlDelay1'])
heatmap5 = hv.HeatMap(df5, kdims=['Metric', 'Intersection'], vimds=['controlDelay2'])

heatmap1.opts(tools=['hover'], height=500, width=900, toolbar='right', cmap="reds", ylabel='Intersection', xlabel='Metric')
heatmap2.opts(tools=['hover'], height=500, width=900, toolbar='right', cmap="oranges",  ylabel='Intersection', xlabel='Metric')

heatmap4.opts(tools=['hover'], height=500, width=900, toolbar='right', cmap="greens_r",  ylabel='Intersection', xlabel='Metric')
heatmap5.opts(tools=['hover'], height=500, width=900, toolbar='right', cmap="greens_r",  ylabel='Intersection', xlabel='Metric')

outputFolder = "C:\\Users\\Zia\\Desktop\\"

holo = hv.HoloMap({"Mon": (heatmap1 * hv.Labels(heatmap1)) * (heatmap4 * hv.Labels(heatmap4)),
                   "Tues":  (heatmap2 * hv.Labels(heatmap2)) * (heatmap5 * hv.Labels(heatmap5))
                   }, kdims=["Day of Week"])

hv.save(holo, outputFolder + 'test.html')
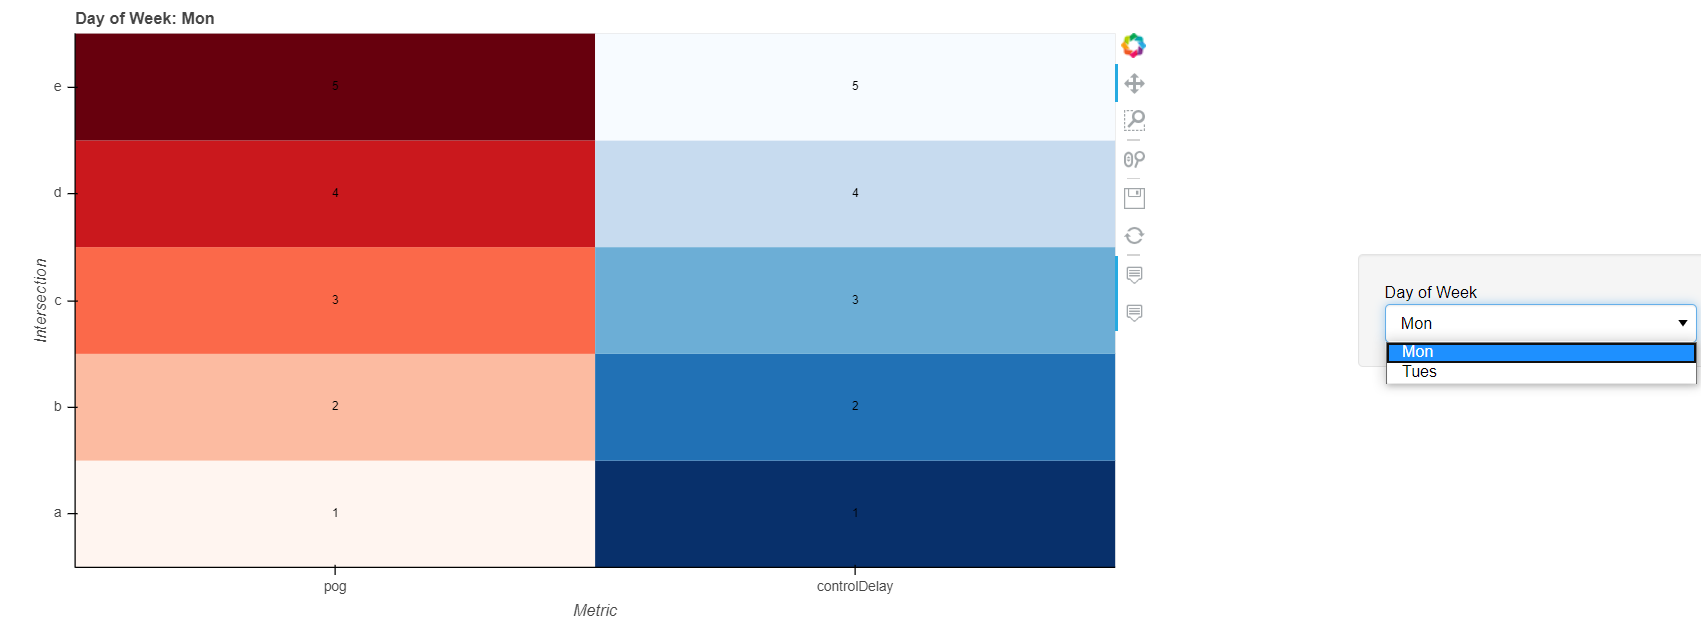
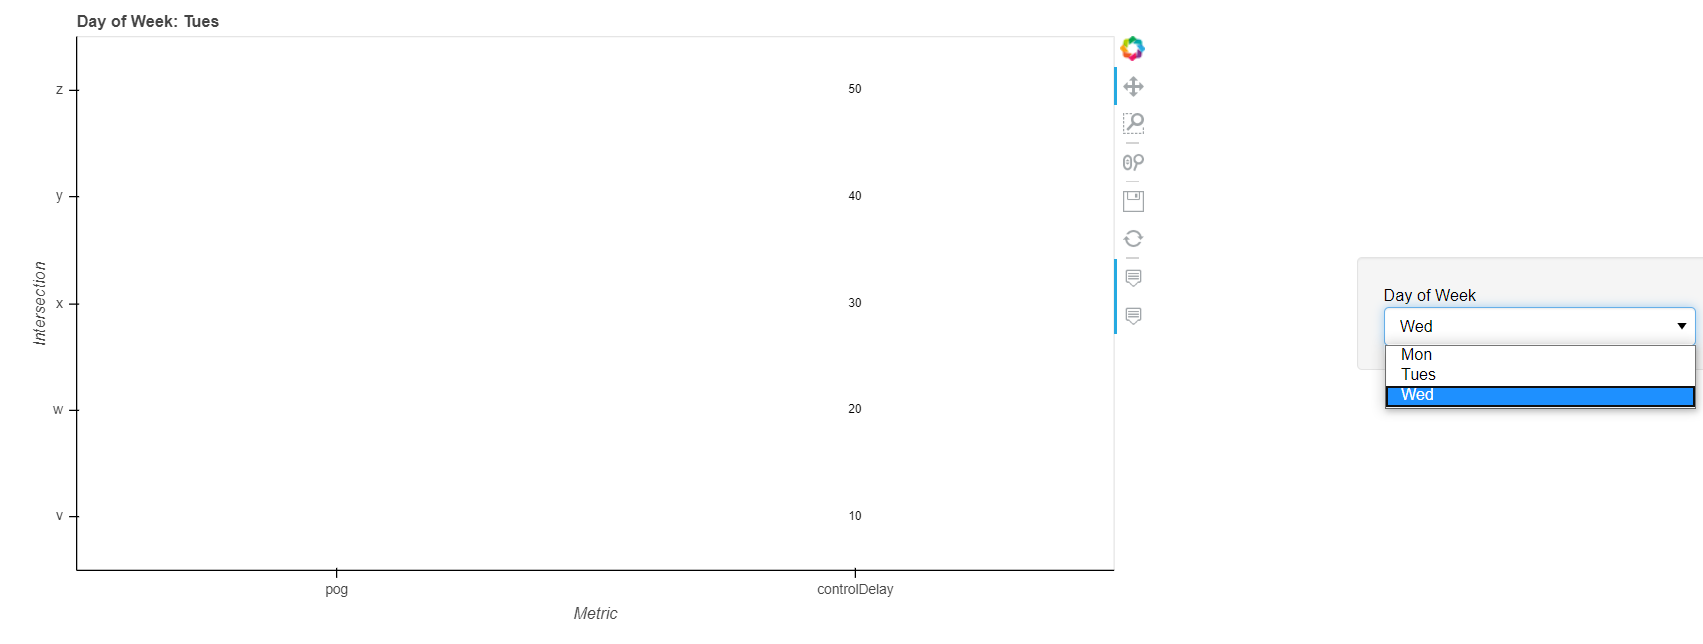
This worked fine, As mentioned earlier, there are two values in select (Mon, Tue), if we add third day (Wed) then labels got vanished and no hover, etc. e.g.
holo = hv.HoloMap({"Mon": (heatmap1 * hv.Labels(heatmap1)) * (heatmap4 * hv.Labels(heatmap4)),
                   "Tues":  (heatmap2 * hv.Labels(heatmap2)) * (heatmap5 * hv.Labels(heatmap5)),
                   "Tues":  (heatmap3 * hv.Labels(heatmap3)) * (heatmap6 * hv.Labels(heatmap6))
                   }, kdims=["Day of Week"])
Sample data:
Intersection,Metric,pog1
a,pog,1
b,pog,2
c,pog,3
d,pog,4
e,pog,5
Plot for two days:
Awkward behavior, No labels and cmap for random days, if the third day added.
ziakayani
on 5 Jun 2020
Related issues
 jlstevens
·
6Comments
jlstevens
·
6Comments
 claresloggett
·
5Comments
claresloggett
·
5Comments
 rabernat
·
4Comments
rabernat
·
4Comments
 lrdsouza
·
3Comments
lrdsouza
·
3Comments
 asmith26
·
4Comments
asmith26
·
4Comments
Most helpful comment
Bit hacky but it is possible already: