Holoviews: Create single legend outside plots rather than duplicate legends inside
When creating a plot with .overlay().layout(), I get a legend inside the plotting area of each plot. Since the variables are the same across the layout, all the legends are identical. I'd like to be able to get a single legend outside the plots, rather than multiple legends all inside the plots.
Even when not using .layout(), I'd like to be able to move the .overlay() legend outside the plotting area as in some cases the legend is large.
This is using the bokeh backend, where I believe it's currently not possible to get a legend outside the plots. I'm not sure if the situation is any different with the matplotlib backend.
 claresloggett
All 5 comments
Thanks for filing this, I've been meaning to address this at some point so it's good to have an issue for it.
This is using the bokeh backend, where I believe it's currently not possible to get a legend outside the plots
That's not accurate legend_position='right'/'left'/'top'/'bottom' allows placing the legend outside the plot area, the same options also work in matplotlib.
 philippjfr
on 7 Aug 2017
philippjfr
on 7 Aug 2017
I have a couple of questions about the NdOverlay.
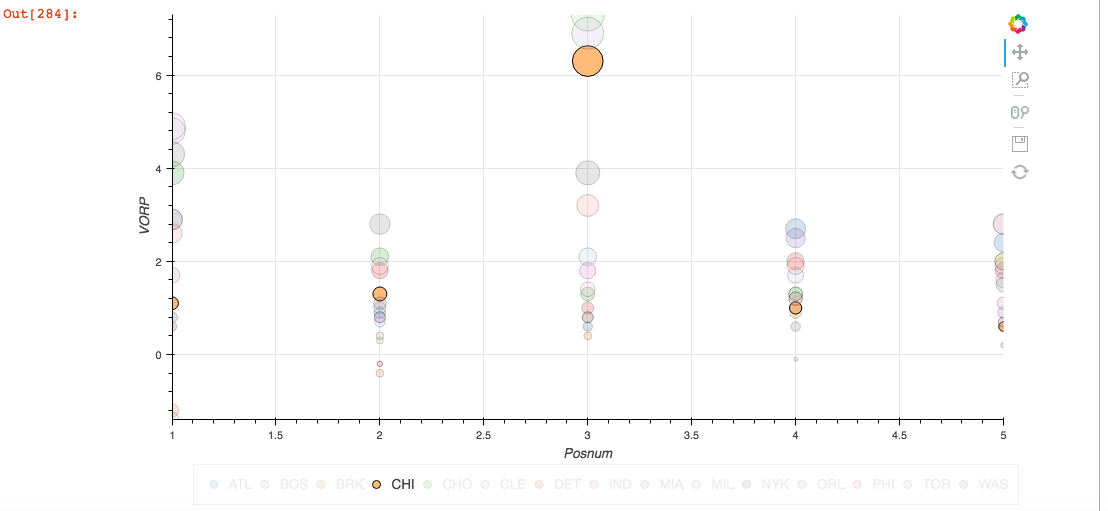
1) _Is there a limit to how many items the legend will show?_ I have a file with 30 values within the legend and haven't been able to have the legend appear. (I have included a version below that has 15 different 'Tm' values and it works. However, once I try and running this with a file that has 30 values for 'Tm' no legend seems to appear) (One hypothesis I had was that maybe it has to do with amount of value_dimensions)
2) _Is there a way to set the default to not have all values selected?_ Is their a way to have none selected as a default or I program which want to start with.
I am running this in Jupyter using Python 3.
import csv
import numpy as np
import pandas as pd
import holoviews as hv
hv.extension('bokeh')

macro_df = pd.read_csv('filename_with_15_different_Tm.csv', header=0)

key_dimensions   = [('Posnum', 'Posnum'), ('Tm', 'Tm')]
value_dimensions = [('Player','Player'),('Pos','Pos'),('Posnum','Posnum'),('Age','Age'),('Tm','Tm'),('G','G'),('MP','MP'),('PER','PER'),('TS%','TS%'),('3PAr','3PAr'),('FTr','FTr'),('ORB%','ORB%'),('DRB%','DRB%'),('TRB%','TRB%'),('AST%','AST%'),('STL%','STL%'),('BLK%','BLK%'),('TOV%','TOV%'),('USG%','USG%'),('OWS','OWS'),('DWS','DWS'),('WS','WS'), ('WS/48','WS/48'), ('OBPM','OBPM'),('DBPM','DBPM'),('BPM','BPM'),('VORP','VORP')
]
macro = hv.Table(macro_df, kdims=key_dimensions, vdims=value_dimensions)

%%opts Scatter [width=900 height=600 scaling_method='width' scaling_factor=5 size_index=1 show_grid=True]
%%opts Scatter (color=Cycle('Category20') line_color='k')
%%opts NdOverlay [legend_position='bottom' show_frame=False legend_cols=5]
gdp_unem_scatter = macro.to.scatter('Posnum', ['VORP', 'MP'])
gdp_unem_scatter.overlay('Tm')
 RichardJamesLopez
on 13 Aug 2017
RichardJamesLopez
on 13 Aug 2017
@philippjfr, is it possible to use Bokeh's legend_position functionality in a Holoviews plot?
 wmayner
on 28 Mar 2019
wmayner
on 28 Mar 2019
I am interested in creating layout with a shared legend! I think the bokeh layout refactor may have made that easier?
 DancingQuanta
on 23 Aug 2019
DancingQuanta
on 23 Aug 2019
Just curious if there is any update on this issue?
 NumesSanguis
on 14 Feb 2020
NumesSanguis
on 14 Feb 2020
Related issues
 rjp23
·
4Comments
rjp23
·
4Comments
 hojo0590
·
4Comments
hojo0590
·
4Comments
 jlstevens
·
6Comments
jlstevens
·
6Comments
 rabernat
·
4Comments
rabernat
·
6Comments
rabernat
·
4Comments
rabernat
·
6Comments
Most helpful comment
I am interested in creating layout with a shared legend! I think the bokeh layout refactor may have made that easier?