Grafana-zabbix: Problems: panel fails with error (cannot read property 'description' of undefined)
Describe the bug
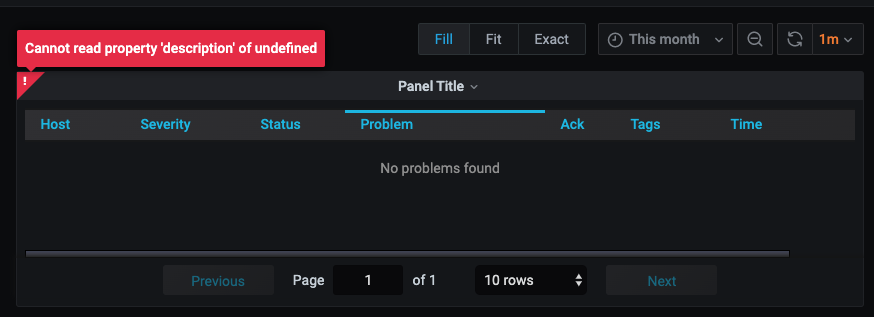
When show many problem in painel Zabbix Problem:
Error: Cannot read property 'description' of undefined
Software versions
| Grafana | Zabbix | Grafana-Zabbix Plugin |
| 7.0 | 4. 4.5 |3.12.0 |
 cloudlgti
All 16 comments
+1
 duuz
on 21 May 2020
duuz
on 21 May 2020
+1
 DanilaZaytsev
on 22 May 2020
DanilaZaytsev
on 22 May 2020
+1
 JSylvia007
on 22 May 2020
JSylvia007
on 22 May 2020
+1
 Andorash
on 22 May 2020
Andorash
on 22 May 2020
Could someone show the query? Can't replicate it on my instance.
 alexanderzobnin
on 22 May 2020
alexanderzobnin
on 22 May 2020
JSON - PANEL DATA
{
  "state": "Error",
  "series": [],
  "request": {
    "app": "dashboard",
    "requestId": "Q120",
    "timezone": "browser",
    "panelId": 23763571993,
    "dashboardId": 13,
    "range": {
      "from": "2020-05-15T08:49:31.709Z",
      "to": "2020-05-22T08:49:31.709Z",
      "raw": {
        "from": "now-7d",
        "to": "now"
      }
    },
    "timeInfo": "",
    "interval": "5m",
    "intervalMs": 300000,
    "targets": [
      {
        "application": {
          "filter": ""
        },
        "group": {
          "filter": "Zabbix servers"
        },
        "host": {
          "filter": "/.*/"
        },
        "proxy": {
          "filter": ""
        },
        "refId": "A",
        "tags": {
          "filter": ""
        },
        "trigger": {
          "filter": ""
        },
        "queryType": 5,
        "showProblems": "problems",
        "options": {
          "hostsInMaintenance": true,
          "sortProblems": "default",
          "minSeverity": 0,
          "acknowledged": 2,
          "limit": 1001,
          "showDisabledItems": false,
          "skipEmptyValues": false,
          "hostProxy": false
        },
        "resultFormat": "time_series",
        "item": {
          "filter": ""
        },
        "functions": [],
        "triggers": {
          "count": true,
          "minSeverity": 3,
          "acknowledged": 2
        },
        "table": {
          "skipEmptyValues": false
        },
        "datasource": "Zabbix Server"
      }
    ],
    "maxDataPoints": 1870,
    "scopedVars": {
      "__interval": {
        "text": "5m",
        "value": "5m"
      },
      "__interval_ms": {
        "text": "300000",
        "value": 300000
      },
      "__range_ms": {
        "text": 604800000,
        "value": 604800000
      },
      "__range_s": {
        "text": 604800,
        "value": 604800
      },
      "__range": {
        "text": "7d",
        "value": "7d"
      },
      "__range_series": {
        "text": "range_series",
        "value": "range_series"
      }
    },
    "startTime": 1590137371710,
    "rangeRaw": {
      "from": "now-7d",
      "to": "now"
    }
  },
  "timeRange": {
    "from": "2020-05-15T08:49:31.709Z",
    "to": "2020-05-22T08:49:31.709Z",
    "raw": {
      "from": "now-7d",
      "to": "now"
    }
  },
  "error": {},
  "timings": {
    "dataProcessingTime": 0.0700000086799264
  }
}
Error
Cannot read property 'description' of undefined
Query
Refresh loads but nothing happens
Software versions
| Grafana | Zabbix | Grafana-Zabbix Plugin |
| 7.0 | 4. 4.7 |3.12.0 |
duuz
on 22 May 2020
@duuz Could you post a response from the query inspector?
alexanderzobnin
on 22 May 2020
This error caused by missing trigger with objectid obtained from the problem.get. That's strange, I'm trying to imagine a situation where it can happen. Plugin fetches problems, then get trigger ids from the response, and get triggers with that ids. And if trigger is not exist, this error happens. But what's a reason?
alexanderzobnin
on 22 May 2020
@duuz that's a wrong response (for trend.get).
alexanderzobnin
on 22 May 2020
+1
Query mode: Problems
Show: 'History' is worked only resolved
Show: 'Problems' or 'Recents Problems' returns 'Cannot read property 'description' of undefined'
 forum77alive
on 22 May 2020
forum77alive
on 22 May 2020
Ok, I've managed to reproduce this. Bug happens when you have a problem linked to the not monitored trigger (with disabled item, for instance).
alexanderzobnin
on 25 May 2020
Fixed in 13b0a2db787d763c53ace8876d7aca7ee9bae5bc
alexanderzobnin
on 25 May 2020
Grafana v7.0.0 (aee1438ff2)
Zabbix Plugin Config Version 3.12.1
zabbix Zabbix 4.4.8
error goes, but active problem's not showed. may be it's for another ticket. we roll back to 3.11 at the moment, with 3.11 plugin active problems an panel showed.
 dbigunyak
on 26 May 2020
dbigunyak
on 26 May 2020
I can confirm that the update fixed my issue.
Grafana v7.0.0 (aee1438ff2)
Zabbix Plugin Version 3.12.1
Zabbix Server 4.4.8
Ubunti 18.04.4
JSylvia007
on 26 May 2020
My issue (cannot read property 'description' of undefined) fixed too, but now i get "Cannot read property 'length' of undefined" on one of the zabbix-servers
forum77alive
on 26 May 2020
I've updated from 3.12.0 and the issue persisted until I cleared all the cookies related in my browser to the domain where Grafana was running.
 sirovstrukelj
on 14 Jul 2020
sirovstrukelj
on 14 Jul 2020
Related issues
 KevinInphos
·
4Comments
KevinInphos
·
4Comments
 xiaoxue999
·
3Comments
xiaoxue999
·
3Comments
 maxlehot1234
·
5Comments
maxlehot1234
·
5Comments
 felipemvieira
·
6Comments
felipemvieira
·
6Comments
 divanikus
·
7Comments
divanikus
·
7Comments
Most helpful comment
Fixed in 13b0a2db787d763c53ace8876d7aca7ee9bae5bc