Grafana-zabbix: Grafana Table Panel -> Zabbix Triggers not working
I'm submitting a ...
- [X ] Bug report
- [ ] Feature requestdd
- [ ] Question / Support request
_If you don't send bug report, remove sections below_
For bug report please include this information:
Software Versions
| Grafana | Zabbix | Grafana-Zabbix Plugin |
| ------- | ------ | --------------------- |
| 4.4.0 | 3.2.4 | 3.7.0 |
What did you do?
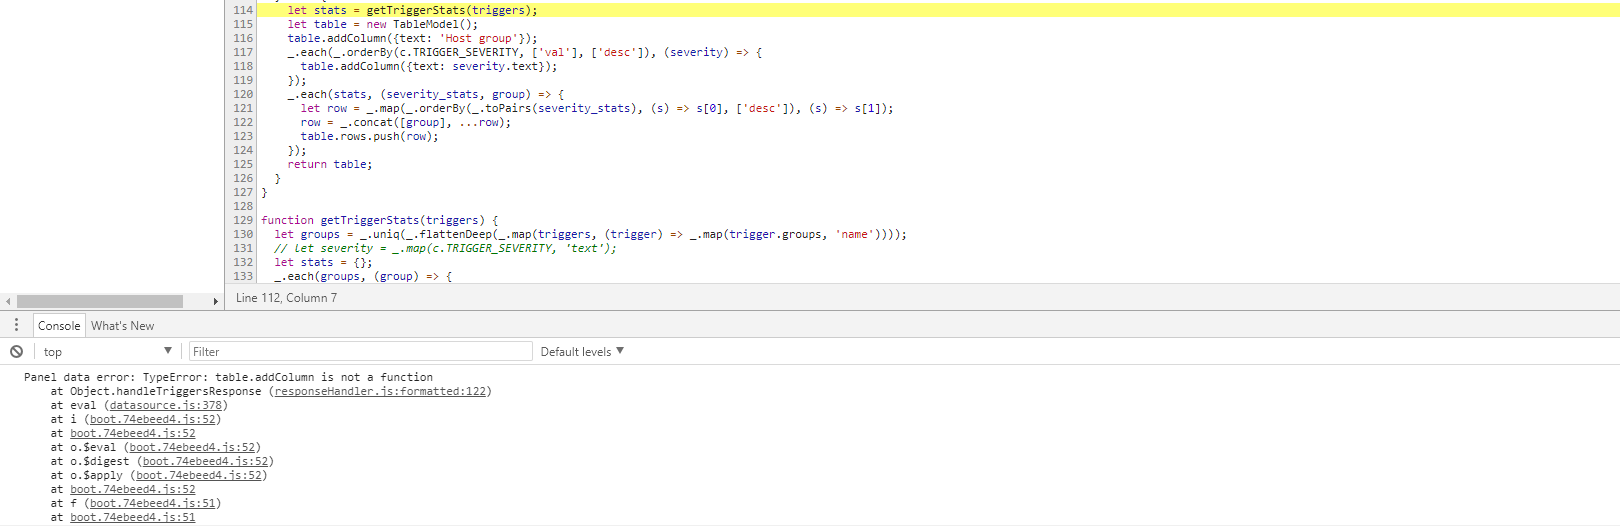
Trying to add a Grafana Table showing all the Zabbix triggers (as shown on http://play.grafana-zabbix.org/dashboard/db/zabbix-system-status?orgId=2). However, as soon as i add all the metrics, i get a error message stating: table.addColumn is not a function.
What was the expected result?
All the triggers retrieved from Zabbix be shown in a table.
What happened instead?
No data to show.
If it relates to metric data visualization would be great to get
- An image or text representation of your metric query

- The raw query and response for the network request (check this in chrome dev tools network tab, here you can see metric requests and other request, please include the request body and request response)
 KevinInphos
All 4 comments
Hm, seems, table.addColumn() available since version 4.5. Try to upgrade Grafana.
 alexanderzobnin
on 1 Dec 2017
alexanderzobnin
on 1 Dec 2017
I encountered the same problem, zabbix-system-status dashboard no data, how do you solve this problem, my zabbix version is 3.4, grafana version is 4.6.3, Grafana-Zabbix Plugin version is 3.7
 rhel2010
on 15 Dec 2017
rhel2010
on 15 Dec 2017
Hello! Today installed grafana-server and grafana-plugin for zabbix and have the same problem - no data. Json request comes back with value 0. Grafana 5.2.1, zabbix 4.0 and latest plugin - 3.9.1.
Is there any way to fix this? Or maybe some workaround to get triggers table with host groups and triggers severity by SQL querries?
 zostapchuk
on 5 Jul 2018
zostapchuk
on 5 Jul 2018
Hello, is there a chance to hace de Scalating info regarding each alert you receive? Like a small pop-up window that you get to see when you run the mouse over that X alarm....
Is there a way?
 hvithval
on 29 Aug 2018
hvithval
on 29 Aug 2018
Related issues
 tolstiyman
·
7Comments
tolstiyman
·
7Comments
 daianmartinho
·
6Comments
alexanderzobnin
·
4Comments
daianmartinho
·
6Comments
alexanderzobnin
·
4Comments
 xiaoxue999
·
3Comments
xiaoxue999
·
3Comments
 maxlehot1234
·
5Comments
maxlehot1234
·
5Comments