在1.x的文档中的网图指南中,给出了比较详细的modes说明
{
  // 默认模式
  default: [
    'dragNode', 'dragEdge', 'dragBlank', 'clickBlankClearActive', 'resizeEdge', 'clickActive',
    'resizeNode', 'wheelZoom'
  ],
  // 编辑模式
  edit: [
    'dragNode', 'dragEdge', 'clickBlankClearActive', 'resizeEdge', 'clickActive',
    'multiSelect', 'resizeNode', 'shortcut', 'wheelZoom'
  ],
  // 拖动模式(查看模式)
  drag: ['shortcut', 'dragCanvas', 'wheelZoom'],
  // 添加模式
  add: ['clickAddNode', 'dragAddEdge']
}
但是新版本文档中graph的modes和mode写的很简略,读者不知道该如何使用这两个参数,希望能够给出更详细的modes和mode的文档
 BaconZhang
All 7 comments
嗯,翻看了两天源码再加上debug,才慢慢摸清楚model的内部组成
源码真的太难读了,有大量的动态函数,各种类型也不清晰,感觉canvas开发还是用上TS好点
 shengbeiniao
on 21 Jun 2018
shengbeiniao
on 21 Jun 2018
modes 这个机制本质上是为了交互隔离而生的。2.0 由于 G6 所在的架构层发生改变,目前是所有的机制都在,所有的实现,全部去掉了。具体参见:https://antv.alipay.com/zh-cn/g6/1.x/tutorial/custom-interaction.html
 TomHuangCN
on 21 Jun 2018
TomHuangCN
on 21 Jun 2018
读源码确实不易,兄 dei 辛苦了。TS 确实会清晰点,最近确实业务太忙了,兄 dei 如果有时间,希望能提 PR ,修改到 TS 呐 : ) @shengbeiniao sh
TomHuangCN
on 21 Jun 2018
大兄弟,有没有微信交流群,可以让大家一起交流的,目前市面上开源的关系型图表确实也就G6不错了 @TomHuangCN
shengbeiniao
on 22 Jun 2018
这两天阅读完G6的文档,还有大部分源码,经过调试后,我发现G6在部分文档上有让人误解的地方
//原始代码
G6.registerNode('customNode', {
  draw(item){
    const group = item.getGraphicGroup();
    group.addShape('text', {
      attrs: {
        x: 100,
        y: 100,
        fill: '#333',
        text: '我是一个自定义节点,\n有下面那个方形和我自己组成'
      }
    });
    return group.addShape('rect', {
      attrs: {
        x: 100,
        y: 100,
        width: 100,
        height: 100,
        stroke: 'red'
      }
    });
  }
});
这里面的return非常让人误解,group可以理解为多层绘制的封装,比如说我想绘制一个图片,带外边框,只需要定义两层shape即可,所以return是可以返回group的
- graph API关于model的定义
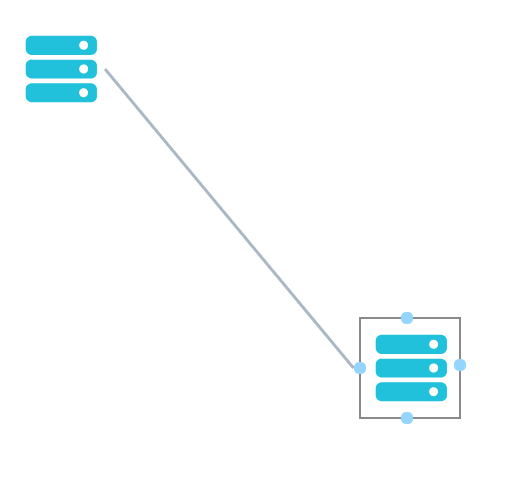
借鉴react,model可以理解为状态驱动图形的渲染,所以这个状态是可以很灵活的,跟数据并没有强绑定关系,翻看源码,发现graph.add()或者graph.update()都会触发group的draw方法【此处的group为G】,所以我们可以在draw中做非常灵活的定制,比如说实现G6-editor中点击某个元素激活,详见以下代码
 G6.registerNode('customNode', {
      anchor: {
        type: 'circle',
        points: [
          [0.5, 0],
          [1, 0.5],
          [0.5, 1],
          [0, 0.5]
        ]
      },
      draw(item) {
        let x = 0,
          y = 0,
          width = 100,
          height = 100,
          r = 6;
        const group = item.getGraphicGroup();
        group.addShape('image', {
          attrs: {
            x: x + 5,
            y: x + 5,
            width: width - 10,
            height: width - 10,
            img: './ecs.svg'
          }
        });
        //激活状态
        if (item.model.status === 'active') {
          group.addShape('rect', {
              attrs: {
                x: x,
                y: y,
                width: width,
                height: width,
                stroke: 'black'
              }
            }),
            //上
            group.addShape('circle', {
              attrs: {
                x: (width - r) / 2,
                y: y,
                r: r,
                fill: '#91d5ff'
              }
            });
          //右
          group.addShape('circle', {
            attrs: {
              x: width,
              y: (height - r) / 2,
              r: r,
              fill: '#91d5ff'
            }
          });
          //下
          group.addShape('circle', {
            attrs: {
              x: (width - r) / 2,
              y: height,
              r: r,
              fill: '#91d5ff'
            }
          });
          //左
          group.addShape('circle', {
            attrs: {
              x: x,
              y: (height - y) / 2,
              r: r,
              fill: '#91d5ff'
            }
          });
        }
        return group;
      }
    });

    const graph = new G6.Graph({
      container: 'app',
      fitView: 'cc',
      width: window.innerWidth,
      height: window.innerHeight
    });

    graph.on('node:click', function (target) {
      //点击node,改变model
      graph.update(target.item, {
        status: 'active'
      })
    });

    graph.add('node', {
      id: 'a',
      x: 100,
      y: 100,
      shape: 'customNode'
    });

    graph.add('node', {
      id: 'b',
      x: 300,
      y: 300,
      shape: 'customNode',
      stroke: 'blue'
    });

    graph.add('edge', {
      source: 'a',
      target: 'b',
      size: 3
    });

    //处理拖动
    let node = 0;
    let dx = 0;
    let dy = 0;

    graph.on('node:dragstart', function (ev) {
      let item = ev.item;
      let model = item.getModel();
      node = item;
      dx = model.x - ev.x;
      dy = model.y - ev.y;
    });

    graph.on('node:drag', function (ev) {
      node && graph.update(node, {
        x: ev.x + dx,
        y: ev.y + dy
      });
    });
最终效果
shengbeiniao
on 22 Jun 2018
@shengbeiniao 选中后取消其他选中,是自己再遍历一个遍数据把active的状态改变吗
 BusyHe
on 1 Aug 2018
BusyHe
on 1 Aug 2018
@TomHuangCN 现在 graph 中如何使用 modes 开启滚动缩放和拖拽?我配置了但是没有生效
const graph = new G6.Graph({
            container: 'cy',
            fitView: 'autoZoom',
            animate: true,
            layout: dagre,
            width: 1200,
            height: window.innerHeight,
            modes: {
                zoom: ['wheelZoom']
            },
            mode: 'zoom'
        });
 xiabaiyang
on 28 Dec 2018
xiabaiyang
on 28 Dec 2018
Related issues
 FISHers6
·
5Comments
FISHers6
·
5Comments
 zcolin
·
7Comments
zcolin
·
7Comments
 yh0210
·
8Comments
yh0210
·
8Comments
 az674lqs
·
6Comments
az674lqs
·
6Comments
 linkai0001
·
6Comments
linkai0001
·
6Comments
Most helpful comment
这两天阅读完G6的文档,还有大部分源码,经过调试后,我发现G6在部分文档上有让人误解的地方
借鉴react,model可以理解为状态驱动图形的渲染,所以这个状态是可以很灵活的,跟数据并没有强绑定关系,翻看源码,发现graph.add()或者graph.update()都会触发group的draw方法【此处的group为G】,所以我们可以在draw中做非常灵活的定制,比如说实现G6-editor中点击某个元素激活,详见以下代码
最终效果
