Checklist:
- [x] I updated to the latest version available
- [x] I cleared the cache of my browser
Home Assistant release with the issue:
0.101.3
UI (States or Lovelace UI?):
Lovelace UI
Browser and Operating System:
Safari 13.0.3
MacOS 10.15.1
Description of problem:
I pinned home assistant to the browser and check it regularly. Over time, the web site is consuming a lot of memory until Safari issues a warning:
"This webpage is using significant memory. Closing it may improve the responsiveness of your Mac"
In my case, activity monitor showed 1.5GB of memory usage for only the home assistant website.
Steps to reproduce this problem:
Pin a Home assistant tab to the browser and leave it open for a long time.
 rosch100
All 27 comments
Are you using any custom lovelace cards?
 thomasloven
on 12 Dec 2019
thomasloven
on 12 Dec 2019
I'm not sure what a custom card is. I just defined tabs for each room (8 in total). Just looked up custom cards - I use none of them.
rosch100
on 13 Dec 2019
Do you use camera streams?
 bramkragten
on 13 Dec 2019
bramkragten
on 13 Dec 2019
No camera streams. Just sensors, a media player, weather and some switches.
rosch100
on 13 Dec 2019
Here is a screenshot of Safari with the memory timeline enabled. Each red mark indicates a manual "refresh". Max memory consumption is at 1.6GB. It seems that memory is sometimes not released for extended periods of time...
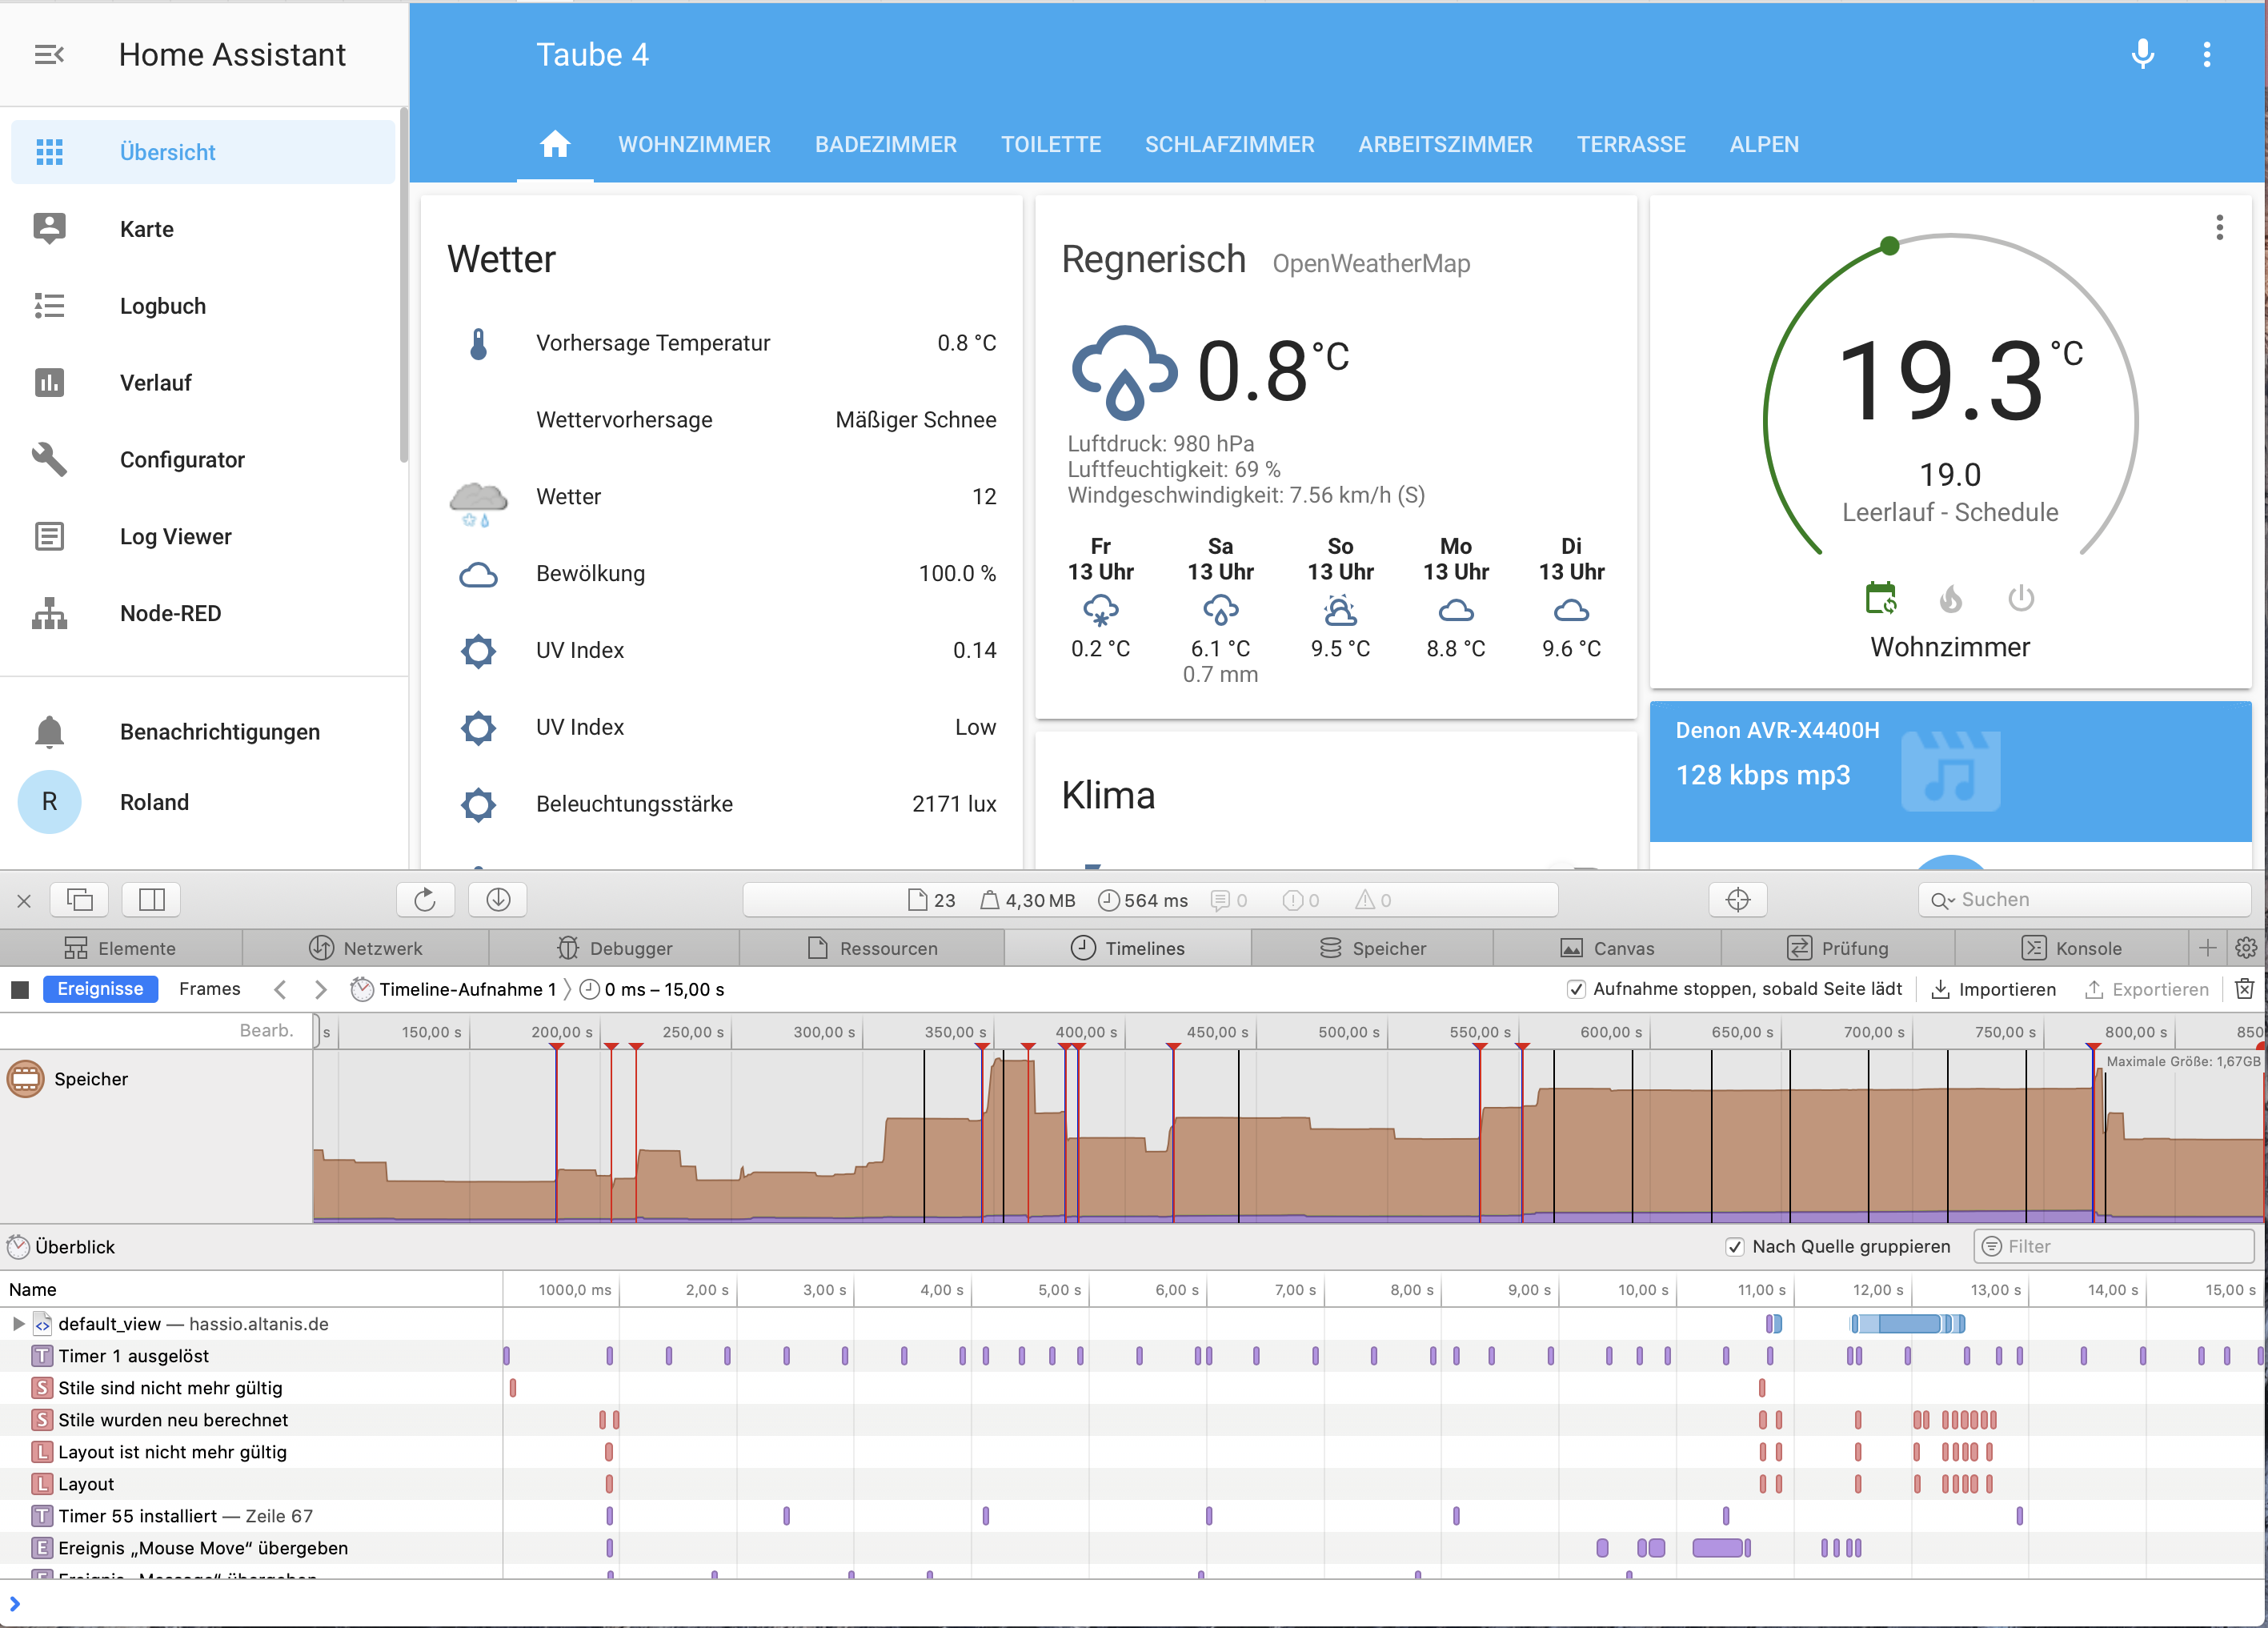
rosch100
on 13 Dec 2019
Same here.
 cmer
on 26 Dec 2019
cmer
on 26 Dec 2019
@cmer also on safari?
bramkragten
on 2 Jan 2020
Yes
cmer
on 2 Jan 2020
I am seeing the same issue with a pretty lightweight setup (Philips Hue, Sonos, two Tasmota smart plugs), a simple reload of the main page shows 1 Gb of memory usage, most of which blames to "Page":
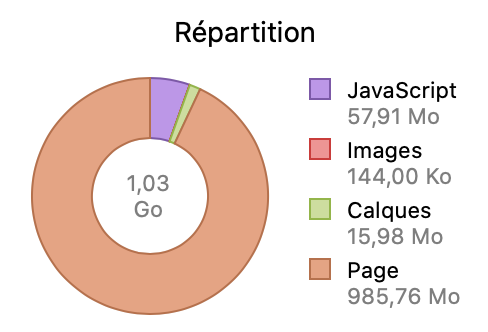
Looking at the Safari web inspector docs, it says:
Page – All other memory. This includes engine memory related to the DOM, styles, rendering data, memory caches, system allocations, etc.
 ndfred
on 4 Jan 2020
ndfred
on 4 Jan 2020
Have that all the time, and have seen that for a very long time independent of the HA versions..Somehow have started to learn to live with it...
Never saw that in safari inspector though, might give a clue to debug the issue. How do you show this memory use in Inspector?
 Mariusthvdb
on 4 Jan 2020
Mariusthvdb
on 4 Jan 2020
You need to enable the developer menu in Safari, then go to the Timelines tab, click the "Modify" button to select the Memory tool, then reload the page. This is what the whole thing looks like for me (sorry for the French UI):
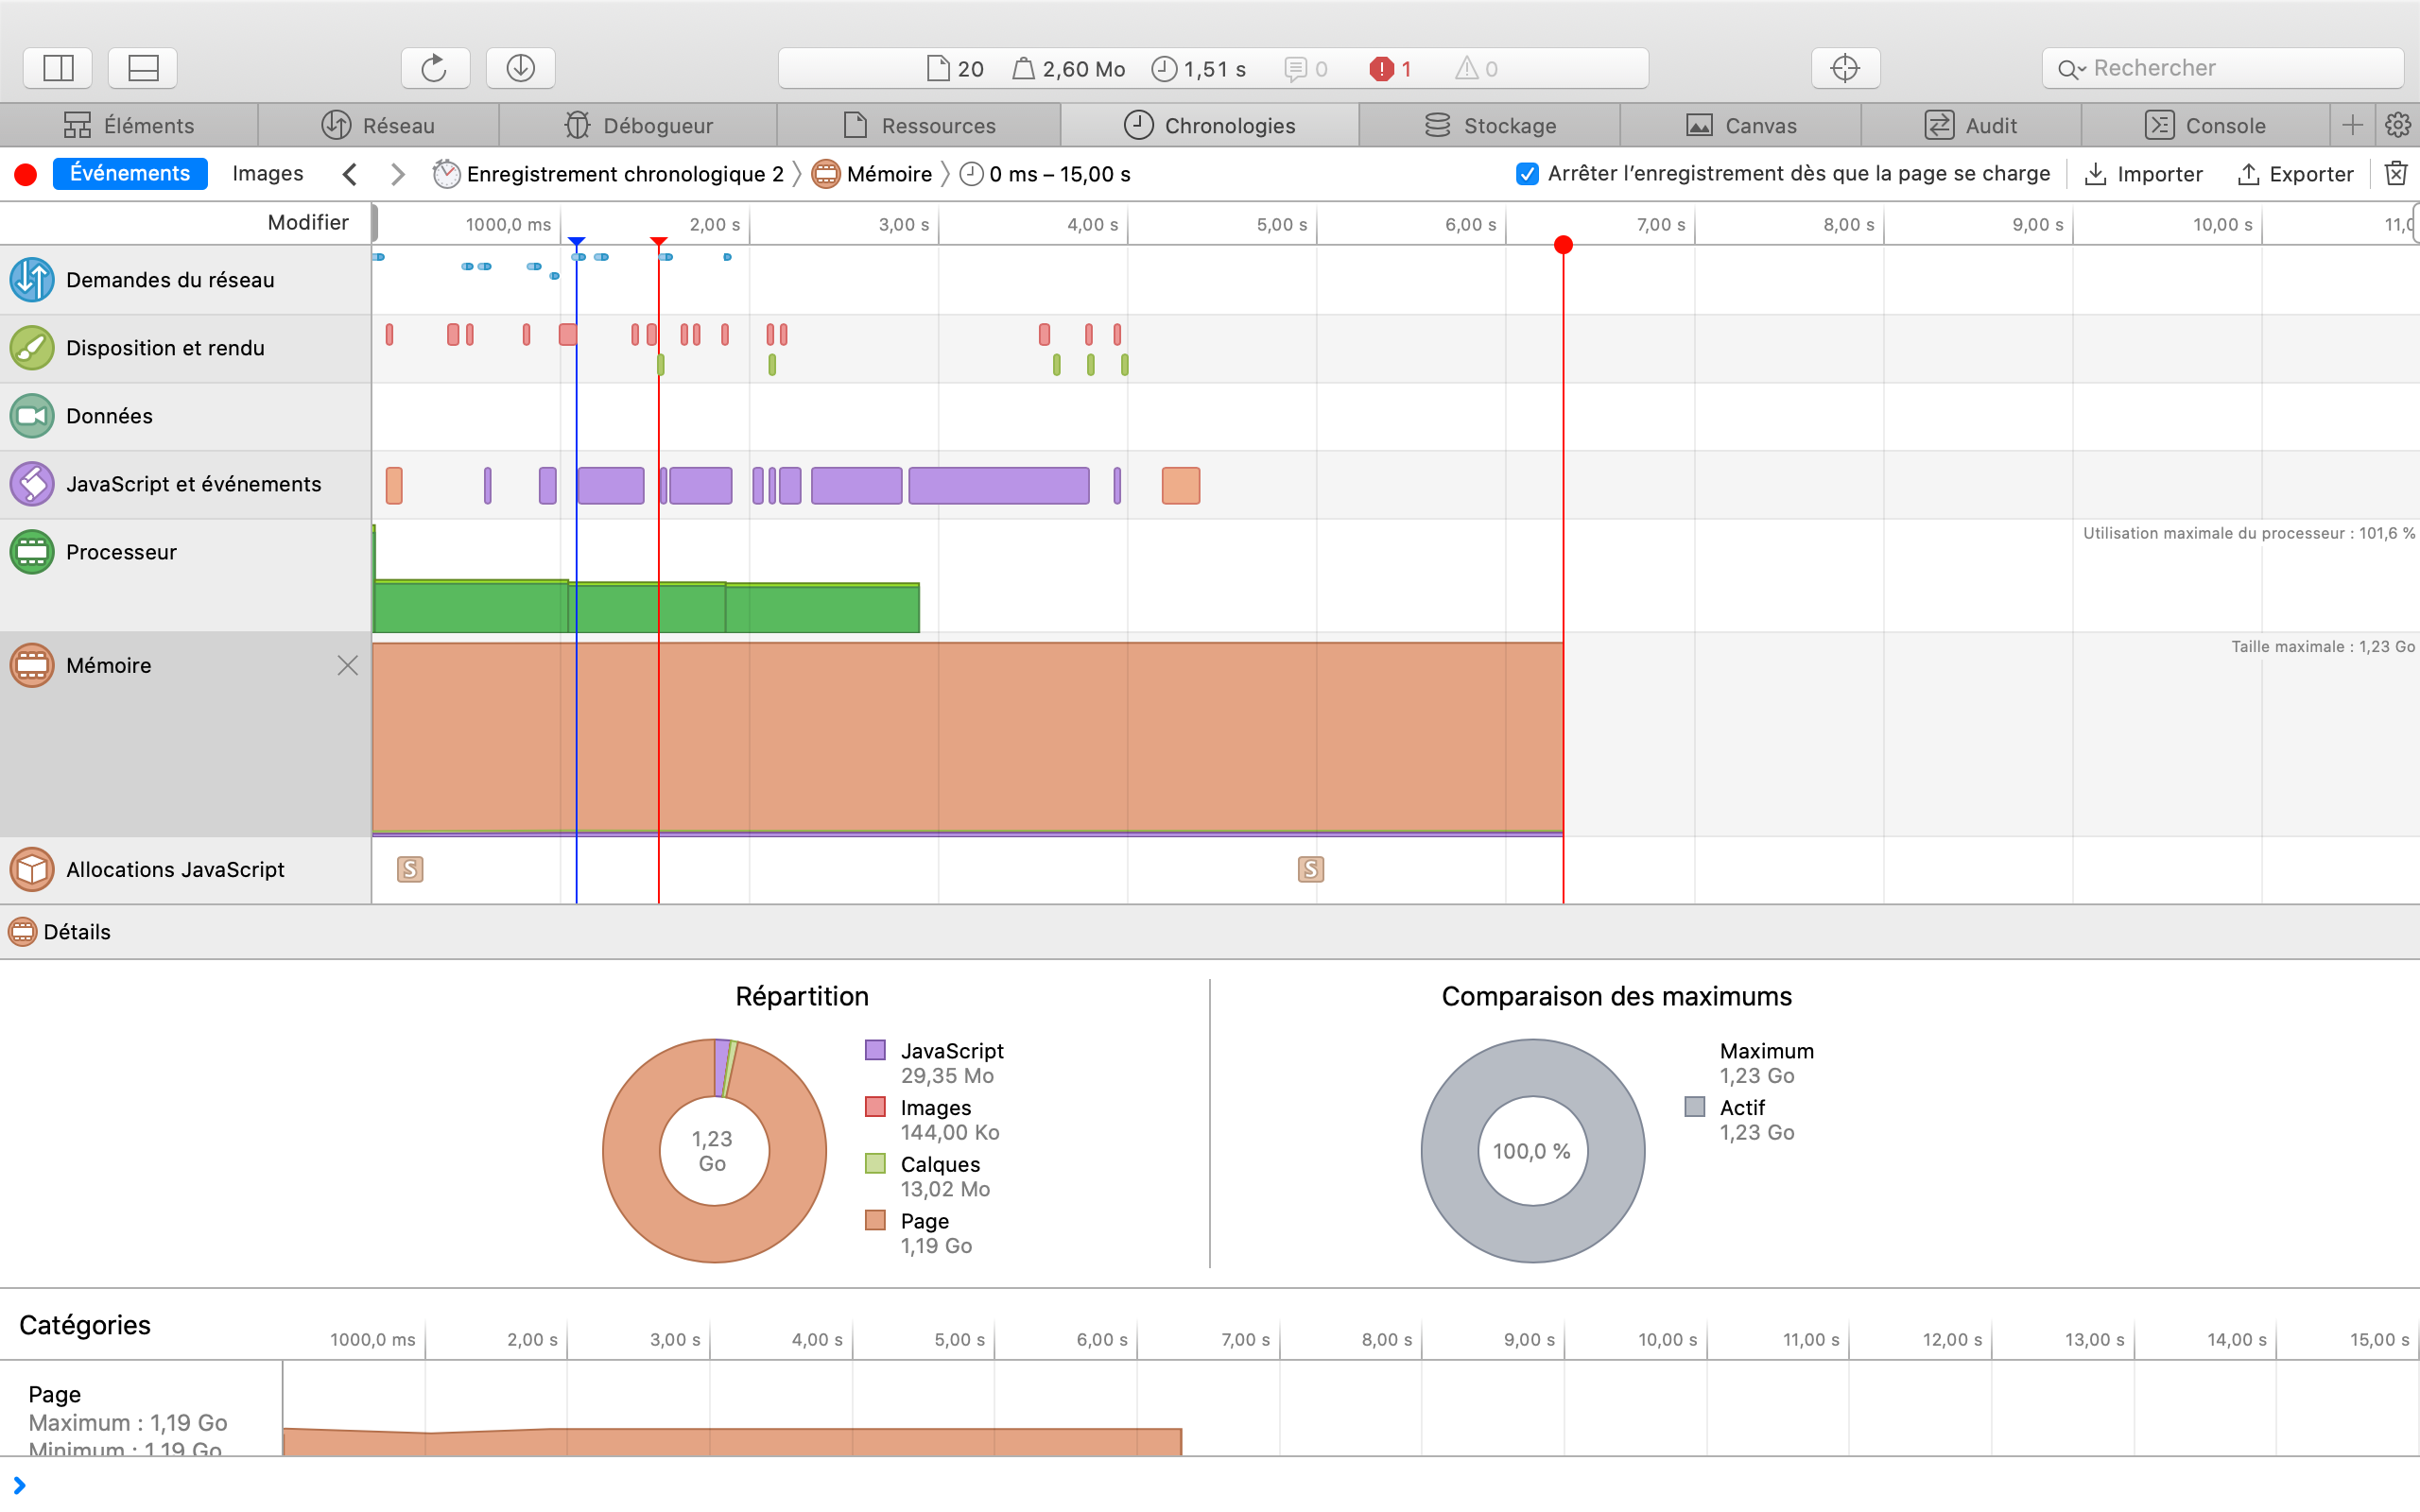
Since the memory used is all in the "Other" bucket (so not JavaScript or images) I don't really know how to drill further, maybe walk through the DOM and look for absurdly deep element hierarchies?
ndfred
on 4 Jan 2020
how odd, I don't have the memory in the left side tools
Mariusthvdb
on 4 Jan 2020
See: https://stackoverflow.com/questions/48465464/cant-see-safari-developer-timelines-memory-instrument
Am 04.01.2020 um 12:30 schrieb Marius notifications@github.com:
how odd, I don't have the memory in the left side tools—
You are receiving this because you authored the thread.
Reply to this email directly, view it on GitHub, or unsubscribe.
rosch100
on 4 Jan 2020
thanks! couldn't select the checkbox though, and couldn't scroll the options. Was only able to slide the full inspector up which revealed the left side options, of which memory is 1.
Will report when I see the excessive power usage notification
Mariusthvdb
on 4 Jan 2020
Same problem here, quite long time (1 year?). Worst place is in /states in Developer Tools. I get the usual "This web page is using significant memory", page is unresponsive and my laptop is hot as hell.
 adrianmihalko
on 11 Jan 2020
adrianmihalko
on 11 Jan 2020
States is expected especially with a lot of states. It should be virtualized, that will solve it probably.
bramkragten
on 11 Jan 2020
History and Logbook are critical places too, with around 1200 statuses (I think this is not as much) it takes 65sec to load, @2GB RAM and same issue.
adrianmihalko
on 11 Jan 2020
bramkragten
on 11 Jan 2020
Same issue with a minimal setup that I just built. Just two lights and a handful of sensors.
 mkuutti
on 11 Feb 2020
mkuutti
on 11 Feb 2020
The usage goes up especially when I configure the UI.
 melyux
on 23 Feb 2020
melyux
on 23 Feb 2020
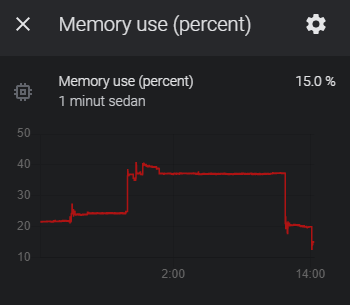
I have the same issue. After some time the memory goes upp to 40%. When I reboot the memory goes down to 15 %. Something is leaking. Running 0.109.6
 jazbraz
on 10 May 2020
jazbraz
on 10 May 2020
@jazbraz that is your server memory or your client memory?
bramkragten
on 12 May 2020
I really don´t know? It is my "sensor.memory_use_percent" in home assistant.
jazbraz
on 12 May 2020
That would be your server, this issue is about the client (browser).
bramkragten
on 12 May 2020
ok sorry
That would be your server, this issue is about the client (browser).
ok sorry.
jazbraz
on 12 May 2020
Fixed this with answer from a duplicate issue. I simply had to turn off content blockers for my HA server. Everything’s good now.
melyux
on 15 May 2020
There hasn't been any activity on this issue recently. Due to the high number of incoming GitHub notifications, we have to clean some of the old issues, as many of them have already been resolved with the latest updates.
Please make sure to update to the latest Home Assistant version and check if that solves the issue. Let us know if that works for you by adding a comment 👍
This issue now has been marked as stale and will be closed if no further activity occurs. Thank you for your contributions.
![stale[bot] picture](https://avatars3.githubusercontent.com/in/1724?v=4&s=40) stale[bot]
on 16 Aug 2020
stale[bot]
on 16 Aug 2020
Related issues
 tomlut
·
28Comments
tomlut
·
28Comments
 deluxestyle
·
25Comments
deluxestyle
·
25Comments
 OnFreund
·
26Comments
OnFreund
·
26Comments
![move[bot] picture](https://avatars1.githubusercontent.com/in/6673?v=4&s=40) move[bot]
·
25Comments
move[bot]
·
25Comments
 balloob
·
43Comments
balloob
·
43Comments
Most helpful comment
https://github.com/home-assistant/home-assistant-polymer/pull/4450