Fenix: [Bug] Every now and then Fenix Nightly becomes very slow and laggy, stuttery, and unusable, needs restart
Steps to reproduce
I don't know the steps exactly, but this has been my experience with Fenix Nightly for the past few weeks (maybe more than a month) through normal use with on average 30 tabs open and there don't seem to be any particular websites which cause this, it can happen on any.
Expected behavior
No lags, no stuttering, no crawling to the point of being unusable - just like Fennec :wink:
Actual behavior
After a period of use (I haven't noticed a specific period) with several (many? about 30 I think on average, but it goes up and down as you'd expect) tabs open Fenix becomes laggy, stuttery and slows down to the point of being unusable. Actions take seconds to be responded to. In the early days and weeks of this problem Fenix would crash, but now it doesn't crash, I need to force stop and restart it to make it usable again.
Note that I've tried disabling all add-ons and also disabling all the data gathering options in settings. I normally have strict origin when cross-origin and first party isolation enabled in about:config and and disabling these doesn't improve matters.
Device information
- Android device: Nokia 8 with Android 9
- Fenix version: This is the version today but like I said I've had this issue for a few weeks.
Nightly 200705 06:01 (Build #2015750195)
AC: 49.0.20200702190156, bafa9299b
GV: 80.0a1-20200702094606
AS: 61.0.7
 madb1lly
All 37 comments
Hi all,
Any ideas how to identify the cause of this, isolate the problem? I use this browser daily so now that tabs are synced 😃 I can test without risk of losing much in the way of ongoing sessions.
Cheers 🙂
madb1lly
on 7 Jul 2020
Getting a perf recording would be helpful.
 kbrosnan
on 7 Jul 2020
kbrosnan
on 7 Jul 2020
Hi @kbrosnan,
Thanks for the suggestion. That will be tricky but I'll try and set up my laptop to do this (too hot to use desktop at the moment in the evenings, which is the only time I can use it).
Any other suggestions?
Thanks 🙂
madb1lly
on 8 Jul 2020
Triage: we haven't reproduced this before but we suspect the root cause may be a memory leak. We'll prioritize fixing the existing known memory leaks and re-evaluate if this is still a problem.
A perf recording or profile could be helpful though, especially if the memory leaks aren't the problem. :)
 mcomella
on 9 Jul 2020
mcomella
on 9 Jul 2020
Known memory leaks:
mcomella
on 9 Jul 2020
Hi @mcomella,
Thanks for the links. Yes it feels like some sort of memory leak triggered by something - things are working fine and then after a while they grind to a halt pretty quickly. I haven't changed the location of the address bar but I will check if accessing settings triggers this.
Cheers 🙂
madb1lly
on 9 Jul 2020
Hi @mcomella,
I had the issue without having been in settings for hours, so something else is causing it. I've not had chance to try profiling yet.
Cheers 🙂
madb1lly
on 10 Jul 2020
Hi all,
Just to say that this is still happening but not as frequently and I've still not yet had chance to attempt this profiling thing. I think that it might actually be a problem with Qwant as I use that as my default search engine (or, because Qwant is the site I use most it is just likely coincidence that I have it loaded when the slowdown happens).
I did also get serious slowdown viewing the mobile version of drive.google.com but the desktop version ran fine. From now on I'll try to remember to post here which sites seem to be causing the problem.
Cheers 🙂
madb1lly
on 20 Jul 2020
I'm unable to reproduce using Firefox Preview 79.0.0 (build 22031213) with 30 open tabs on my Samsung Galaxy S10 (android 10). However, approximately 19% of clients have reported 30 or more open tabs in the last month, and given the impact when this does reproduce, I'm going to add to the backlog for further investigation at a relatively high priority.
 ecsmyth
on 21 Jul 2020
ecsmyth
on 21 Jul 2020
Hi @ecsmyth,
Thanks for trying to reproduce. It happens most when i open several new tabs from a search page. Could be the search page that's the problem, or one of the new tabs, or just the volume of new pages. For example i searched Qwant for "microbit arduino" and opened several tabs and then got the slowdown, phone got hot, battery visibly emptying! One of pages seemed to be particularly problematic : https://learn.adafruit.com/use-micro-bit-with-arduino/logging-temperature-to-adafruit-io and that whole article was pretty difficult to read through.
I hope that helps!
Cheers 🙂
madb1lly
on 21 Jul 2020
Hi all,
Happened again today, again after opening a large number of new tabs. This time it was Github pages which seemed to cause the biggest slowdown.
Cheers 🙂
madb1lly
on 23 Jul 2020
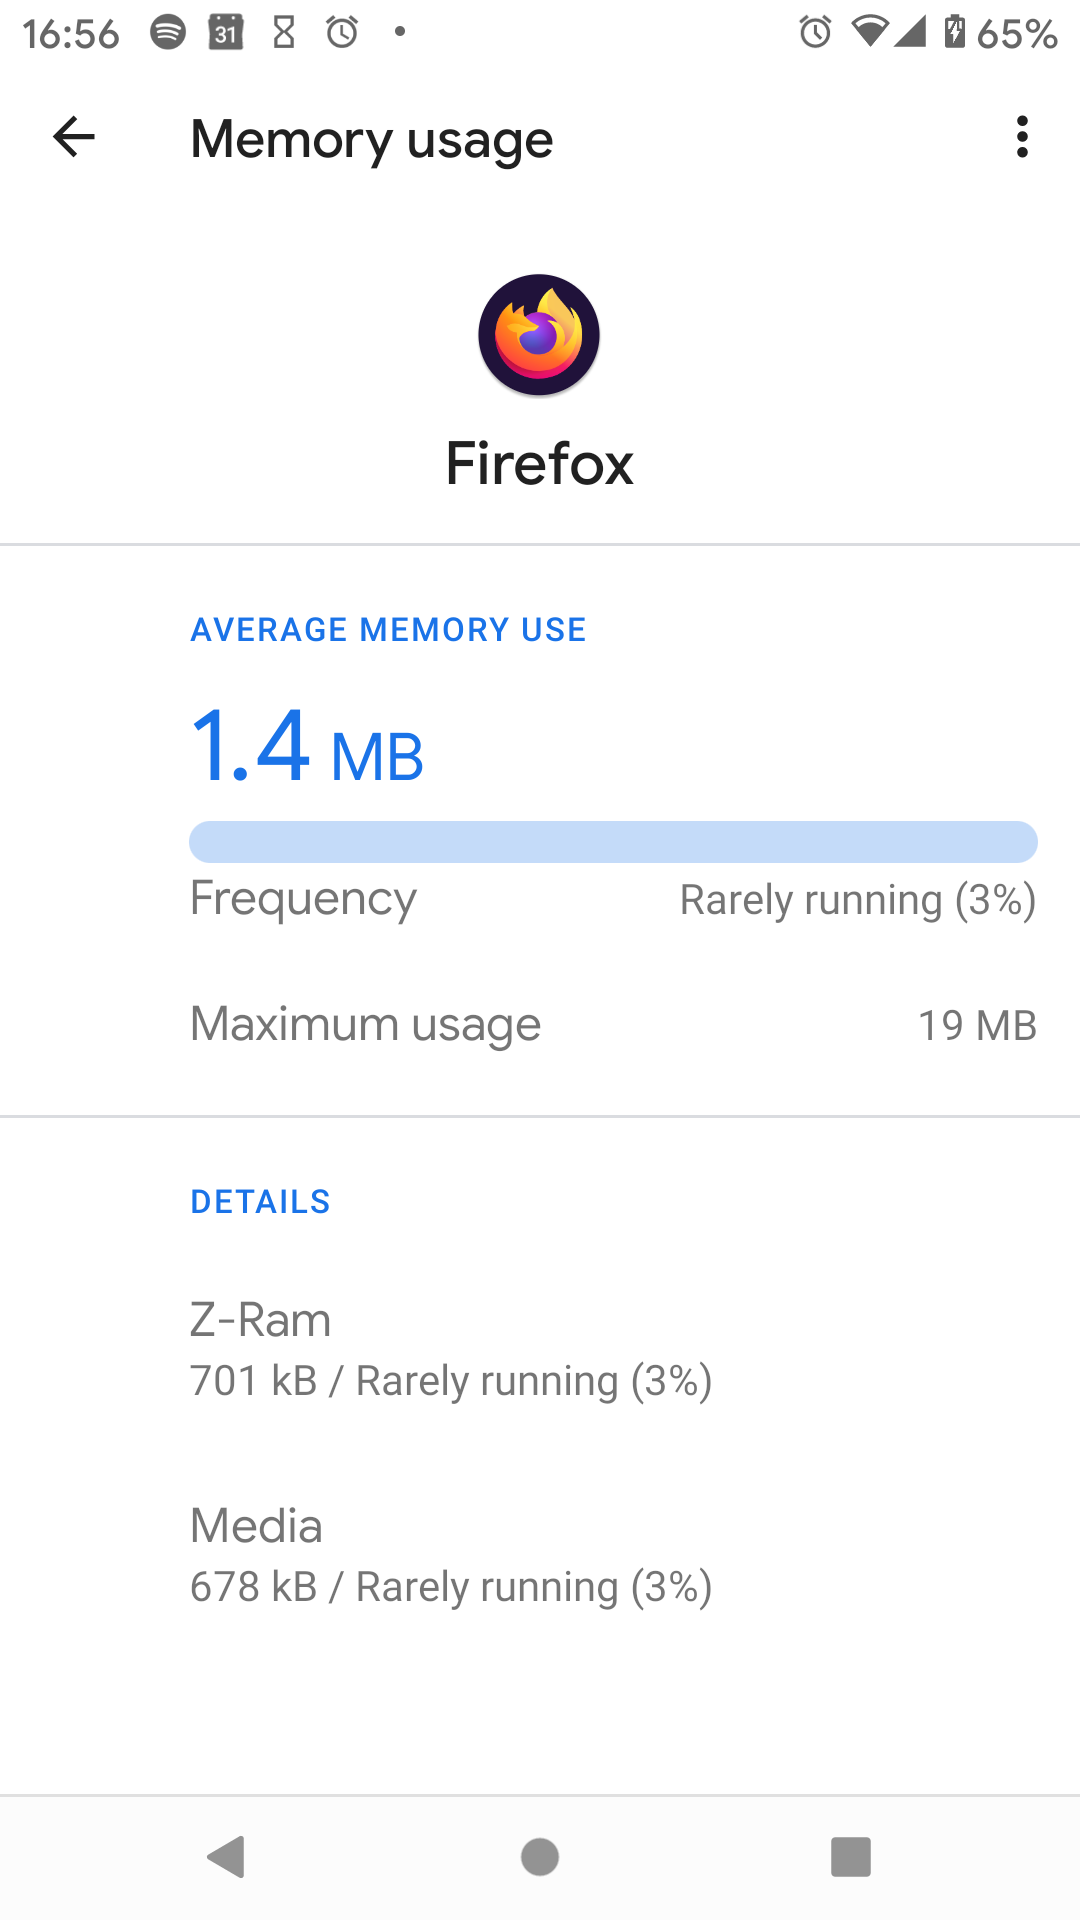
@madb1lly The next time this happens, would you be able to tell us how much RAM Firefox is using? To do so, you need to:
- Enable developer options
- If you're unfamiliar with it, it's settings to allow developers to understand what's happening on the phone; I wouldn't recommend changing anything in there because it can negatively impact your phone experience. If you're not comfortable doing this, we understand :)
- Go to system settings -> system -> advanced -> Developer Options -> Memory -> Memory used by apps
- Click on Firefox
Then can you tell us what is on that screen? A screenshot could be a good way to do that.
For example, my screen looks like this (it's deceptively low because it's reporting an average over the past 3 hours):
mcomella
on 4 Aug 2020
Hi @mcomella,
Thank you for the reminder - yes I will do that. I've not had the problem for a few days but I will try and force it later. I'd also forgotten to do the profiling thing, so I will try hard to remember to do it next time I have the opportunity.
Cheers 🙂
madb1lly
on 4 Aug 2020
I believe we've addressed all the known memory leaks in Firefox Nightly – please let me know if you experience this again.
mcomella
on 8 Aug 2020
@mcomella
I believe we've addressed all the known memory leaks in Firefox Nightly
LeakCanary still shows a few leaks in a debug build. I know that there is at least a leak in the SavedLoginsAuthFragment. I'll try to do some more testing and file issues with steps to reproduce for all leaks I find soon.
 cadeyrn
on 8 Aug 2020
cadeyrn
on 8 Aug 2020
LeakCanary still shows a few leaks in a debug build. I'll try to do some more testing and file issues with steps to reproduce for all leaks I find soon.
I was unaware – thank you so much for reporting those! It sounds like devs aren't generally hitting these STRs then – I wonder if there's something we can do better. CC @rpappalax – I wonder if we should have QA sometimes test on builds with LeakCanary enabled (currently just debug) so we're more likely to find memory leaks.
mcomella
on 8 Aug 2020
I also saw a message from LC. I did not report it.
 andreicristianpetcu
on 8 Aug 2020
andreicristianpetcu
on 8 Aug 2020
I filed #13477, #13478, #13479 and #13480 for a few more leaks.
cadeyrn
on 10 Aug 2020
Hi all,
I've not experienced the issue again in normal browsing for a week or so. I've not been able to recreate it either. Thanks 😃
madb1lly
on 11 Aug 2020
I filed #13477, #13478, #13479 and #13480 for a few more leaks.
@cadeyrn Thank you so, so much for finding those and filing them! I really appreciate it!
I've not experienced the issue again in normal browsing for a week or so. I've not been able to recreate it either. Thanks 😃
That's good news – let's leave this open for a few more weeks (until Sept 1?) to see if the issue comes back and, if not, close the issue. And thanks for filing this too (it encouraged us to go into the backlog to find and fix these leaks sooner) 😄!
mcomella
on 11 Aug 2020
I'm seeing this a lot lately (2-3 times daily), but: it never crashes the browser, it always clears up after ca. 20-30 seconds, and it immediately vanishes when switching to another app and back to the browser, thus making it really hard to capture a profile for this. This is always on the most current Nightly and a Sony Xperia Z2, Android 6.0.1.
Edit: So I did try to reproduce this for 45 minutes, opening and closing lots of tabs in private and normal browsing mode, even starting filter updates in uBlock Origin in the background - but I wasn't able to reproduce 😞
I was able to limit the cause for the stutter - it is only the front-end UI that is introducing the stutter, thus leading to stuttering in the GV part of Fenix since it does not receive enough vertical sync events anymore. This is limited to the hiding and showing of the dynamic toolbar, everything else is still responsive. When the dynamic toolbar is hidden and I do not change the scrolling direction, scrolling is smooth again. But scrolling will become very stuttery once the dynamic toolbar starts appearing again.
 hwinnemoe
on 28 Aug 2020
hwinnemoe
on 28 Aug 2020
I see the same with my Xperia XZ1 Compact (Snapdragon 835), suddenly the new Firefox (Webrender enabled) starts to stutter and is slow at scrolling / repainting until it is restarted.
 ceisserer
on 4 Sep 2020
ceisserer
on 4 Sep 2020
@hwinnemoe @ceisserer Would either of you be able to set up the Firefox Profiler to take a profile when this occurs? You can do this with a release build. I believe you only need follow these instructions: https://profiler.firefox.com/docs/#/./guide-remote-profiling?id=setup Once it's set up, it should be really simple to take a profile (here's a video showing how). After that you can click share in the upper right corner and drop a link in this bug.
If the set up process doesn't work, you may also need to have adb installed – I'm not sure. _edit: I checked with the team and adb does not need to be installed._
mcomella
on 12 Sep 2020
@mcomella I tried again today (see https://github.com/mozilla-mobile/fenix/issues/12302#issuecomment-682459655 for first try) but it seems like connecting up my device does not reproduce the same conditions as when I use it normally. A native way to capture profiles on Android would be helpful here since the issue vanishes the moment I switch to another app - connecting my device to the PC also produces several prompts that makes the device switch away from Fenix, thereby resolving the issue and thus makes it impossible to capture a profile for me while the issue can be observed.
As I only see the issue while the toolbar is hiding or showing again, I disabled the _Scroll to hide toolbar_-option since it is available and I have not seen this issue since then. I will now continue browsing with the dynamic toolbar enabled and report back if I encounter the issue again.
Edit: And I've seen it again today (2020-09-13) with the dynamic toolbar enabled but was unable to capture a profile of it since the device was not attached and I was using PBM.
hwinnemoe
on 12 Sep 2020
but it seems like connecting up my device does not reproduce the same conditions as when I use it normally. A native way to capture profiles on Android would be helpful here since the issue vanishes the moment I switch to another app -
@hwinnemoe With the method I suggested above, after debugging is configured, I believe you shouldn't have to switch to another app: you plug in your phone, open remote debugging on firefox desktop, and click to capture a profile.
What app are you switching to?
connecting my device to the PC also produces several prompts that makes the device switch away from Fenix
In my experience, if these dialogs are the "confirm USB debugging" prompts, you can say, "Don't ask me again" and the prompt won't appear again. However, they may be different prompts – what prompts are you seeing?
We're probably using different devices and it's possible different manufacturers show different prompts or launch different applications when the device is connected a computer.
mcomella
on 17 Sep 2020
The problem is - I'm unable to reproduce once my device is connected. I can only guess that it does not have the same performance profile when connected and charging. I have captured profiles from this device with no issues, but for some reason I cannot reproduce this specific issue while the device is connected.
Regarding the prompt - my device will always ask for choosing between different connection option (just charging, two different transfer modes etc.). I was able to connect my device quickly enough while experiencing the issue and indeed it resolves the issue the moment it presents a prompt. The issue is intermittent, I see it daily once or twice but it vanishes after 20-30 seconds. So the only way I can think of capturing a profile for this issue is having a lot of patience 😞 or to hope for a new native profiler option.
Is there any background process that could block the main UI thread for 20-30 second on a low to mid-end device? It almost looks like some code misbehaves that controls the logic for hiding/showing the toolbar, but this is only guesswork with no capture. I primarily see the issue when I e.g. quickly scroll a tab or use the back key to return to a previous tab.
hwinnemoe
on 17 Sep 2020
I can only guess that it does not have the same performance profile when connected and charging
Curious. @hwinnemoe Is your battery low or do you have some battery saver mode enabled when you experience these issues? It's possible your device is throttling the CPU to save battery.
By the way, we may be implementing an option to profile the application without having a separate device attached for the duration of the profile so I'll let you know if that happens.
Is there any background process that could block the main UI thread for 20-30 second on a low to mid-end device?
I'm not familiar with anything but I'm not familiar with large parts of the code base – @boek do you have any ideas if there is some background operation that could cause jank on the main UI thread for 20-30 seconds on a low to mid-end device?
mcomella
on 19 Sep 2020
Curious. @hwinnemoe Is your battery low or do you have some battery saver mode enabled when you experience these issues? It's possible your device is throttling the CPU to save battery.
No, I can reproduce regardless of the battery status, even when putting the device in battery saver mode on purpose or not allowing the device to enter battery saver mode at all. Only when connecting it to my desktop PC I am unable to reproduce, but that may have just been bad luck.
In addition, changing between PBM and normal browsing mode and pressing the new tab button also resolves the issue immediately. Is there any process that can block the main UI thread but will be stopped when changing between modes?
Still, I was not able to capture a profile but I did save a logcat log while Fenix was stuttering again, this time for a very prolonged time (3 minutes) until I backgrounded it and resumed it:
https://gist.github.com/hwinnemoe/6cefb85c48520c511a2896def03165bb
The issue starts to surface around timestamp 09-19 12:18:00 but a lot of errors can be seen in the log before this. At timestamp 09-19 12:21:13.262 I background Fenix and resume it again and the issue resolves itself immediately. This is on Nightly 200919 06:03 (Build #2015764785).
hwinnemoe
on 19 Sep 2020
@hwinnemoe Thanks for providing logs. A few more questions:
- Is the device hot to touch when this happens? I wonder if the device is overheating and being throttled that way
- Are you using stock Android or some variant?
I didn't see anything in the logs pinpoint an answer (but I only looking briefly) but the extracted logs below were interesting.
Several sony services start around the time the error occurs:
09-19 12:17:57.620 I/ActivityManager( 1004): Start proc 13815:com.sonymobile.devicesecurity.service/1000 for service com.sonymobile.de
vicesecurity.service/.DeviceSecurityService
09-19 12:18:00.814 I/ActivityManager( 1004): Start proc 13849:com.sonymobile.podcast/u0a64 for broadcast com.sonymobile.podcast/.feed.PodcastBroadcastReceiver09-19 12:18:01.054 I/ActivityManager( 1004): Start proc 13872:com.sonyericsson.usbux/1000 for broadcast com.sonyericsson.usbux/.gagtm.GaGtmServiceReceiver
Perhaps it's creating too much background work to keep up. I also noticed that these process seem to have trouble using Google Analytics:
09-19 12:18:00.814 I/ActivityManager( 1004): Start proc 13849:com.sonymobile.podcast/u0a64 for broadcast com.sonymobile.podcast/.feed.
PodcastBroadcastReceiver
09-19 12:18:00.978 I/GAv4 (13849): Google Analytics 8.1.15 is starting up. To enable debug logging on a device run:
09-19 12:18:00.978 I/GAv4 (13849): adb shell setprop log.tag.GAv4 DEBUG
09-19 12:18:00.978 I/GAv4 (13849): adb logcat -s GAv4
09-19 12:18:00.994 W/GAv4 (13849): AnalyticsReceiver is not registered or is disabled. Register the receiver for reliable dispatchi
ng on non-Google Play devices. See http://goo.gl/8Rd3yj for instructions.
09-19 12:18:00.997 W/GAv4 (13849): CampaignTrackingReceiver is not registered, not exported or is disabled. Installation campaign t
racking is not possible. See http://goo.gl/8Rd3yj for instructions.
09-19 12:18:01.002 W/GAv4 (13849): AnalyticsService not registered in the app manifest. Hits might not be delivered reliably. See h
ttp://goo.gl/8Rd3yj for instructions.09-19 12:18:01.038 W/GoogleTagManager(13849): IllegalStateException getting Advertising Id Info
It makes me wonder if an error occurs because GA analytics is not available or if this is a non-stock Android that could be running custom code that creates performance issues (e.g. a package pretending to be GA analytics).
Finally,
09-19 12:18:01.569 D/GeckoSession(12293): handleMessage GeckoView:StateUpdated uri=null
Is interspersed through the logs, one occurring around when the issue occurs. I'm surprised the uri is null and I don't know what StateUpdated means – could this be indicative of an issue? I know PageStop often has uri=null so maybe not.
mcomella
on 22 Sep 2020
Hello @mcomella,
I know you were replying to @hwinnemoe but I'll add my case as well for your info.
I've not noticed this issue for a while; at least, Fenix hasn't become unusable, although there are occasions when it gets slower than normal.
You asked about the phone getting hot: When I was experiencing this issue frequently my phone was definitely getting hot, but there have been no changes since then to the other processes going on on my phone which could explain the difference, so I think the difference is that Fenix has been improved.
My phone is running stock Android plus many apps. I've disabled most preinstalled Google apps but Play Services, Play Store are still enabled.
Cheers 🙂
madb1lly
on 22 Sep 2020
Is the device hot to touch when this happens? I wonder if the device is overheating and being throttled that way
No, it is not hot to touch.
Are you using stock Android or some variant?
It is the default stock Android provided by Sony. I have disabled most of Google's apps which may explain the GA errors, but all Play Services are active.
Perhaps it's creating too much background work to keep up.
That partially contradicts the observation that I can easily resolve the issue by either backgrounding & resuming Fenix or switching from PBM to normal browsing mode by opening the tab tray and a non-private browsing tab. It may still be a combination of things, e.g. my device configuration leading to a non-responsive Fenix that somehow gets resolved by some actions inside Fenix.
The fact that I can resolve the issue from within Fenix tells me that there might be something interesting happening when switching between PBM and non-PBM modes, but there are a lot of callbacks happening when doing this. I will try to capture another log when it happens again.
hwinnemoe
on 22 Sep 2020
The fact that I can resolve the issue from within Fenix tells me that there might be something interesting happening when switching between PBM and non-PBM modes, but there are a lot of callbacks happening when doing this. I will try to capture another log when it happens again.
Very good point – thanks for pointing that out. :) It does sound like the problem is within Fenix rather than a background process.
mcomella
on 23 Sep 2020
As my suggestion, GeckoView can be run as a separate process, or eventually running as a service.
 KrasnayaPloshchad
on 5 Oct 2020
KrasnayaPloshchad
on 5 Oct 2020
Triage: let's ask ecsmyth what they think about how to proceed on this one – there isn't a clear path forward but there are a lot of consequences to this.
The fact that I can resolve the issue from within Fenix tells me that there might be something interesting happening when switching between PBM and non-PBM modes
csadilek mentions that we recreate the activity in this case and the old one gets GC'd so it's possible this is a memory issue. There are still a few memory leaks in private browsing mode: https://github.com/mozilla-mobile/fenix/issues/13785
mcomella
on 5 Nov 2020
@hwinnemoe Are you still able to reproduce in the latest nightly? csadilek fixed a few more known memory leaks (some are linked from https://github.com/mozilla-mobile/fenix/issues/13785).
mcomella
on 2 Dec 2020
@mcomella I am happy to report that I have not seen this specific issue for weeks. I guess we could close this one and I will open a new issue if it ever resurfaces.
hwinnemoe
on 3 Dec 2020
That's good news. :)
I guess we could close this one and I will open a new issue if it ever resurfaces.
That sounds good to me. Thanks for working with us to debug the issue.
mcomella
on 7 Dec 2020
Related issues
andreicristianpetcu
·
3Comments
 abodea
·
3Comments
abodea
·
3Comments
 robsmith11
·
3Comments
robsmith11
·
3Comments
 bbinto
·
3Comments
bbinto
·
3Comments
 phileastv
·
3Comments
phileastv
·
3Comments
Most helpful comment
I filed #13477, #13478, #13479 and #13480 for a few more leaks.