Electricitymap-contrib: Parser dashboard for real time data availability
I suggest creating a data quality dashboard accessible to everyone, in order to help contributors know which parsers are working and which one needs to be fixed.
Ideally, It could be accessible via a specific button on the electricity map welcoming left panel, with the following information (to start with)
- List of non-working parsers for power production and for exchanges (real time)
- Error message
- Link to the parser file on github directory
Step 2, think of how to display this dashboard for the past 24h or longer
 brunolajoie
All 10 comments
Great idea, I think it would be better to have the dashboard on a separate page rather than trying to fit it in with the rest of the map.
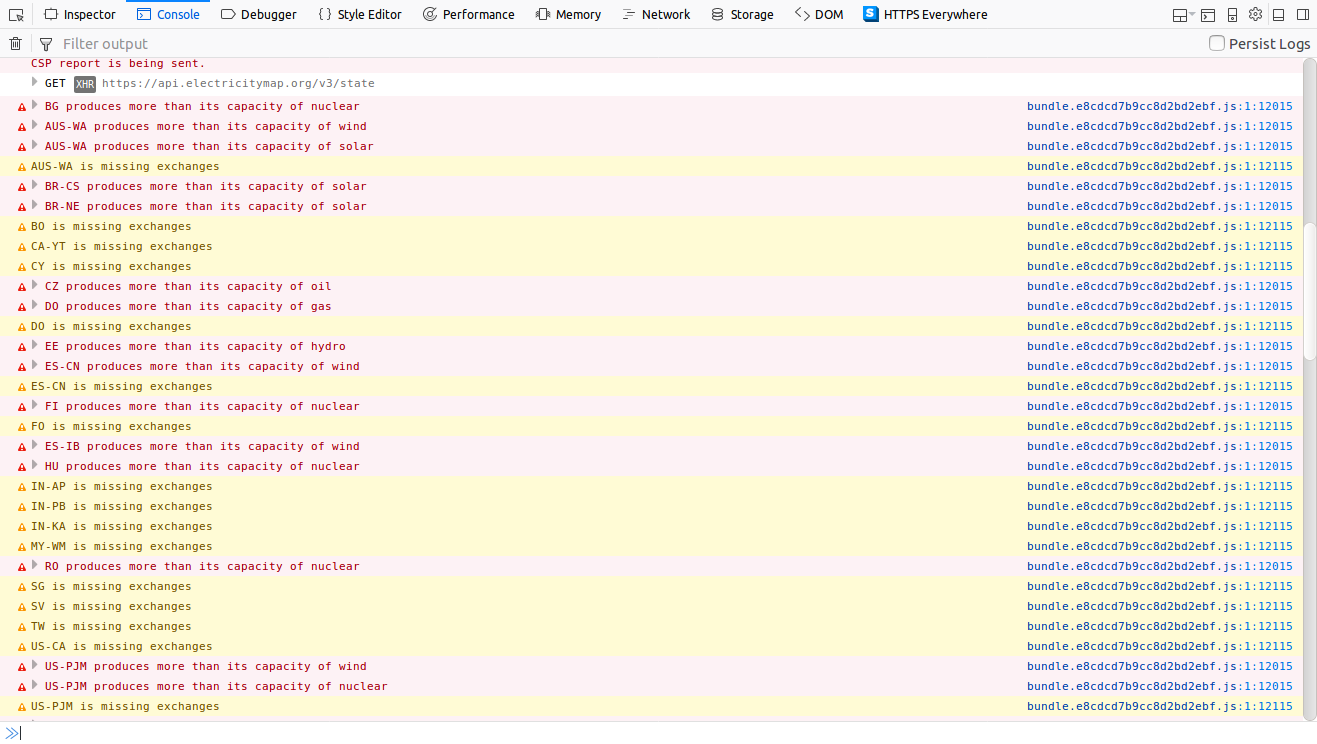
Another idea, in the console log it shows when production of a specific type of generation is exceeding max capacity, indicating the capacity should be reviewed/updated. Maybe we could include this info in the dashboard.
 systemcatch
on 16 Jan 2018
systemcatch
on 16 Jan 2018
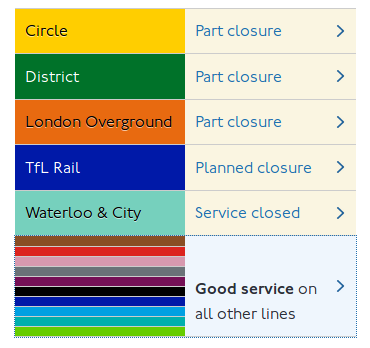
Further idea for this. The London Underground has a nice design showing service status for all lines. I'd recommend separating out the capacities from this avoid too much clutter.
systemcatch
on 25 Feb 2018
oli's suggestion so it doesn't get lost.
Maybe a simple first step would be to set up an ELK stack (ElasticSearch + Kibana) on which we can see logs of parsers on two levels (warnings + errors).
systemcatch
on 4 Mar 2018
FYI we have an internal PR ready about this, so it will be up soon.
 corradio
on 4 Mar 2018
corradio
on 4 Mar 2018
@maxbellec and I finished pushing it.
You can see a log history of warnings and errors here:
https://kibana.electricitymap.org/app/kibana#/discover/1710fdd0-2460-11e8-a779-9d01de8d7a71?_g=(refreshInterval:('$$hashKey':'object:6765',display:'10%20seconds',pause:!f,section:1,value:10000),time:(from:now-15m,mode:quick,to:now))&_a=(columns:!(level,extra.path,message),filters:!(('$state':(store:appState),exists:(field:level),meta:(alias:!n,disabled:!f,index:'93e631f0-245f-11e8-a779-9d01de8d7a71',key:level,negate:!f,type:exists,value:exists)),('$state':(store:appState),meta:(alias:!n,disabled:!f,index:'93e631f0-245f-11e8-a779-9d01de8d7a71',key:level,negate:!t,params:(query:INFO,type:phrase),type:phrase,value:INFO),query:(match:(level:(query:INFO,type:phrase))))),index:'93e631f0-245f-11e8-a779-9d01de8d7a71',interval:auto,query:(language:lucene,query:''),sort:!('@timestamp',desc))
and you can see a heatmap/dashboard here:
https://kibana.electricitymap.org/app/kibana#/visualize/edit/ad39b220-2460-11e8-a779-9d01de8d7a71?_g=(refreshInterval:('$$hashKey':'object:6765',display:'10%20seconds',pause:!f,section:1,value:10000),time:(from:now-15m,mode:quick,to:now))&_a=(filters:!(),linked:!t,query:(language:lucene,query:''),uiState:(vis:(defaultColors:('0%20-%201':'rgb(255,245,240)','1%20-%202':'rgb(252,187,161)','2%20-%203':'rgb(251,106,74)','3%20-%203':'rgb(203,24,29)'))),vis:(aggs:!((enabled:!t,id:'1',params:(),schema:metric,type:count),(enabled:!t,id:'2',params:(customInterval:'2h',extended_bounds:(),field:'@timestamp',interval:h,min_doc_count:1),schema:segment,type:date_histogram),(enabled:!t,id:'3',params:(field:extra.path.keyword,missingBucket:!t,missingBucketLabel:Missing,order:desc,orderBy:'1',otherBucket:!f,otherBucketLabel:Other,size:50),schema:group,type:terms)),params:(addLegend:!t,addTooltip:!t,colorSchema:Reds,colorsNumber:4,colorsRange:!(),enableHover:!f,invertColors:!f,legendPosition:right,percentageMode:!f,setColorRange:!f,times:!(),type:heatmap,valueAxes:!((id:ValueAxis-1,labels:(color:%23555,rotate:0,show:!t),scale:(defaultYExtents:!f,type:linear),show:!f,type:value))),title:'Warning%20and%20errors%20heatmap',type:heatmap))
For now it shows grouped by filename, but it really should be grouped by zone name/exchange name.
corradio
on 10 Mar 2018
Great work guys!
systemcatch
on 10 Mar 2018
It could use some refinement and adding to the readme but the basic structure is there to expand upon.
systemcatch
on 15 Mar 2018
I have been thinking about a dashboard because parsers unfortunately keep on getting lost. (Currently: Costa Rica, Western Australia, Russia...)
Oli's second link doesn't seem to work anymore, is it possible to recreate?
It would be great to set up a visual red/yellow/green list of regions that have had data in the past but are down today (yellow) or for a couple of days now (red).
Perhaps it is feasible to extract this data with some clever Kibana/Lucene queries?
 jarek
on 30 Sep 2019
jarek
on 30 Sep 2019
Kibana has a feature where we can make a dashboard. I fiddled around with it a long time but haven't got time to do more lately.
corradio
on 30 Sep 2019
Closing due to inactivity
cc @Kongkille for inspiration
corradio
on 22 Dec 2020
Related issues
corradio
·
4Comments
corradio
·
4Comments
 StefanAO
·
4Comments
StefanAO
·
4Comments
 pascalheraud
·
4Comments
systemcatch
·
3Comments
pascalheraud
·
4Comments
systemcatch
·
3Comments
Most helpful comment
@maxbellec and I finished pushing it.
You can see a log history of warnings and errors here:
https://kibana.electricitymap.org/app/kibana#/discover/1710fdd0-2460-11e8-a779-9d01de8d7a71?_g=(refreshInterval:('$$hashKey':'object:6765',display:'10%20seconds',pause:!f,section:1,value:10000),time:(from:now-15m,mode:quick,to:now))&_a=(columns:!(level,extra.path,message),filters:!(('$state':(store:appState),exists:(field:level),meta:(alias:!n,disabled:!f,index:'93e631f0-245f-11e8-a779-9d01de8d7a71',key:level,negate:!f,type:exists,value:exists)),('$state':(store:appState),meta:(alias:!n,disabled:!f,index:'93e631f0-245f-11e8-a779-9d01de8d7a71',key:level,negate:!t,params:(query:INFO,type:phrase),type:phrase,value:INFO),query:(match:(level:(query:INFO,type:phrase))))),index:'93e631f0-245f-11e8-a779-9d01de8d7a71',interval:auto,query:(language:lucene,query:''),sort:!('@timestamp',desc))
and you can see a heatmap/dashboard here:
https://kibana.electricitymap.org/app/kibana#/visualize/edit/ad39b220-2460-11e8-a779-9d01de8d7a71?_g=(refreshInterval:('$$hashKey':'object:6765',display:'10%20seconds',pause:!f,section:1,value:10000),time:(from:now-15m,mode:quick,to:now))&_a=(filters:!(),linked:!t,query:(language:lucene,query:''),uiState:(vis:(defaultColors:('0%20-%201':'rgb(255,245,240)','1%20-%202':'rgb(252,187,161)','2%20-%203':'rgb(251,106,74)','3%20-%203':'rgb(203,24,29)'))),vis:(aggs:!((enabled:!t,id:'1',params:(),schema:metric,type:count),(enabled:!t,id:'2',params:(customInterval:'2h',extended_bounds:(),field:'@timestamp',interval:h,min_doc_count:1),schema:segment,type:date_histogram),(enabled:!t,id:'3',params:(field:extra.path.keyword,missingBucket:!t,missingBucketLabel:Missing,order:desc,orderBy:'1',otherBucket:!f,otherBucketLabel:Other,size:50),schema:group,type:terms)),params:(addLegend:!t,addTooltip:!t,colorSchema:Reds,colorsNumber:4,colorsRange:!(),enableHover:!f,invertColors:!f,legendPosition:right,percentageMode:!f,setColorRange:!f,times:!(),type:heatmap,valueAxes:!((id:ValueAxis-1,labels:(color:%23555,rotate:0,show:!t),scale:(defaultYExtents:!f,type:linear),show:!f,type:value))),title:'Warning%20and%20errors%20heatmap',type:heatmap))
For now it shows grouped by filename, but it really should be grouped by zone name/exchange name.