- Hyperthreading state through
Proc->Features.HTT_enabled=1can be set during the final loop. Right afterkthread_stop() - Disabled cpus by Kernel should be accounted by the topology algorithm. It appears that a core deactivation from Linux or from the BIOS differs , isn't ?
 cyring
All 54 comments
Fixed
cyring
on 13 Jul 2015
[AMD] Introducing the Core Complex ID.


_Remarks_:
- Executed in a virtualized QEMU/Epyc processor for the topology testing purpose.
Thus some data are not relevant, such as the BCLK. - The blue CPUs have been voluntary disabled.
- QEMU does not virtualize SMT, thus no Thread ID detected.
Two bare metal runs, respectively SMT ON then OFF in BIOS will complete the CCX test. Your screenshot results are welcomed
cyring
on 28 Jul 2019
As requested in https://github.com/cyring/CoreFreq/issues/54#issuecomment-515750681 Very cool to be seeing CCX info!
SMT OFF

SMT ON

 adatum
on 28 Jul 2019
adatum
on 28 Jul 2019
As requested in #54 (comment) Very cool to be seeing CCX info!
You're welcome. Glad to see it works.
Hope others will push TR and Epyc results.
cyring
on 28 Jul 2019
Confirmed to work on Zen 2 :+1:

 logan2611
on 29 Jul 2019
logan2611
on 29 Jul 2019
Confirmed to work on Zen 2
Super, thanks a lot.
Meanwhile I have to check why L3 Way equals 9 !
Edit: can you post the CPUID output of CPU number 0 using command corefreq-cli -u
cyring
on 29 Jul 2019
For all AMD: the latest commit is fixing the number of L2 , L3 Cache Way Associativity.
Can you plz update and screenshot the topology again ?
cyring
on 29 Jul 2019

adatum
on 29 Jul 2019
@adatum : apparently it matches the cache specs
cyring
on 29 Jul 2019
Should we divide the L3 cache size per CCX count ?
cyring
on 29 Jul 2019
Should we divide the L3 cache size per CCX count ?
Nothing to see with CCX; in fact the CPUID_Fn80000006_EDX [L3 Cache Identifiers] in Zen PPR says about the L3 cache size that for any queried value in range FFFh-0001h, the size equals (<Value> *0.5) MB
cyring
on 29 Jul 2019
L3 Size fix committed for your test
cyring
on 29 Jul 2019
The Topology window now requires scrolling. Other than L3 the values are the same as before.

adatum
on 29 Jul 2019
The Topology window now requires scrolling. Other than L3 the values are the same as before.
Changes happened in Daemon code not Cli. L3 cache size has been fixed.
- Perhaps moving cursor around L3 column will reveal cell sizing issue ?
- Immediately after opening the window, does the cursor still land onto cell
00: BSP 0? - Do you have the same behavior if using XTerm ?
cyring
on 29 Jul 2019
1. Perhaps moving cursor around L3 column will reveal cell sizing issue ?Do you mean to the right/left? The scrolling is only vertical, nothing out of the window horizontally.
2. Immediately after opening the window, does the cursor still land onto cell00: BSP 0?
Yes the cursor defaults to that cell when the Topology window is opened.
3. Do you have the same behavior if using XTerm ?
Yes, same with XTerm:
 adatum
on 29 Jul 2019
adatum
on 29 Jul 2019
The same if you resize the Terminal to a bigger dimension; like 100 lines ?
cyring
on 29 Jul 2019
Yes, still same. The Topology window size does not change based on the terminal window size.
adatum
on 29 Jul 2019
It's hard to debug when UI has not been impacted.
I'm doing now an QEMU/EPYC with 16 x CPU test.
cyring
on 29 Jul 2019
Although it is not your 2700X, QEMU just virtualises EPYC, the window behaves as expected in a large console.
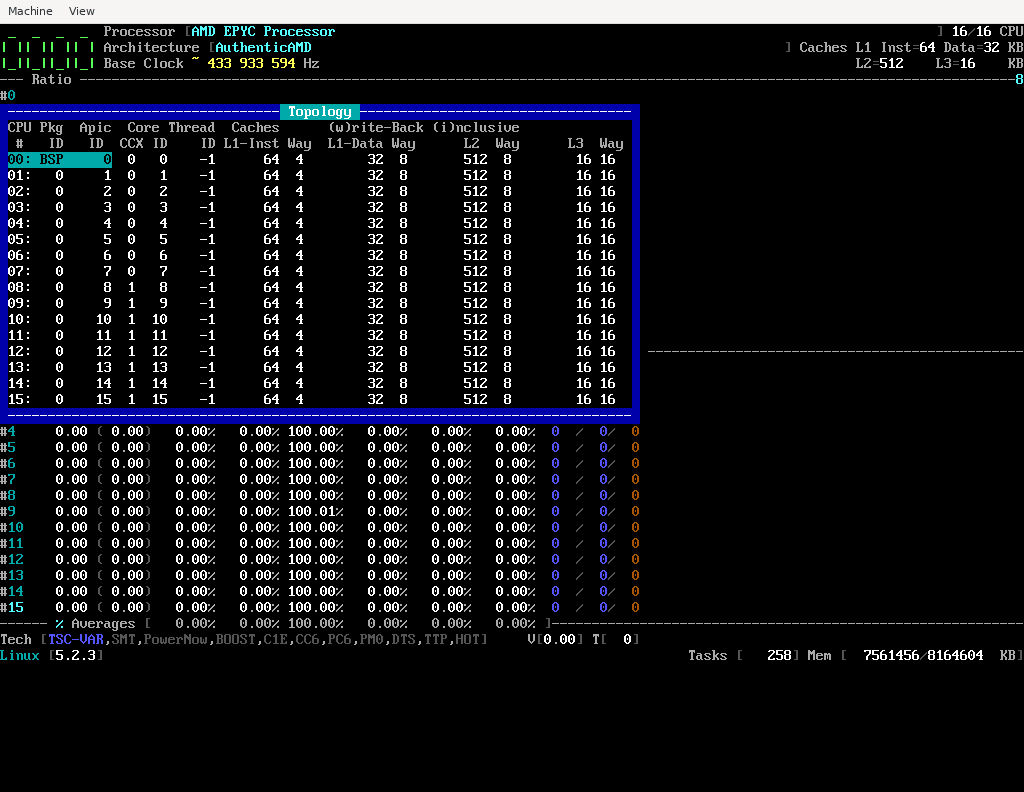
- Is the code fully rebuild ?
make clean all
cyring
on 29 Jul 2019
I just did make clean all and make again. Topology window still requires scrolling to see past CPU # 13.
Aside, maybe this output from lstopo is helpful for confirming Topology in general.
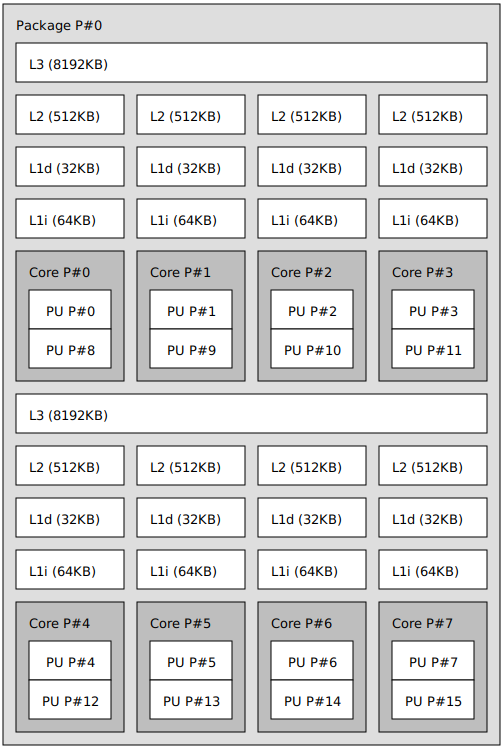
adatum
on 29 Jul 2019
- Debug build
$ make CC='cc -g' clean all
- Driver & Daemon terminal
# insmod corefreqk.ko
# corefreqd -d
- Client Terminal
_The UI will be run with gdb. We put a break-point right after the window creation_
$ gdb corefreq-cli

(gdb) l 3802

3802            Window *wTopology = CreateWindow(wLayer, id,
3803                                            6, CUMIN(2 + Shm->Proc.CPU.Count,
3804                                              (draw.Size.height-TOP_HEADER_ROW-5)),
3805                                            1, TOP_HEADER_ROW + 3);
3806                    wTopology->matrix.select.row = 2;

(gdb) br 3806
Breakpoint 1 at 0x2e551: file corefreq-cli.c, line 3806.

(gdb) r
- In the UI press key
m
_you are back in debugger and I want to read the content of thewTopologystructure_
(gdb) p *wTopology
$2 = {layer = 0x5555555c6460, id = 109, prev = 0x0, next = 0x0, hook = {
    Print = 0x0, key = {Enter = 0x0, Escape = 0x0, Left = 0x0, Right = 0x0,
      Down = 0x0, Up = 0x0, Home = 0x0, End = 0x0, PgUp = 0x0, PgDw = 0x0,
      WinLeft = 0x0, WinRight = 0x0, WinDown = 0x0, WinUp = 0x0}, color = {{
        select = {value = 128 '\200', {fg = 0 '\000', un = 0 '\000',
            bg = 0 '\000', bf = 1 '\001'}}, border = {value = 192 '\300', {
            fg = 0 '\000', un = 0 '\000', bg = 4 '\004', bf = 1 '\001'}},
        title = {value = 192 '\300', {fg = 0 '\000', un = 0 '\000',
            bg = 4 '\004', bf = 1 '\001'}}}, {select = {value = 96 '`', {
            fg = 0 '\000', un = 0 '\000', bg = 6 '\006', bf = 0 '\000'}},
        border = {value = 199 '\307', {fg = 7 '\a', un = 0 '\000',
            bg = 4 '\004', bf = 1 '\001'}}, title = {value = 231 '\347', {
            fg = 7 '\a', un = 0 '\000', bg = 6 '\006', bf = 1 '\001'}}}},
    title = 0x0}, matrix = {size = {wth = 6, hth = 14}, origin = {col = 1,
      row = 6}, select = {col = 0, row = 0}, scroll = {horz = 0, vert = 0}},
  grid = 0x0, dim = 0, lazyComp = {rowLen = 0, titleLen = 0, bottomRow = 0}}
Thanks for the detailed instructions.
(gdb) p *wTopology
$1 = {layer = 0x465470, id = 109, prev = 0x0, next = 0x0, hook = {Print = 0x0,
    key = {Enter = 0x0, Escape = 0x0, Left = 0x0, Right = 0x0, Down = 0x0,
      Up = 0x0, Home = 0x0, End = 0x0, PgUp = 0x0, PgDw = 0x0, WinLeft = 0x0,
      WinRight = 0x0, WinDown = 0x0, WinUp = 0x0}, color = {{select = {
          value = 128 '\200', {fg = 0 '\000', un = 0 '\000', bg = 0 '\000',
            bf = 1 '\001'}}, border = {value = 192 '\300', {fg = 0 '\000',
            un = 0 '\000', bg = 4 '\004', bf = 1 '\001'}}, title = {
          value = 192 '\300', {fg = 0 '\000', un = 0 '\000', bg = 4 '\004',
            bf = 1 '\001'}}}, {select = {value = 96 '`', {fg = 0 '\000',
            un = 0 '\000', bg = 6 '\006', bf = 0 '\000'}}, border = {
          value = 199 '\307', {fg = 7 '\a', un = 0 '\000', bg = 4 '\004',
            bf = 1 '\001'}}, title = {value = 231 '\347', {fg = 7 '\a',
            un = 0 '\000', bg = 6 '\006', bf = 1 '\001'}}}}, title = 0x0},
  matrix = {size = {wth = 6, hth = 18}, origin = {col = 1, row = 6}, select = {
      col = 0, row = 0}, scroll = {horz = 0, vert = 0}}, grid = 0x0, dim = 0,
  lazyComp = {rowLen = 0, titleLen = 0, bottomRow = 0}}
- in the
wTopologystructure:
matrix = {size = {wth = 6, hth = 18}, origin = {col = 1, row = 6}, select = {
- we read the window inner height
matrix.size.hthequaled to value 18
2 lines (for the topology header) + 16 lines (for the 16 CPUs)
cyring
on 29 Jul 2019
- same breakpoint, what do you read from the
drawstructure ?
3806                    wTopology->matrix.select.row = 2;
(gdb) p draw
$6 = {Flag = {layout = 0, clear = 0, height = 1, width = 1, daemon = 0,
    taskVal = 0, avgOrPC = 0, clkOrLd = 0, fahrCels = 0, _padding = 0},
  View = V_FREQ, Disposal = D_MAINVIEW, Size = {width = 80, height = 32},
  Area = {MinHeight = 10, MaxRows = 12, LoadWidth = 76}, iClock = 3,
  cpuScroll = 0, Unit = {Memory = 0}, SmbIndex = SMB_BOARD_NAME}
(gdb) p draw
$2 = {Flag = {layout = 0, clear = 0, height = 1, width = 1, daemon = 0,
    taskVal = 0, avgOrPC = 0, clkOrLd = 0, fahrCels = 0, _padding = 0},
  View = V_FREQ, Disposal = D_MAINVIEW, Size = {width = 80, height = 41},
  Area = {MinHeight = 10, MaxRows = 16, LoadWidth = 76}, iClock = 3,
  cpuScroll = 0, Unit = {Memory = 0}, SmbIndex = SMB_BOARD_NAME}
- we read a max Terminal height of 41 lines
draw.Size.height = 41
TOP_HEADER_ROW is defined as 3
https://github.com/cyring/CoreFreq/blob/0100bb3dcec09623dfa4d7450b258c9e12ff5f41/corefreq-ui.h#L7the minimum height, to compare the requested window height with, is 33 (41 - 3 - 5) :
3804 (draw.Size.height-TOP_HEADER_ROW-5)),
- the requested window height being 18, we have enough room to fully show the Topology w/o scrolling.
_I'm stuck_
cyring
on 29 Jul 2019
- Just to be sure that it may come from the last code changes, can you please rollback to previous commit:
$ make clean
$ git log
commit 0100bb3dcec09623dfa4d7450b258c9e12ff5f41 (HEAD -> master, origin/master)
Author: CyrIng <[email protected]>
Date:   Mon Jul 29 12:03:34 2019 +0200

    [AMD][Zen] L3 Cache Size adjustment (issue #1)

commit 0abdf524e225e2cbabbfbff259e7fbc75ecd0dfc
Author: CyrIng <[email protected]>
Date:   Mon Jul 29 10:48:30 2019 +0200

    [AMD] Fixing L2 L3 Cache Way Associativity (#1)//[Zen] Package Power code review

commit 8deb045098de1c5db06fc3c7043bbdbc06ff4adb
Author: CyrIng <[email protected]>
Date:   Sun Jul 28 12:06:41 2019 +0200

    [AMD] Introducing the Core Complex ID.
...

$ git checkout 0abdf524e225e2cbabbfbff259e7fbc75ecd0dfc

$ make
- Next rebuild; reload and test
- If the issue is still happening, rollback one more time to
8deb045098de1c5db06fc3c7043bbdbc06ff4adb
_remark: I'not sure how to rollback commits w/ git_
cyring
on 29 Jul 2019
With commit 0abdf524e225e2cbabbfbff259e7fbc75ecd0dfc the Topology window does not have a scroll bar -- all 16 CPUs are shown at once, exactly like the screenshot in https://github.com/cyring/CoreFreq/issues/1#issuecomment-515908613
For reference, the debug values for this commit:
(gdb) p *wTopology
$1 = {layer = 0x465470, id = 109, prev = 0x0, next = 0x0, hook = {Print = 0x0,
    key = {Enter = 0x0, Escape = 0x0, Left = 0x0, Right = 0x0, Down = 0x0,
      Up = 0x0, Home = 0x0, End = 0x0, PgUp = 0x0, PgDw = 0x0, WinLeft = 0x0,
      WinRight = 0x0, WinDown = 0x0, WinUp = 0x0}, color = {{select = {
          value = 128 '\200', {fg = 0 '\000', un = 0 '\000', bg = 0 '\000',
            bf = 1 '\001'}}, border = {value = 192 '\300', {fg = 0 '\000',
            un = 0 '\000', bg = 4 '\004', bf = 1 '\001'}}, title = {
          value = 192 '\300', {fg = 0 '\000', un = 0 '\000', bg = 4 '\004',
            bf = 1 '\001'}}}, {select = {value = 96 '`', {fg = 0 '\000',
            un = 0 '\000', bg = 6 '\006', bf = 0 '\000'}}, border = {
          value = 199 '\307', {fg = 7 '\a', un = 0 '\000', bg = 4 '\004',
            bf = 1 '\001'}}, title = {value = 231 '\347', {fg = 7 '\a',
            un = 0 '\000', bg = 6 '\006', bf = 1 '\001'}}}}, title = 0x0},
  matrix = {size = {wth = 6, hth = 18}, origin = {col = 1, row = 6}, select = {
      col = 0, row = 0}, scroll = {horz = 0, vert = 0}}, grid = 0x0, dim = 0,
  lazyComp = {rowLen = 0, titleLen = 0, bottomRow = 0}}
(gdb) p draw
$2 = {Flag = {layout = 0, clear = 0, height = 1, width = 1, daemon = 0,
    taskVal = 0, avgOrPC = 0, clkOrLd = 0, fahrCels = 0, _padding = 0},
  View = V_FREQ, Disposal = D_MAINVIEW, Size = {width = 80, height = 41},
  Area = {MinHeight = 10, MaxRows = 16, LoadWidth = 76}, iClock = 2,
  cpuScroll = 0, Unit = {Memory = 0}, SmbIndex = SMB_BOARD_NAME}
Damn, just changing the L3 impacts the UI !
cyring
on 29 Jul 2019
- The previous commits have also optimized the conditions to compute the all Cores Energy.
Can you pull the latest version and show the "Voltage & Power" view - Can you also check for any seg fault in sys log.
- If you are familiar with Valgrind, you can run the Daemon & Client with it to check for any memory corruption.
$ make CC='cc -g' clean all
# valgrind -v corefreqd -d
$ valgrind -v corefreq-cli
- open the Topology window, then press [Ctrl]+[x] to quit the UI
- next, [Ctrl]+[c] in Daemon
- Valgrind will output any kind of error
==1639== HEAP SUMMARY:
==1639==     in use at exit: 0 bytes in 0 blocks
==1639==   total heap usage: 53 allocs, 53 frees, 792,675 bytes allocated
==1639==
==1639== All heap blocks were freed -- no leaks are possible
==1639==
==1639== ERROR SUMMARY: 0 errors from 0 contexts (suppressed: 0 from 0)
==1639== ERROR SUMMARY: 0 errors from 0 contexts (suppressed: 0 from 0)
Now back on commit 0100bb3dcec09623dfa4d7450b258c9e12ff5f41... and I can't reproduce the scrollbar issue anymore!
$ git reflog
0100bb3 (HEAD -> master, origin/master, origin/HEAD) HEAD@{0}: checkout: moving from 0abdf524e225e2cbabbfbff259e7fbc75ecd0dfc to master
0abdf52 HEAD@{1}: checkout: moving from master to 0abdf524e225e2cbabbfbff259e7fbc75ecd0dfc
0100bb3 (HEAD -> master, origin/master, origin/HEAD) HEAD@{2}: pull: Fast-forward
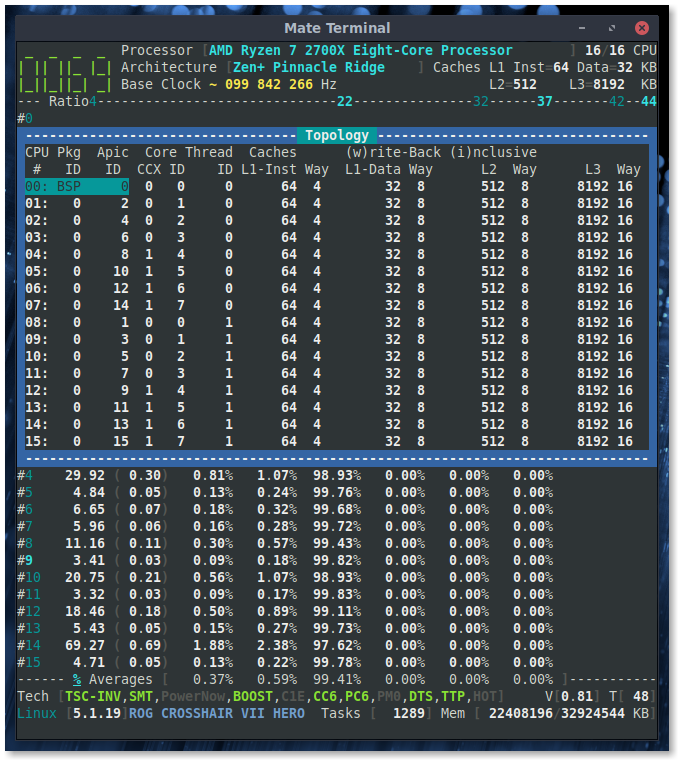
I'm not familiar with valgrind but following your steps it showed 0 errors for both the Daemon and UI. No seg faults in journalctl either.
Daemon:
==20497== HEAP SUMMARY:
==20497==     in use at exit: 0 bytes in 0 blocks
==20497==   total heap usage: 21 allocs, 21 frees, 6,172 bytes allocated
==20497==
==20497== All heap blocks were freed -- no leaks are possible
==20497==
==20497== ERROR SUMMARY: 0 errors from 0 contexts (suppressed: 0 from 0)
==20496==
==20496== HEAP SUMMARY:
==20496==     in use at exit: 0 bytes in 0 blocks
==20496==   total heap usage: 82 allocs, 82 frees, 1,279,444 bytes allocated
==20496==
==20496== All heap blocks were freed -- no leaks are possible
==20496==
==20496== ERROR SUMMARY: 0 errors from 0 contexts (suppressed: 0 from 0)
UI:
==20642== HEAP SUMMARY:
==20642==     in use at exit: 0 bytes in 0 blocks
==20642==   total heap usage: 491 allocs, 491 frees, 1,081,853 bytes allocated
==20642==
==20642== All heap blocks were freed -- no leaks are possible
==20642==
==20642== ERROR SUMMARY: 0 errors from 0 contexts (suppressed: 0 from 0)
Very confused but issue resolved? for now?
In any case, here is the "Power & Voltage" View:
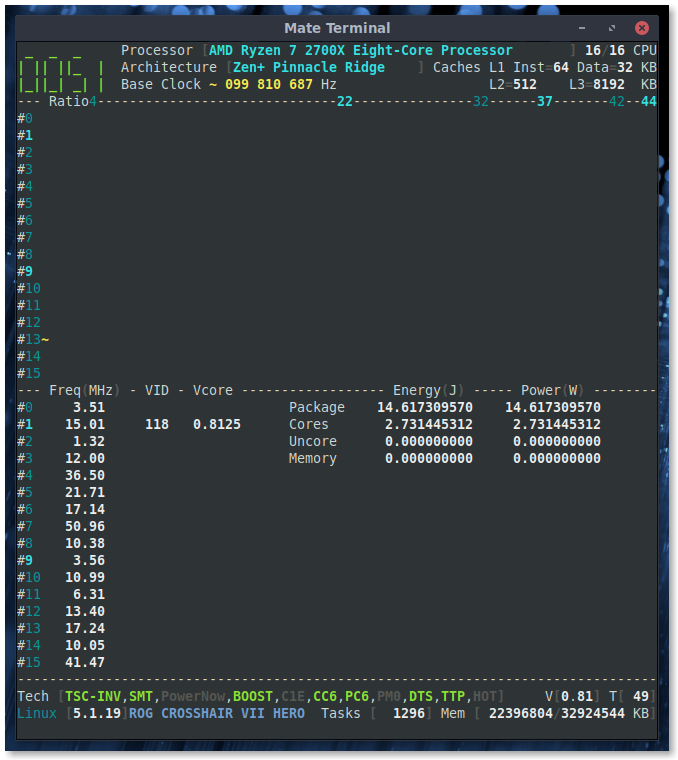
With the system mostly at idle the Package values range from ~10-14, and Cores from ~0.4-3.
adatum
on 30 Jul 2019
So glad, it works as expected.
That issue was not understandable.
It could have been a mix of source code in your working directory but it should have not build or start cleanly.
Future releases, I will add a version check inside the shared memories to be sure that driver, daemon and client are on line with the data model.
Thanks for the great help you brought to resolve this problem.
cyring
on 30 Jul 2019
Future releases, I will add a version check inside the shared memories to be sure that driver, daemon and client are on line with the data model.
Done !
cyring
on 30 Jul 2019
Is there anything you'd like me to check?
I did:
make cleangit pullmakesudo insmod corefreqk.kosudo ./corefreqd./corefreq-cli
And the scrollbar was back in Topology window.
So then (after quitting the daemon and sudo rmmod corefreqk)
make cleanmake CC='cc -g' clean all
And after steps 4-6 above, there is no more scrollbar in Topology.
For good measure, I repeated the process with make clean and just make again and still no more scrollbar.
adatum
on 30 Jul 2019
Thanks for trying to solve this "unexpected" scrolling. We'll leave for a while, the solution may jump to my head, one day...
I have noticed that 3700X does not stress the Turbo of a single Core: can you provide such tests in issue #97
cyring
on 30 Jul 2019
Software Optimization Guide for AMD Family 17h Processors
2.6.1 L1 Instruction Cache
The AMD Family 17h processor contains a 64-Kbyte, 4-way set associative L1 instruction cache.
Cache line size is 64 bytes; 32 bytes are fetched in a cycle. ...
2.6.2 L1 Data Cache
The AMD Family 17h processor contains a 32-Kbyte, 8-way set associative L1 data cache. This is a write-back cache ...
2.6.3 L2 Cache
The AMD Family 17h processor implements a unified 8-way set associative write-back L2 cache per core. This on-die L2 cache is inclusive of the L1 caches in the core. The L2 cache size is 512 Kbytes ...
2.6.4 L3 Cache
The AMD Family 17h processor implements a 4 MB or 8 MB L3 cache (depending on SOC
configuration) that is 16-way set associative and shared by four cores inside a CPU complex. The L3 is a write-back cache populated by L2 victims. ...
cyring
on 30 Jul 2019
Last version aims to print the Cache Inclusiveness & Write-Back capabilities.
Can you please try it and screenshot the Topology.
cyring
on 30 Jul 2019
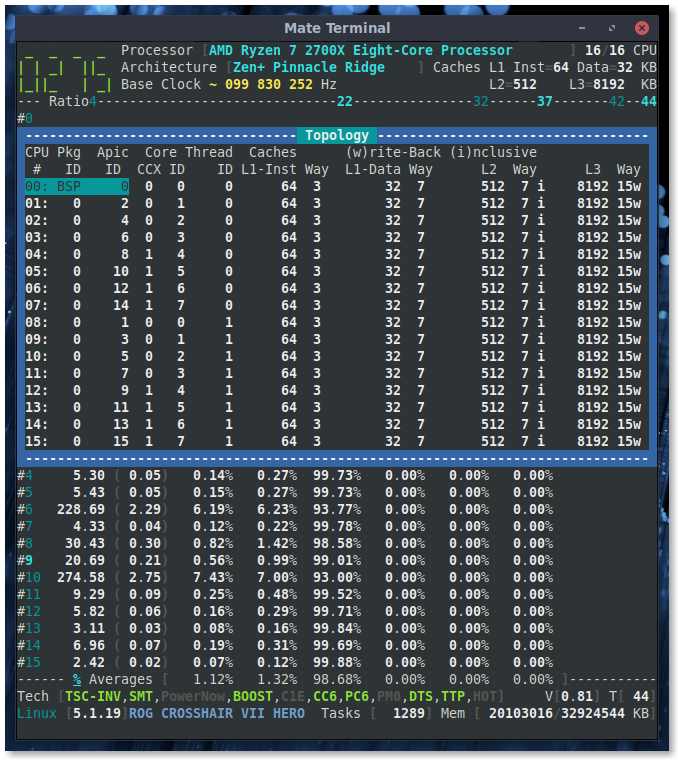
adatum
on 30 Jul 2019
I have messed up with the Cache Topology, please try the latest commit
cyring
on 30 Jul 2019
Looks better.
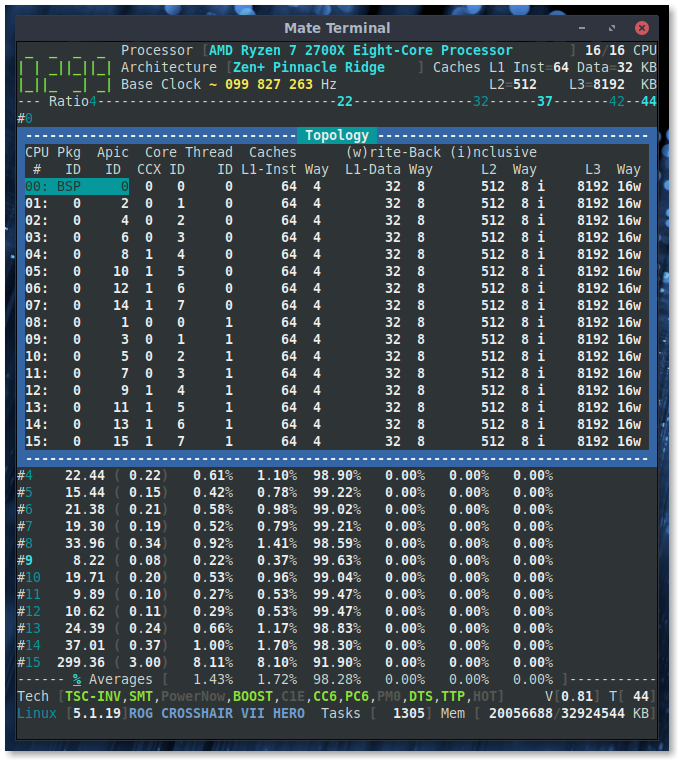
adatum
on 30 Jul 2019
Also works better with 3700X but we have 9 way for L3.
And 9 is a reserved value in AMD specs.
Let's hope a microcode update will fix it.
cyring
on 30 Jul 2019
ToDo:
- for consistency with Intel queries, driver has to read the AMD caches size in bytes but let the Client convertor function reports values with the user prefered unit.
- referring to Zen specs, "write-back" is not reported by CPUID for L1D and L2
cyring
on 3 Aug 2019
Hey !
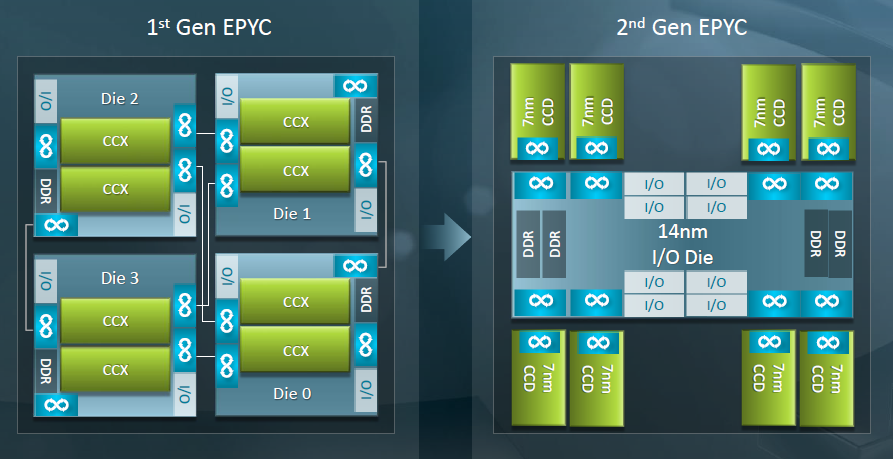
If you have a Rome processor, please let me work on its topology, first 😎
cyring
on 8 Aug 2019
Node ID to provide with Zen architecture (probably previous AMD architectures)
ApicId Enumeration Requirements
Note: Family 17h processors do not require contiguous ApicId assignments.
Operating systems are expected to use Core::X86::Cpuid::SizeId[ApicIdSize], the number of least
significant bits in the Initial APIC ID that indicate core ID within a processor, in constructing per-core CPUID
masks. Core::X86::Cpuid::SizeId[ApicIdSize] determines the maximum number of cores (MNC) that the
processor could theoretically support, not the actual number of cores that are actually implemented or enabled on
the processor, as indicated by Core::X86::Cpuid::SizeId[NC].
Each Core::X86::Apic::ApicId[ApicId] register is preset as follows:
• ApicId[6] = Socket ID.
• ApicId[5:4] = Node ID.
• ApicId[3] = Logical CCX L3 complex ID
• ApicId[2:0]= (SMT) ? {LogicalCoreID[1:0],ThreadId} : {1'b0,LogicalCoreID[1:0]}.
What a chock ! Using a Ryzen 2700, temperature is going from 90 down to 47°C just by disabling all Cores belonging to the same CCX id.
90
47
Do others models cross the same issue ?
Can it be a bug in the driver ?
But, there's only one thermal sensor, available through the SMU, thus shared among all Cores...
cyring
on 13 Aug 2019
Unfortunately this reveals a bug in the driver.
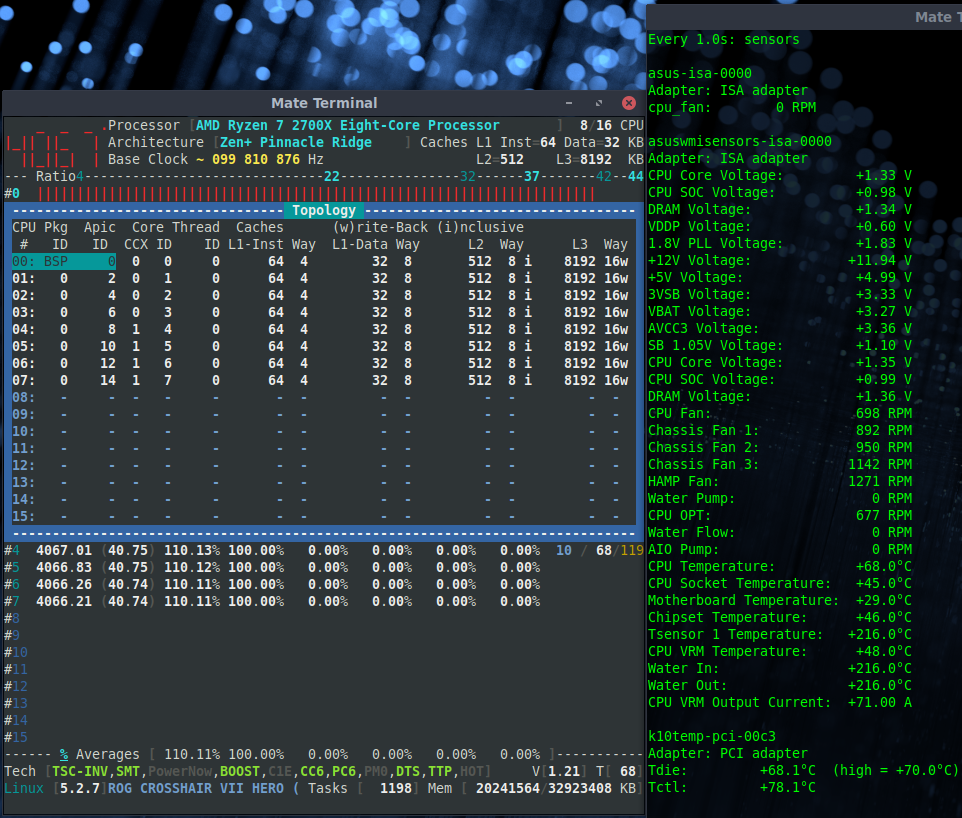
The temperatures don't match k10temp or asus-wmi-sensors:
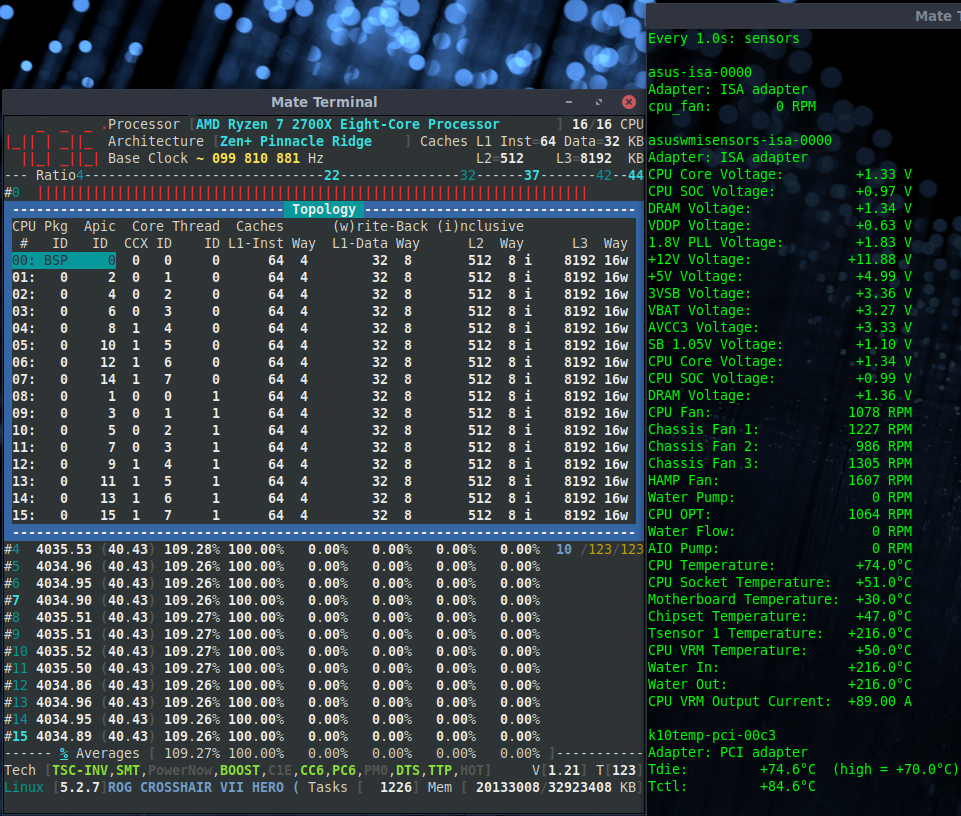
Disabling all the cores on one CCX changes Corefreq's temperature reading, which now matches other sources, but the actual temperature is not changed.
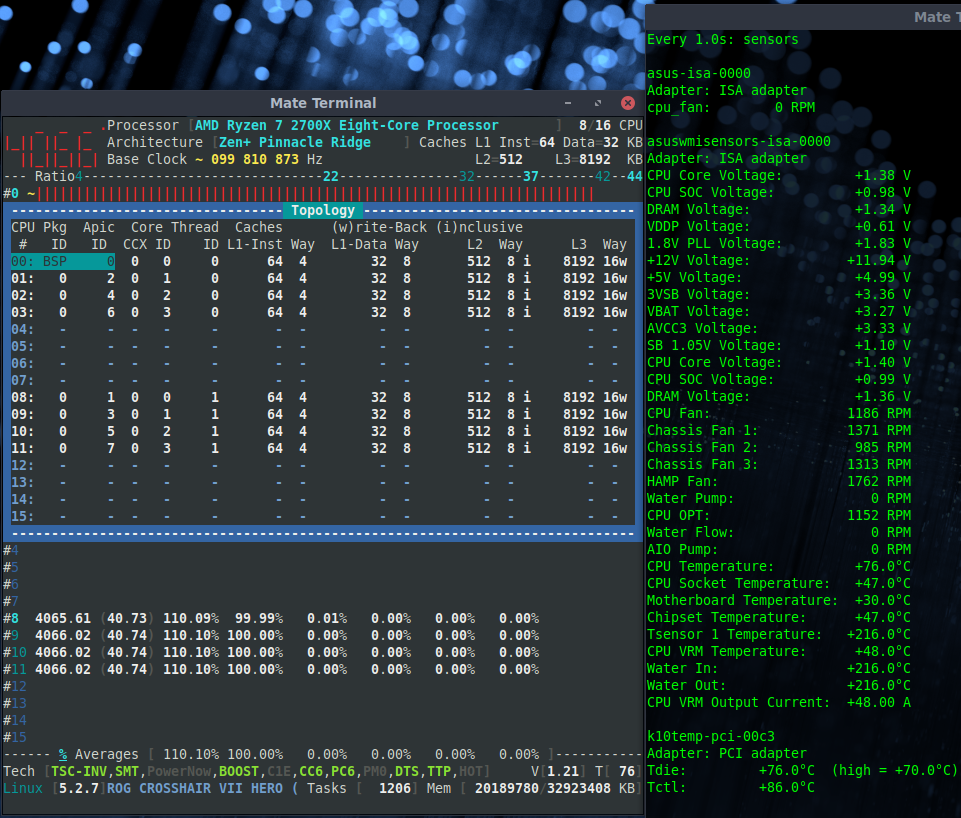
This configuration is similar to disabling SMT? It does drop the temperatures.
adatum
on 13 Aug 2019
Help me to understand your results: the usual case, SMT and all CPU enabled is now giving a wrong temperature of 123°C as seen in first screenshot ?
So we have a regression isn't it ?
cyring
on 14 Aug 2019
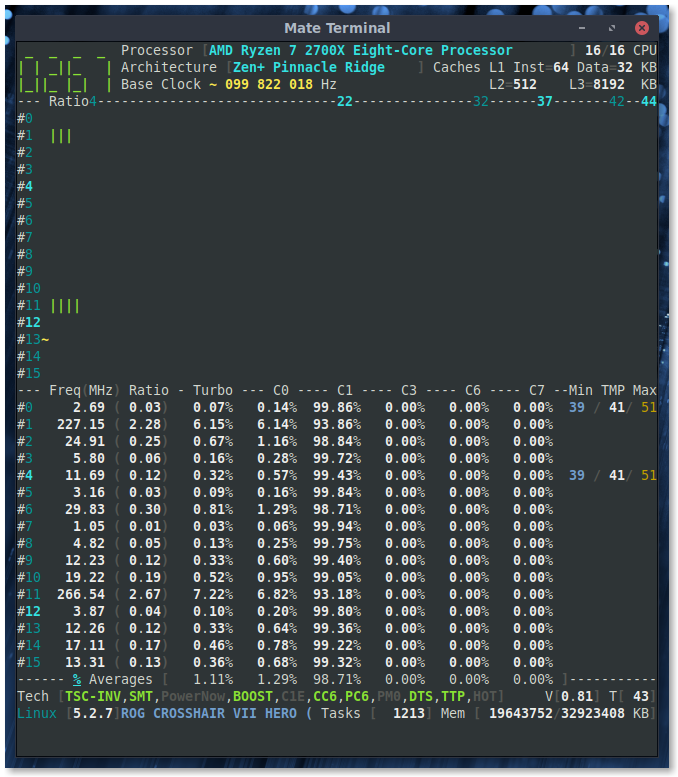
An inconsistent regression, yes. I just re-tested and on first launch (usual case, SMT, and all cores enabled), this time the temperature was correct. I think the anomalous readings can be triggered by disabling/enabling core # 4 :
Initial launch with correct temperatures:
Core # 4 disabled, wrong temperature reading (note: still idle, no stress):
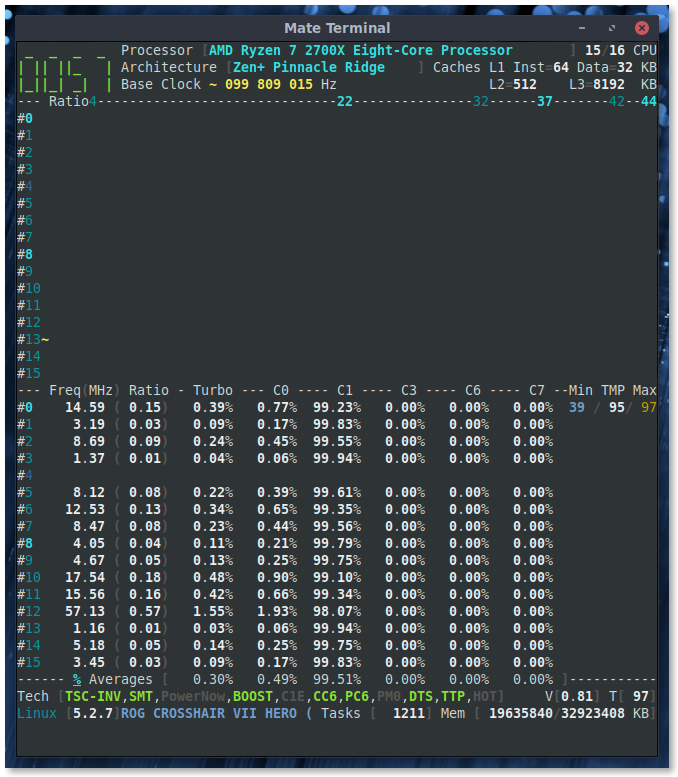
Core # 4 re-enabled, inconsistent temperature reports on lines for core # 0 and core # 4:
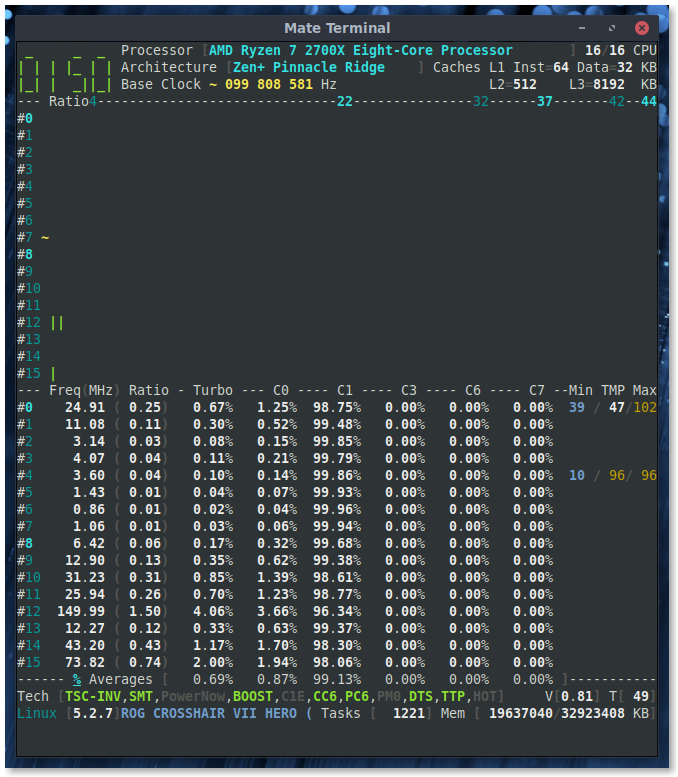
Something about enabling/disabling cores, particularly core # 4, causes toggling in the anomalous temperature reporting.
The temperatures are sometimes correct and sometimes incorrect at the initial launch of CoreFreq.
adatum
on 14 Aug 2019
Was this run with the additional lines of code I asked you test less than 2 weeks ago ?
If true, sorry I should tell you to restore code to original.
cyring
on 14 Aug 2019
Yes, it was with those additional lines of code.
I went back to commit e21a6d5480fff6a095edec7b6ea01310ad25c0e9. Enabling/disabling cores eventually runs into the anomalous temperature readings. The actual temp was ~70C:
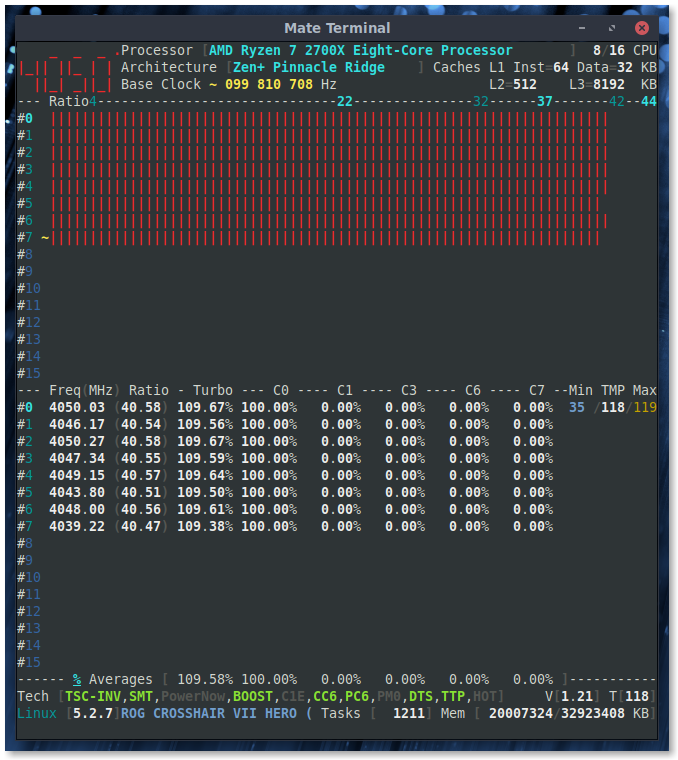
adatum
on 14 Aug 2019
Thanks. So I have to debug for inconsistent readings when SMT Cores have been disabled/enabled.
Be also aware that k10temp and CoreFreq have no common locking over the SMU. Thus, you won't run them simultaneously.
cyring
on 14 Aug 2019
Transferred to the roadmap #169
cyring
on 18 Mar 2020
Topology needs refactoring:
- It's hard to read.
Better show the sum for all Cores, especially in the UI header
EDIT: Looking at code, it may be _hazardous_ to compute the sum of L1 & sum of L2 in those cases: - Hyperthreading enabled or not
- Count of virtualized processors
- Disabled Core(s) excluded from the sum
A straight forward answer would be:
TotalSize_L{1,2} = ( CPU_Count x PerCpu_L{1,2}_Size ) / ( 1 + HyperThreading_State[0,1] )
However this formula will wrong in a virtualized platform.
- L3 size is wrong.
The 512 multiplier seems not to be applied among Zen generations, among Ryzen vs Threadripper
EDIT: Code is being fixed in the development branch.
cyring
on 26 May 2020
L3 size checked with some AMD Zen processors
cyring
on 28 May 2020
Related issues
 bkdwt
·
14Comments
bkdwt
·
14Comments
 h1z1
·
30Comments
h1z1
·
30Comments
 olejon
·
16Comments
olejon
·
16Comments
 LouisCyfer
·
5Comments
LouisCyfer
·
5Comments
 inglor
·
16Comments
inglor
·
16Comments