Chronograf: Error contacting source
Hello,
I set up a full TICK stack to monitor a Raspberry cluster, computers, and NAS on a single UI. Everything went fine but today I decide to set up TLS on InfluxDB. Once again everything went fine (I use self-signed certificates) except that Chronograf wouldn't connect to the "new" HTTPS source. I also enabled authentication and everything works fine on the multiples Telegraf agents and it also works on my Grafana but with Chronograf I have "Error contacting source" as you can see in the screenshot. Any idea ?
influx -ssl -unsafeSsl -host localhost works really fine too.
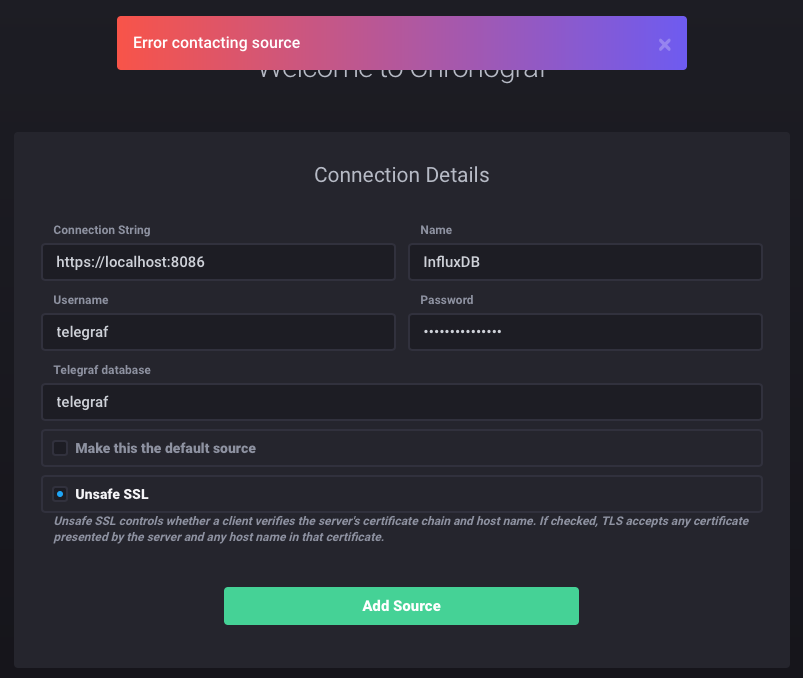
Versions :
InfluxDB - 1.2.4
Chronograf - 1.3.3.0 (also tried 1.3.3.2 since I saw so many releases those days)
Grafana - 4.3.2
Telegraf - 1.3.2
 Kuaaaly
All 30 comments
Hi there @Kuaaaly, thanks for writing in! I'll work on figuring out the issue right now.
 goller
on 22 Jun 2017
goller
on 22 Jun 2017
Hi @goller, I searched about 2 hours (I also set up a new instance on an other host because I thought that chronograf.db in /var/lib/chronograf/ might be confusing due to old HTTP source) but can't figure out the problem. Let me know if you find something or if I can help you in any way...
Kuaaaly
on 22 Jun 2017
@Kuaaaly Just tried it and it worked for me sadly... however, you aren't the first to write in about this issue.
Let's try a few things... first, would you paste in the chronograf server logs? I'm hoping we'll see something there.
Also, would you run this curl command?
curl -k https://localhost:8888/chronograf/v1/sources (that is the REST API location of all sources).
Mine looks like this in my test:
{
  "sources": [
    {
      "id": "1",
      "name": "Influx 1",
      "type": "influx",
      "username": "admin",
      "url": "https://localhost:8086",
      "insecureSkipVerify": true,
      "default": true,
      "telegraf": "telegraf",
      "links": {
        "self": "/chronograf/v1/sources/1",
        "kapacitors": "/chronograf/v1/sources/1/kapacitors",
        "proxy": "/chronograf/v1/sources/1/proxy",
        "queries": "/chronograf/v1/sources/1/queries",
        "write": "/chronograf/v1/sources/1/write",
        "permissions": "/chronograf/v1/sources/1/permissions",
        "users": "/chronograf/v1/sources/1/users",
        "databases": "/chronograf/v1/sources/1/dbs"
      }
    },
...
I already looked into the logs but didn't find interesting things. Here is a sample :
juin 22 16:01:16 Faucheur chronograf[3072]: time="2017-06-22T16:01:16+02:00" level=info msg="Response: OK" code=200 component=server remote_addr="192.168.X:36060" response_time="620.414µs"
juin 22 16:01:21 Faucheur chronograf[3072]: time="2017-06-22T16:01:21+02:00" level=info msg=Request component=server method=POST remote_addr="192.168.X:36060" url=/chronograf/v1/sources
juin 22 16:01:21 Faucheur chronograf[3072]: time="2017-06-22T16:01:21+02:00" level=error msg="Error message Error contacting source" component=server http_status =400
juin 22 16:01:21 Faucheur chronograf[3072]: time="2017-06-22T16:01:21+02:00" level=info msg="Response: Bad Request" code=400 component=server remote_addr="192.168.X:36060" response_time=92.730042ms
juin 22 16:01:22 Faucheur chronograf[3072]: time="2017-06-22T16:01:22+02:00" level=info msg=Request component=server method=GET remote_addr="192.168.X:36060" url=/8e5e447c5e2f7eec8b38221b3b20b056.woff2
juin 22 16:01:22 Faucheur chronograf[3072]: time="2017-06-22T16:01:22+02:00" level=info msg="Serving assets" component=server method=GET remote_addr="192.168.X:36060" url=/8e5e447c5e2f7eec8b38221b3b20b056.woff2
The only interesting thing we get is :
level=error msg="Error message Error contacting source" component=server http_status =400
Here is the result of the curl -k http://localhost:8888/chronograf/v1/sourcescommand :
{"sources":[]}
Notice that I changed http to https cause only InfluxDB is https. I don't need to secure Chronograf Web UI cause I always access it locally. Might it be the root cause ?
Another information / question : once I configured InfluxDB in https, I deleted the http://localhost:8086 source from Chronograf (to recreate it as https), but I had Chronograf connected to Kapacitor before that and since I delete de http source, Kapacitor continues working fine with Alerting (on Telegram). How is that possible ? Is InfluxDB pooling Kapacitor, meaning that Kapacitor don't need to dohttps request to InfluxDB ?
Kuaaaly
on 22 Jun 2017
Ok, I think it has to do with the deletion of the original source. It is weird there are not sources returned to you when you curl it. I'm going to try to reproduce this with your steps.
In the mean time, would you be able to run chronograf with --log-level=debug ? I'm hoping we get a bit more in the logs
goller
on 22 Jun 2017
Hi @goller, Ive just tried running Chronograf with the --log-level=debug flag but logs seem to be the same as before :
juin 23 10:23:01 Faucheur chronograf[16428]: time="2017-06-23T10:23:01+02:00" level=info msg="Response: OK" code=200 component=server remote_addr="192.168.1.18:36507" response_time="230.728µs"
juin 23 10:23:09 Faucheur chronograf[16428]: time="2017-06-23T10:23:09+02:00" level=info msg=Request component=server method=POST remote_addr="192.168.1.18:36507" url=/chronograf/v1/sources
juin 23 10:23:09 Faucheur chronograf[16428]: time="2017-06-23T10:23:09+02:00" level=error msg="Error message Error contacting source" component=server http_status =400
juin 23 10:23:09 Faucheur chronograf[16428]: time="2017-06-23T10:23:09+02:00" level=info msg="Response: Bad Request" code=400 component=server remote_addr="192.168.1.18:36507" response_time=98.737209ms
juin 23 10:23:11 Faucheur chronograf[16428]: time="2017-06-23T10:23:11+02:00" level=info msg=Request component=server method=GET remote_addr="192.168.1.18:36507" url=/chronograf/v1/me
juin 23 10:23:11 Faucheur chronograf[16428]: time="2017-06-23T10:23:11+02:00" level=info msg="Response: OK" code=200 component=server remote_addr="192.168.1.18:36507" response_time="232.03µs"
EDIT : I've juste tried to DROP chronograf DATABASE from InfluxDB but still getting the Error contacting source. I'll try to set InfluxDB back to non TLS and told you If I can connect with Chronograf again.
Kuaaaly
on 23 Jun 2017
I have the same problem, after deleting default (and only one ) source I can not add any source. It all started when I tried to add username and password to the source. I got an error (don't remember what kind) and since I deleted the source I can't add a new one.
 pepisp
on 28 Jul 2017
pepisp
on 28 Jul 2017
+1 exactly this problem with docker image from library/chronograf
there seems to be no preconfigured default source in the docker image and this bug prevents new sources from being added
 7oku
on 23 Aug 2017
7oku
on 23 Aug 2017
Not sure if it is the same, but I had the same error, and after accidentally adding a slash to the end of the server (connection string) it worked:
http://localhost:8086/
On mac, chronograf: stable 1.3.7.0
 mbence
on 5 Sep 2017
mbence
on 5 Sep 2017
I could reproduce this exact same behaviour setting up influxdb, telegraf and chronograf from scratch (no dbs, no prior data, no prior config, etc.) with self signed certs. Sadly, the only way out seems to be disabling https.
 riggs-
on 18 Sep 2017
riggs-
on 18 Sep 2017
Same issue as @riggs. Brand new install. Self-signed certs. Unsafe SSL checked. Getting Error contacting source with nothing in the logs except:
time="2017-09-19T22:17:51Z" level=error msg="Error message Error contacting source" component=server http_status =400
 geekdave
on 20 Sep 2017
geekdave
on 20 Sep 2017
@goller Thanks for your help in debugging this. Were you able to try and reproduce using a self-signed certificate? That seems to be the common thread amongst those of us who have this issue. Thanks!
geekdave
on 22 Sep 2017
I have the same issue and I haven't used https for any of the components in the TICK stack.
When I ran this - curl -k https://localhost:8888/chronograf/v1/sources , I got this reply -
{"sources":[]}
I am using InfluxDB v1.3.6 and Chronograf v1.3.9 on a Windows 7 64 bit machine.
 GrowingUpFisher
on 13 Oct 2017
GrowingUpFisher
on 13 Oct 2017
Hey there, I’m going to take a crack at figuring out this problem again. Do you mind sending me info about how you are generating your self-signed cert?
On Oct 13, 2017, at 3:18 PM, GrowingUpFisher notifications@github.com wrote:
I have the same issue and I haven't used https for any of the components in the TICK stack.
When I ran this - curl -k https://localhost:8888/chronograf/v1/sources , I got this reply -
{"sources":[]}I am using InfluxDB v1.3.6 and Chronograf v1.3.9 on a Windows 7 64 bit machine.
—
You are receiving this because you were mentioned.
Reply to this email directly, view it on GitHub, or mute the thread.
goller
on 15 Oct 2017
@goller
  openssl req -new -x509 -sha256 -days 99999 -nodes \
    -out /etc/ssl/certs/influxdb.crt -keyout /etc/ssl/private/influxdb.key \
    -subj "/C=US/ST=California/L=MountainView/O=DNAnexus/OU=SRE/CN=#{Hostname}"
Ok, I've been able to reproduce. I'm pretty sure I've found the problem in at least one place and may have found it in a few others.
goller
on 15 Oct 2017
OK! We figured it out and are working on a fix right now.
goller
on 16 Oct 2017
The fix is in! https://github.com/influxdata/chronograf/pull/2122
goller
on 18 Oct 2017
Does the fix now allow self-signed certificates with kapacitor along with influxdb?
 binary0111
on 20 Oct 2017
binary0111
on 20 Oct 2017
@binary0111 hmmm... no... coming right up though!
goller
on 20 Oct 2017
Thanks @goller , very much appreciated! :)
binary0111
on 20 Oct 2017
@binary0111 I've added the tracking issue for kapacitor insecure ssl here: https://github.com/influxdata/chronograf/issues/2139
I've added support in the chronograf REST server here: https://github.com/influxdata/chronograf/pull/2140
The front-end javascript to present the choice hasn't been done yet, but, it's possible to add the kapacitor manually by POSTing to the server.
goller
on 20 Oct 2017
@goller Thanks so much for your help! Any ETA on a release that will include this fix?
geekdave
on 20 Oct 2017
Hey guys, also having this problem on latest 1.3.10.0, any updates on this one?
In 1.3.10.0 I have the problem creating this via UI. In version 1.3.9.0 I can create it from UI but not via REST call.
Thx!
 botzill
on 26 Oct 2017
botzill
on 26 Oct 2017
@botzill it seems to work using a cert created by the command @geekdave provided and the following influxdb config
[http]
  enabled = true
  bind-address = ":8086"
  auth-enabled = false
  log-enabled = true
  write-tracing = false
  pprof-enabled = true
  https-enabled = true
  https-certificate = "/tmp/influxdb.crt"
  https-private-key = "/tmp/influxdb.key"
  max-row-limit = 0
  max-connection-limit = 0
  shared-secret = ""
  realm = "InfluxDB"
  unix-socket-enabled = false
  bind-socket = "/var/run/influxdb.sock"
Can you provide reproduction steps to cause it to fail?
 nhaugo
on 26 Oct 2017
nhaugo
on 26 Oct 2017
@geekdave The fix is in the 1.3.10.0 release
nhaugo
on 26 Oct 2017
@nhaugo I did test it without any certificates enabled, will try with cert and see, thx. I just started on a server and set a custom domain(simple etc hosts entry) for tests and I got this issue.
botzill
on 26 Oct 2017
Hi,
I am a newbie to the TICK stack. I am trying to configure Chronograf to use SSL. I have already configured influxdb to use SSL and I was able to confirm that it's work by accessing the influx CLI and I configured the Telegraf as well.
I found this link that details how to configure Chronograf to use (https://docs.influxdata.com/chronograf/v1.3/administration/security-best-practices/#tls).
I ran this command "TLS_CERTIFICATE=/etc/ssl/cert.pem TLS_PRIVATE_KEY=/etc/ssl/cert.key Chronograf" and was able to access the chronnograf site using https. but the issue that I am running into is, once I exit the Chronnograf CLI the service stops and I cannot access the website.
Is there a way to keep it running even when you exit the CLI and reboot?
One last thing, I can't find any documentation on how to configure the Kapacitor to use SSL. Can someone please provide some insight into this?
Once I get these two working, I will have the whole TICK stack using SSL.
I am using Chronograf 1.3.9.0
Thank you for your time and help.
 jcpierre
on 10 Nov 2017
jcpierre
on 10 Nov 2017
@jcpierre I'm just seeing this from you now. Would you mind opening another issue about this?
goller
on 9 Jan 2018
If you experience this error while using chronograf and influxdb in docker(docker-compose), then you in the connection string instead of using http://localhost:8086 use http://172.XX.0.2:8086 where 172.XX.0.2 is the IP address of the influxdb container.
NB: in your computer, influxdb container may have an IP different from 172.XX.0.2
 komuw
on 20 Sep 2018
komuw
on 20 Sep 2018
Related issues
 russorat
·
4Comments
russorat
·
4Comments
 coreprocess
·
5Comments
coreprocess
·
5Comments
 121watts
·
6Comments
121watts
·
6Comments
 krysjoseoctanio
·
4Comments
krysjoseoctanio
·
4Comments
 jackzampolin
·
5Comments
jackzampolin
·
5Comments
Most helpful comment
If you experience this error while using
chronografandinfluxdbin docker(docker-compose), then you in the connection string instead of usinghttp://localhost:8086usehttp://172.XX.0.2:8086where172.XX.0.2is the IP address of theinfluxdbcontainer.NB: in your computer, influxdb container may have an IP different from
172.XX.0.2