Chronograf: y2 axis must appear when a second query is present in dashboard cell
connect #4583
as a query builder
with editor permissions or higher
when i have multiple influxql queries entered into a dashboard cell
then i would like to option to graph the second query to a second y axis
 russorat
All 4 comments
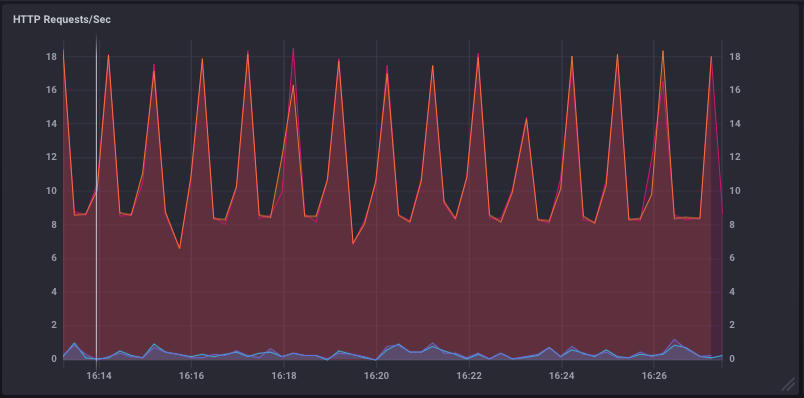
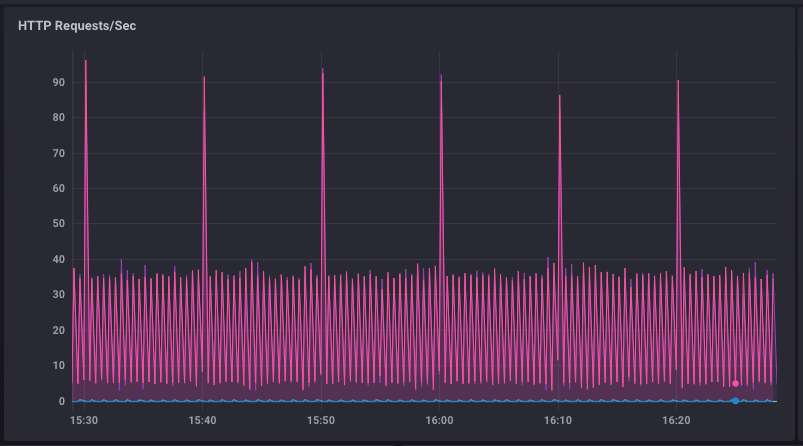
y2 seems to have disappeared as part of 1.7.11
Example: 1.6.2
 timhallinflux
on 11 May 2019
timhallinflux
on 11 May 2019
I'd like to see the previous behavior restored in 1.7.12 and potentially config options for 1.8
russorat
on 14 May 2019
This was intentionally removed in the 1.7 edition. We will revisit this as part of the InfluxDB 2.0 UI via the Giraffe library. https://github.com/influxdata/giraffe
timhallinflux
on 18 Jun 2019
👎6
We removed y2 here: https://github.com/influxdata/chronograf/pull/4680
 121watts
on 18 Jun 2019
121watts
on 18 Jun 2019
Was this page helpful?
0 / 5 - 0 ratings
Related issues
 Clausewitz45
·
3Comments
Clausewitz45
·
3Comments
 nsteinmetz
·
5Comments
nsteinmetz
·
5Comments
 krysjoseoctanio
·
4Comments
krysjoseoctanio
·
4Comments
 AlirieGray
·
4Comments
AlirieGray
·
4Comments
 coreprocess
·
6Comments
coreprocess
·
6Comments