Caseflow: Average FreeableMemory LessThanThreshold | eFolder-Prod-Freeable-Memory
Impacted Service | Appeals CloudWatch
AlarmName | dsva-appeals-efolder-prod-freeable-memory
AlarmDescription | RDS: 25% of the value for the instance as the threshold
Reason | Threshold Crossed: 1 datapoint [1.8744950784E9 (14/11/17 20:31:00)] was less than the threshold (1.875E9).
Screenshots:


 astewarttistatech
All 29 comments
13:45 spike:
Network ops
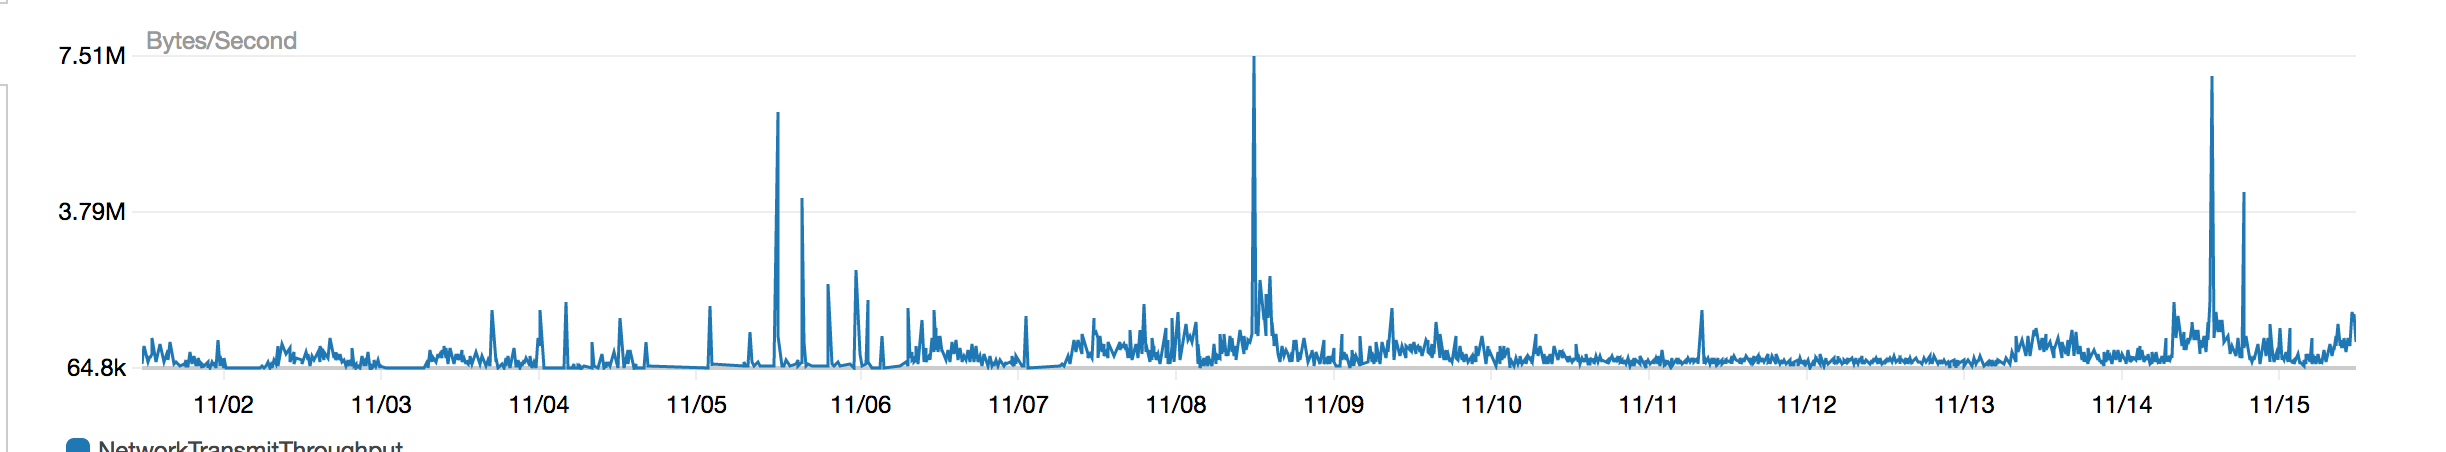
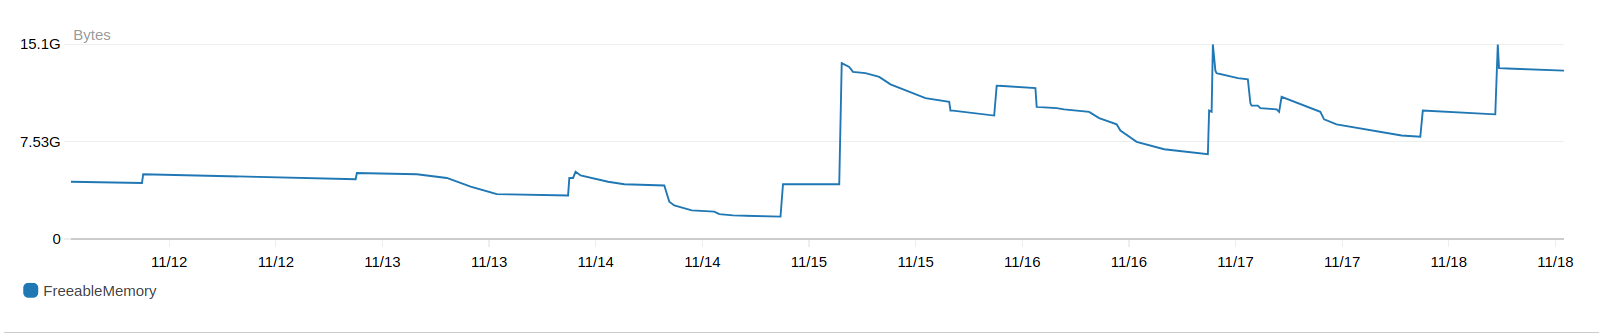
Freeable memory

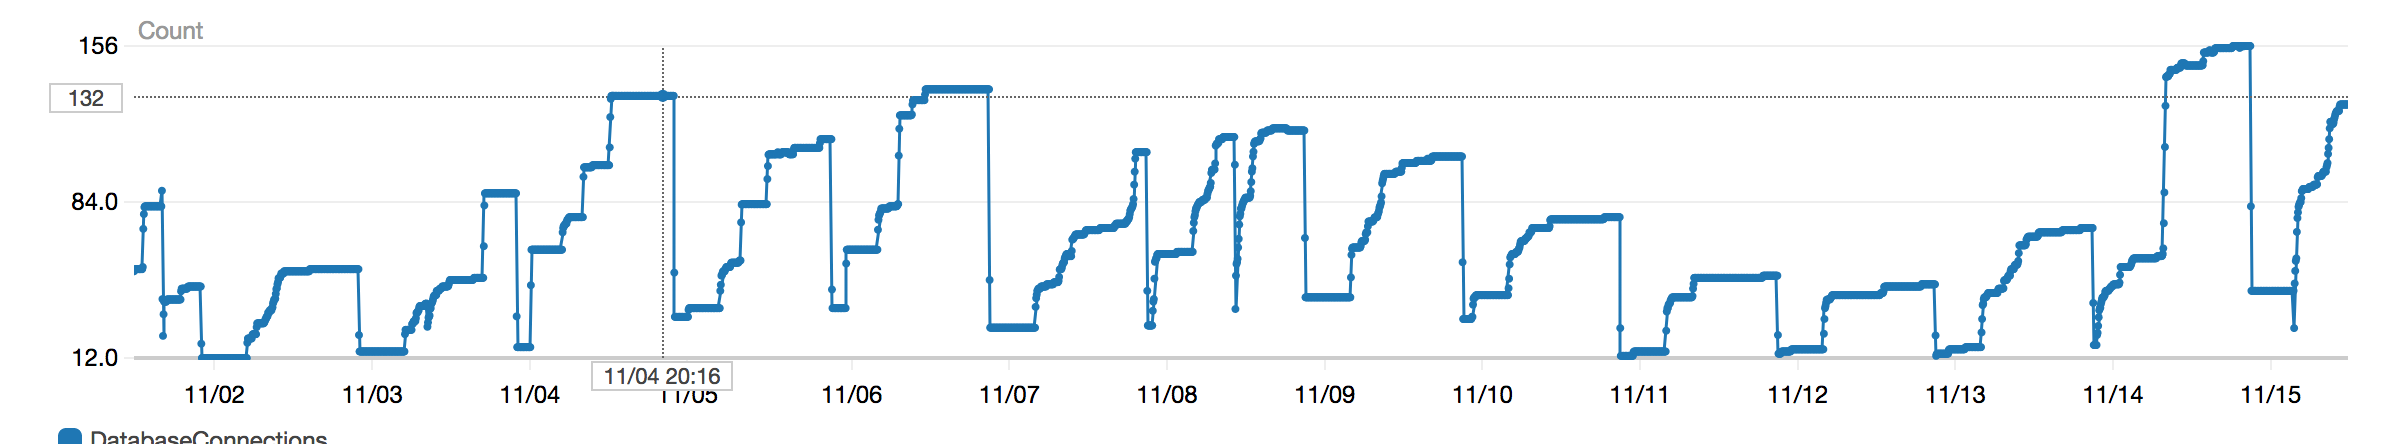
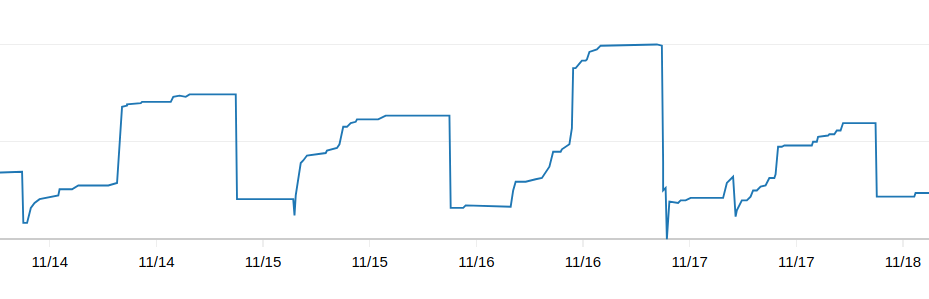
DB connections
Actions
- ~why was RDS not rebooted? We have a failover option~ I did this to at least mitigate the bleed; but this needs investigation
- if there is no immediate action, why is the alarm still enabled?
- are we going to scale up the instance to manage the new Reader load?
 ghost
on 14 Nov 2017
ghost
on 14 Nov 2017
Slow/heavy DB queries: seq scan = bad
https://github.com/department-of-veterans-affairs/caseflow-efolder/blob/master/app/models/download.rb#L50
explain (analyze, buffers) select * from downloads order by created_at limit 10;
QUERY PLAN
-----------------------------------------------------------------------------------------------------------------------------
Limit (cost=3233.44..3233.46 rows=10 width=140) (actual time=157.942..157.970 rows=10 loops=1)
Buffers: shared hit=1245
-> Sort (cost=3233.44..3390.94 rows=63001 width=140) (actual time=157.939..157.948 rows=10 loops=1)
Sort Key: created_at
Sort Method: top-N heapsort Memory: 26kB
Buffers: shared hit=1245
-> Seq Scan on downloads (cost=0.00..1872.01 rows=63001 width=140) (actual time=0.005..78.343 rows=63003 loops=1)
Buffers: shared hit=1242
Planning time: 0.108 ms
Execution time: 158.010 ms
(10 rows)
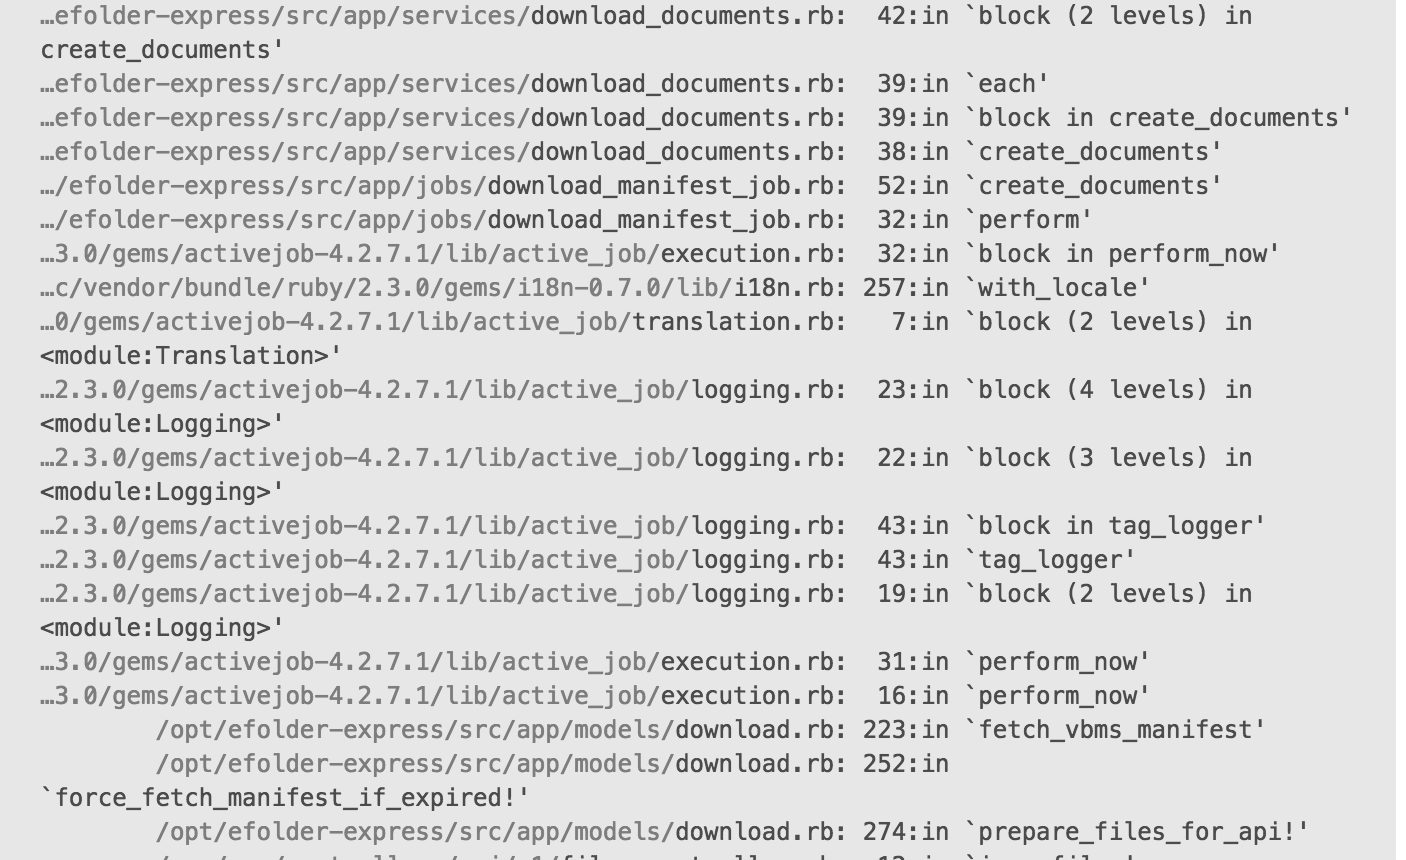
https://github.com/department-of-veterans-affairs/caseflow-efolder/blob/master/app/services/download_documents.rb#L42
explain (analyze, buffers) select * from documents order by document_id limit 10;
QUERY PLAN
-----------------------------------------------------------------------------------------------------------------------------------------
Limit (cost=909160.20..909160.22 rows=10 width=1130) (actual time=54159.897..54159.925 rows=10 loops=1)
Buffers: shared hit=195794 read=311071
-> Sort (cost=909160.20..940977.64 rows=12726978 width=1130) (actual time=54159.894..54159.903 rows=10 loops=1)
Sort Key: document_id
Sort Method: top-N heapsort Memory: 29kB
Buffers: shared hit=195794 read=311071
-> Seq Scan on documents (cost=0.00..634134.78 rows=12726978 width=1130) (actual time=0.010..33153.051 rows=12550840 loops=1)
Buffers: shared hit=195794 read=311071
Planning time: 0.135 ms
Execution time: 54159.982 ms
(10 rows)
https://github.com/department-of-veterans-affairs/caseflow-efolder/blob/master/app/controllers/api/v1/files_controller.rb#L36
explain (analyze, buffers) select * from downloads order by user_id, id limit 10;
QUERY PLAN
-----------------------------------------------------------------------------------------------------------------------------
Limit (cost=3233.44..3233.46 rows=10 width=140) (actual time=161.857..161.885 rows=10 loops=1)
Buffers: shared hit=1242
-> Sort (cost=3233.44..3390.94 rows=63001 width=140) (actual time=161.854..161.863 rows=10 loops=1)
Sort Key: user_id, id
Sort Method: top-N heapsort Memory: 26kB
Buffers: shared hit=1242
-> Seq Scan on downloads (cost=0.00..1872.01 rows=63001 width=140) (actual time=0.008..78.616 rows=63003 loops=1)
Buffers: shared hit=1242
Planning time: 0.101 ms
Execution time: 161.927 ms
(10 rows)
Compared to index scan:
explain (analyze, buffers) select * from downloads order by user_id limit 10;
QUERY PLAN
------------------------------------------------------------------------------------------------------------------------------------------------------
Limit (cost=0.29..1.22 rows=10 width=140) (actual time=0.015..0.057 rows=10 loops=1)
Buffers: shared hit=12
-> Index Scan using index_downloads_on_user_id on downloads (cost=0.29..5858.89 rows=63001 width=140) (actual time=0.012..0.035 rows=10 loops=1)
Buffers: shared hit=12
Planning time: 0.099 ms
Execution time: 0.086 ms
(6 rows)
🚀
ghost
on 15 Nov 2017
Why does SaveFilesToS3 trigger like a 1000 commits:
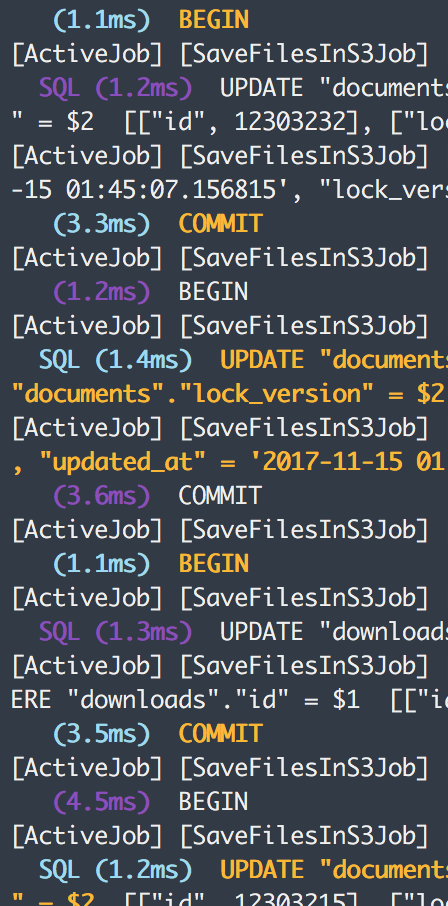
Can this be batched?
ghost
on 15 Nov 2017
Details:
- Whisky team implemented a job in Caseflow that fetches documents from VBMS and saves the documents in s3 for Reader users.
- The job uses eX API to fetch manifest, its associated documents and save the documents in s3.
- The job schedule (according to @sunil-sadasivan):
Nov 3rd  - The job runs 10 users every 4 hours to test scale
Nov 6th  - Job turned off due to csr issues
Nov 7th - Job turned on to run 3 users every 10 mins
- The first drop in freeable memory in eX DB we notice on Monday 11/6 evening
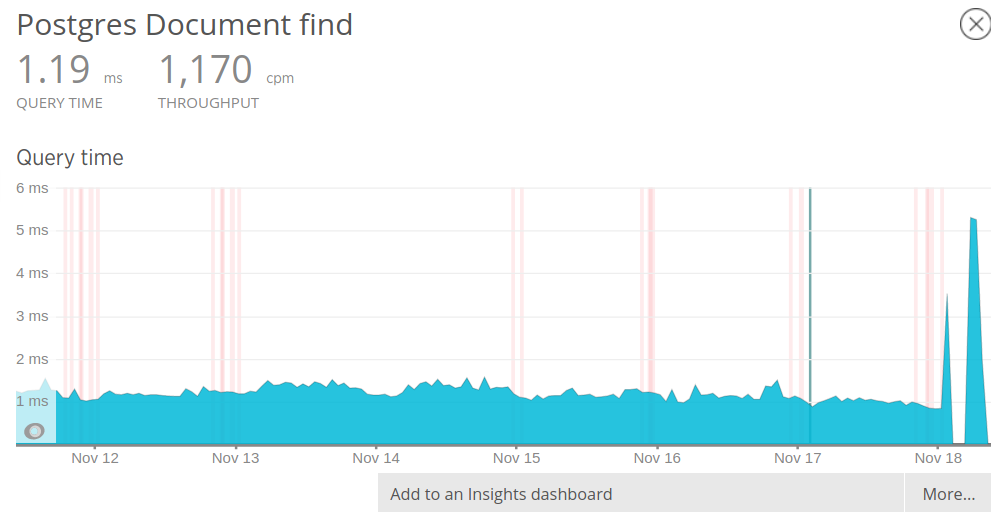
Looking at New Relic the slowest query is 'Document find' from the Api::V1::FilesController#index
ACTION which the API endpoint used by the Reader job
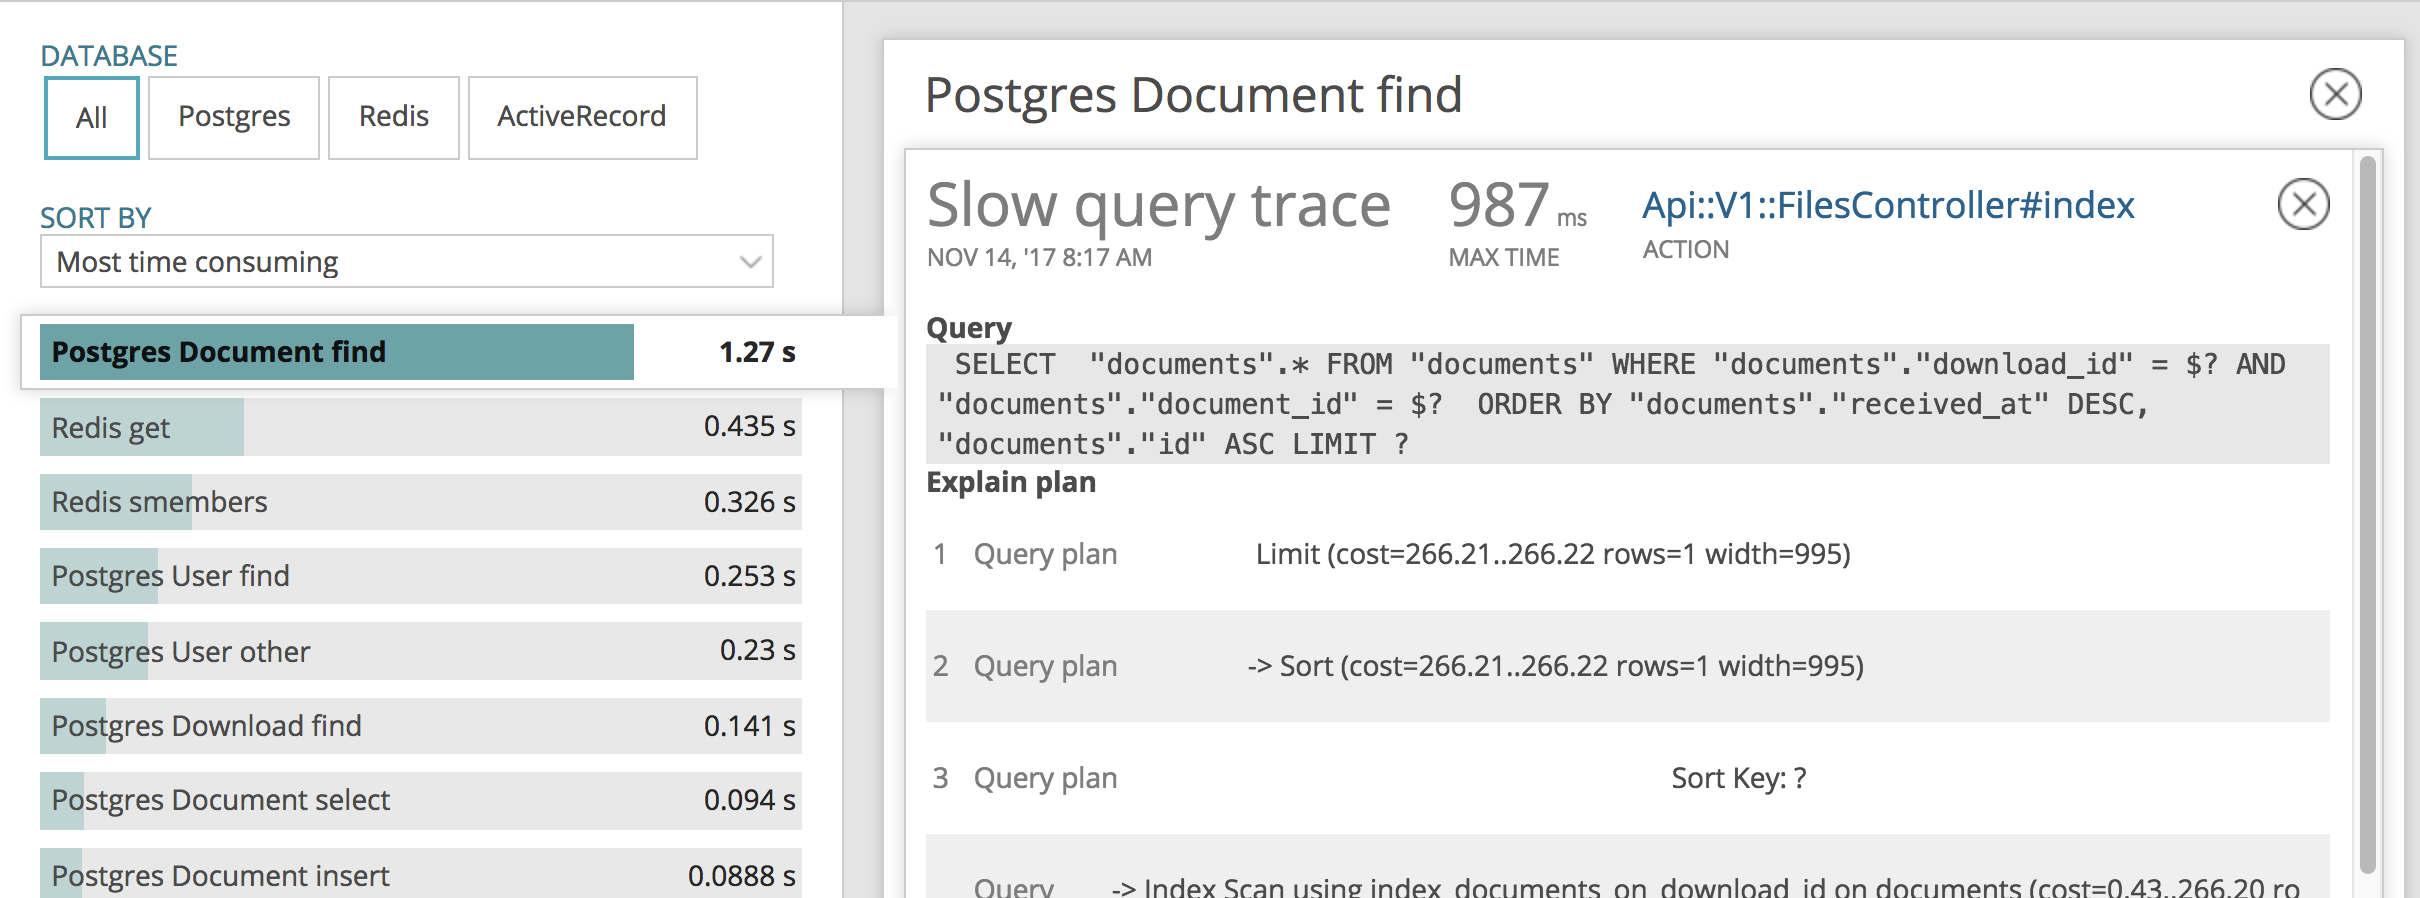
Query:
SELECT "documents".* FROM "documents" WHERE "documents"."download_id" = $? AND "documents"."document_id" = $? ORDER BY "documents"."received_at" DESC, "documents"."id" ASC LIMIT ?
The query is located here:
Checking the DB indexes on the documents table, it doesn't have an index for [download_id, document_id] combination.
Running the query manually using explain (LOCALLY)
Document.where(download: 143, document_id: "{289ED0CB-ACB1-4FDB-9F99-AD998A41155F}").explain
QUERY PLAN
----------------------------------------------------------------------------------------------------
 Index Scan using index_documents_on_download_id on documents  (cost=0.28..33.61 rows=1 width=1764)
   Index Cond: (download_id = 143)
   Filter: ((document_id)::text = '{289ED0CB-ACB1-4FDB-9F99-AD998A41155F}'::text)
(3 rows)
 @
Solutions:
- Add index to the documents table on [download_id, document_id]
Run LOCALLY to test it:
Document.where(download: 143, document_id: "{289ED0CB-ACB1-4FDB-9F99-AD998A41155F}").explain
QUERY PLAN
-------------------------------------------------------------------------------------------------------------------
 Index Scan using index_documents_on_download_id_and_document_id on documents  (cost=0.28..8.30 rows=1 width=1764)
   Index Cond: ((download_id = 143) AND ((document_id)::text = '{289ED0CB-ACB1-4FDB-9F99-AD998A41155F}'::text))
(2 rows)
 aroltsch
on 15 Nov 2017
aroltsch
on 15 Nov 2017
Good find @aroltsch! 1.27s for a db query is way too long. If this looks to be a common path which it looks to be, 👍 from me on adding a compound db index there.
 sunil-sadasivan
on 15 Nov 2017
sunil-sadasivan
on 15 Nov 2017
Great investigation! New Relic is proving super useful already!!!
 mdbenjam
on 15 Nov 2017
mdbenjam
on 15 Nov 2017
Also fixing this will shave over a second off this endpoint. That's incredible!
mdbenjam
on 15 Nov 2017
❤️ for New Relic usage.
Also, documenting our New Relic usage really helps me point to examples when I need to justify spending money on it.
 nickheiner-usds
on 15 Nov 2017
nickheiner-usds
on 15 Nov 2017
Yeah, New Relic is awesome!!!
aroltsch
on 15 Nov 2017
So the index has been added, it is unclear if there are any effects to the DB resource utilization.
The connection count reduced to Wednesday's level, but it is still abnormally high when we used to hover between 30-40 connection two weeks ago.
There is no evidence of memory reduction either.
While I see the slow query reported in NR, there are other reports that shows Document.find is _typically_ very fast (<1ms). So if it is unclear to me if the slow query is just an occasional outlier.
Fundamentally, I feel like we need to take a step back to ask what transaction has increased significantly since the jobs are turned on, and how they impact the system? So far, the background job has been pushing both RDS and CSR/VPN to much higher than usual load. Is it actually bringing positive impact to user experience? Can the job be optimized to spread out load more evenly? If not, can the job be scheduled to run in non-business hours?
 askldjd
on 18 Nov 2017
askldjd
on 18 Nov 2017
Thanks @askldjd for the update here.
I think there are a few things happening here, and I'm not entirely sure if the background job is the culprit. The timing of the background job and the reader roll out is almost identical in timing, so I think we need to understand the root cause first. Seeing these peaks throughout M-F leads me to believe this is also caused by the load from real-time reader usage instead of from the background job.
The background job hits efolder at a regular rate of at most 3 users / 5 mins and doesn't scale up or down during business hours. However, the increased connections and memory usage seem to follow a pattern of increased usage from business hours.
Taking a look at throughput for the efolder Documents API. It does look like we're hitting increased load during business hours. This looks to hit close to 700 requests per minute to the api/documents#show route.
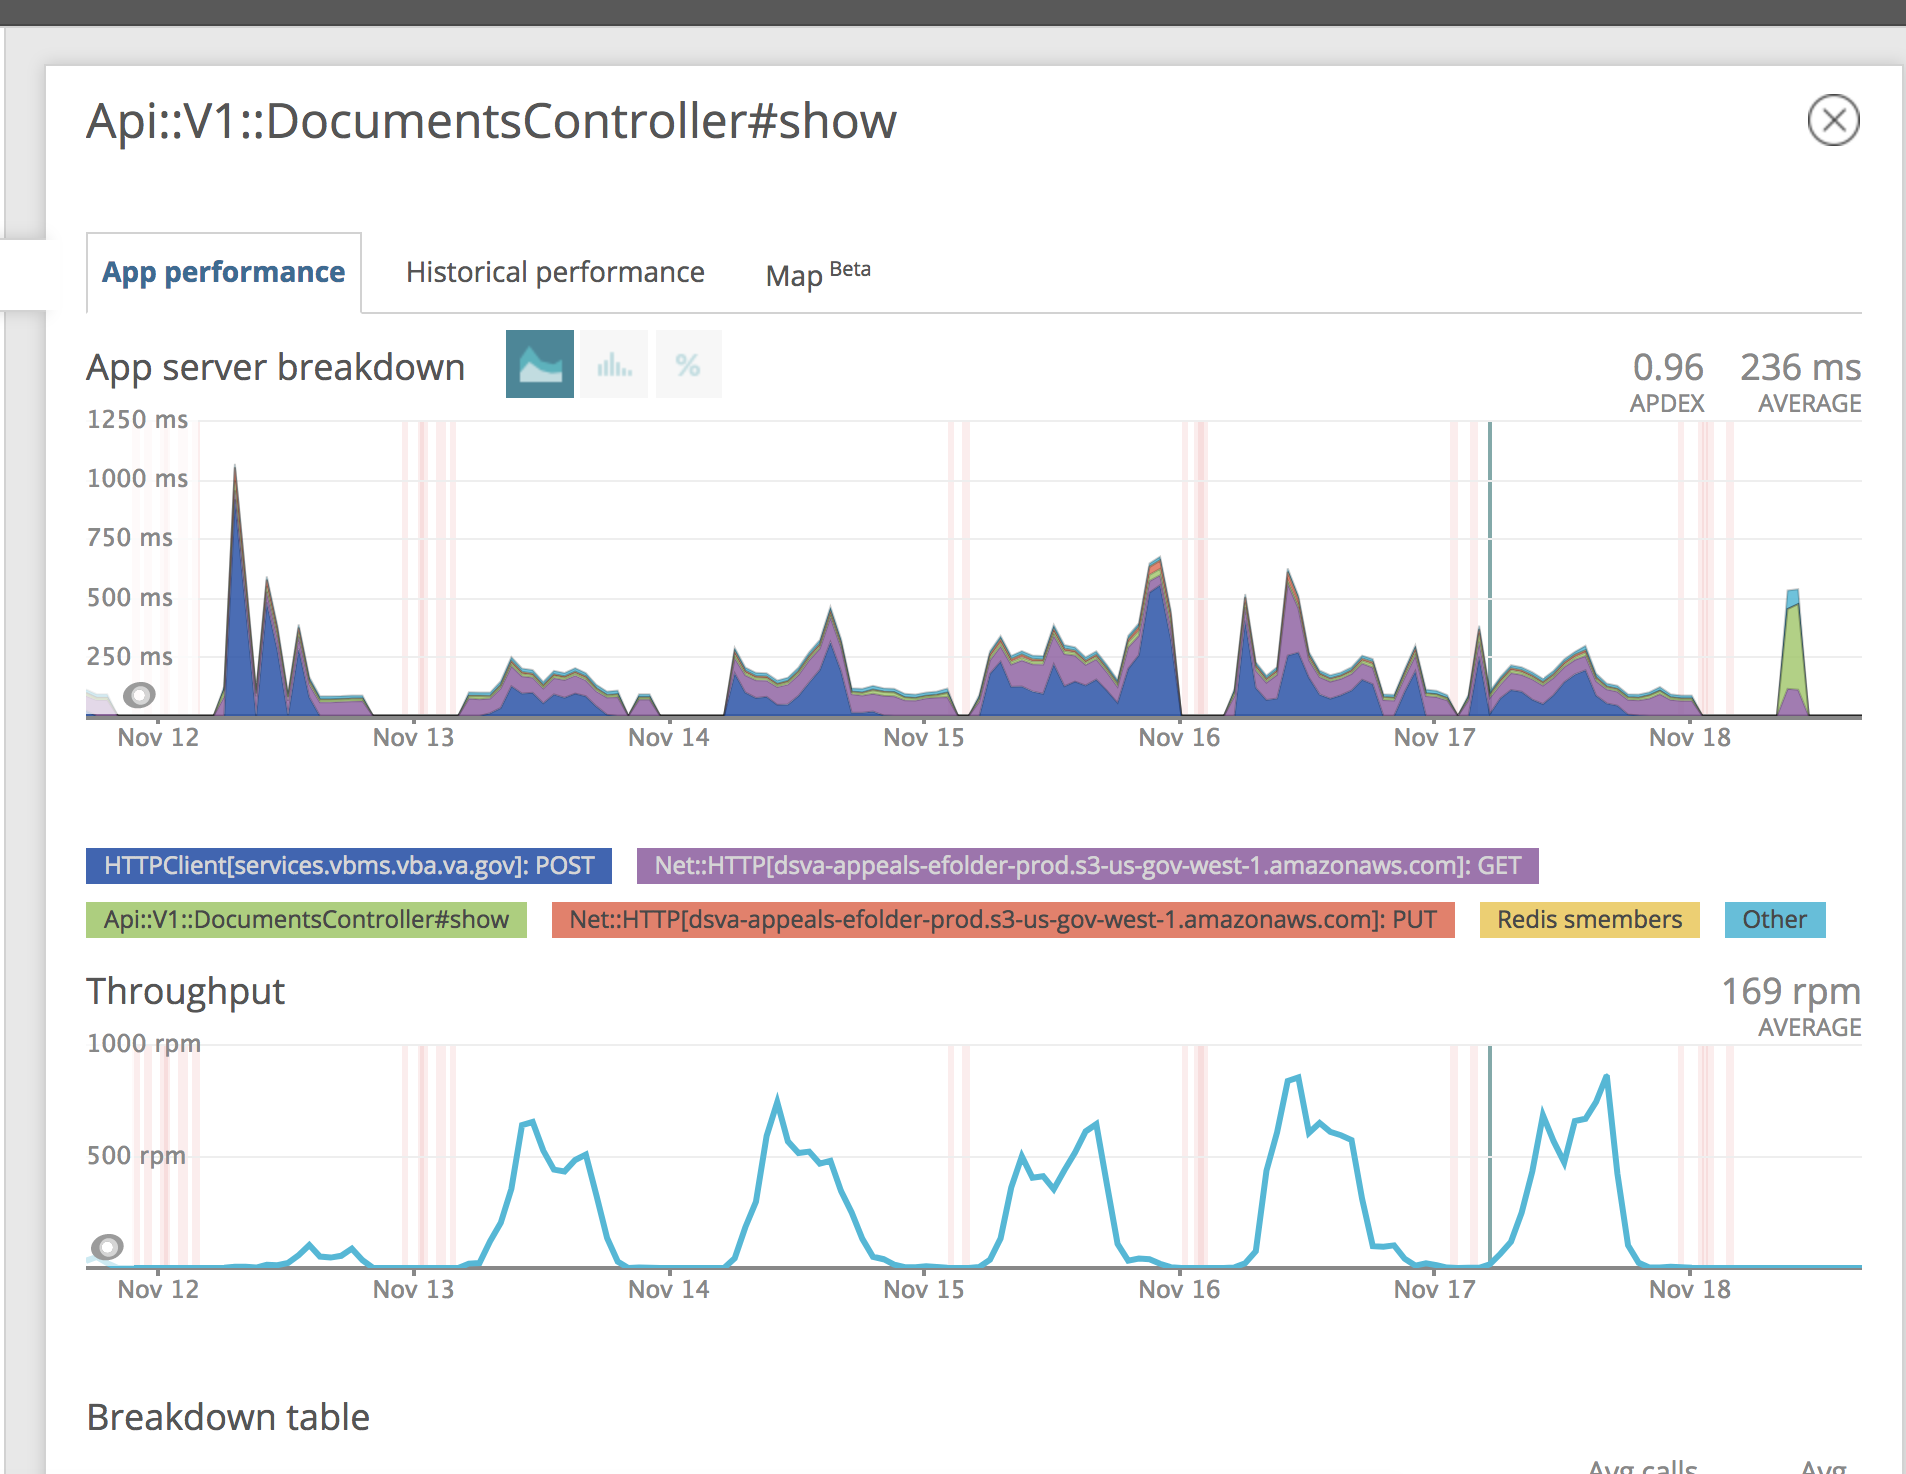
https://rpm.newrelic.com/accounts/1788458/applications/81190810/transactions#sort_by=throughput&id=5b22436f6e74726f6c6c65722f6170692f76312f646f63756d656e74732f73686f77222c22225d
This load patterns to the api/documents#show route is leading me to suspect that these are the patterns due to reader client downloads as we talked about yesterday. ie. If we limit document downloads from the client side, this should relieve db connection pressure. My conclusion is to focus on reducing the amount of efolder express API calls the client makes.
Curious if this makes sense @askldjd @kierachell?
Can the job be optimized to spread out load more evenly? If not, can the job be scheduled to run in non-business hours?
- The BG job is only meant to reduce our calls and spread the load of our VBMS dependency, this does not help reduce efolderX load from the client. This already runs at a consistent, spread out rate right now. I am quite skeptical of the bg job being the culprit, though I'm eager/happy to turn it off as a test during business hours. Let me know if you think this needs to be done @askldjd.
(Again, my intuition is the increased load from client side is causing eX load issues as shown in the new relic image above)
sunil-sadasivan
on 18 Nov 2017
I agree, I think the job just pushed us over the edge because of the following issue:
https://github.com/department-of-veterans-affairs/caseflow/issues/3412Just browsing 2 cases each with 20 small PDFs:
I was able to generate 300+ requests and 50+MB of data. Maybe 30% from disk cache. Assuming most cases have 100+ documents... this will be problematic when scaled to 700 users (and each lookup requires a DB query).
- This might not be the culprit - I need to explore further
ghost
on 18 Nov 2017
@kierachell just to be clear with the culprit, this example points to the reader client fetches from efolderX causing excessive load, not necessarily the bg job... is that correct.
I'm just trying to be explicit and understanding of the exact cause here. (the bg job != reader client :) )
Also that's pretty insane how we have 300+ requests for just 2 cases of 20 PDF docs. Looks like we're trying to DOS ourselves.
sunil-sadasivan
on 18 Nov 2017
Correct, it is not the culprit, and it definitely not helping eFolder (only VBMS maybe; still have to investigate those 50k hourly hits).
ghost
on 19 Nov 2017
Agreed, I'm digging into the 60k VBMS spikes as well. (My hope is that was due to the onboarding of new reader users over the past two weeks and that we won't see them again)
I'm adding S3 counters to efolderX at the moment.
sunil-sadasivan
on 19 Nov 2017
Just a follow up to my comment above
The background job does _not_ call the api/v1/document#show route. This is only hit from the reader client from separate browsers. The bg job does call the files API:
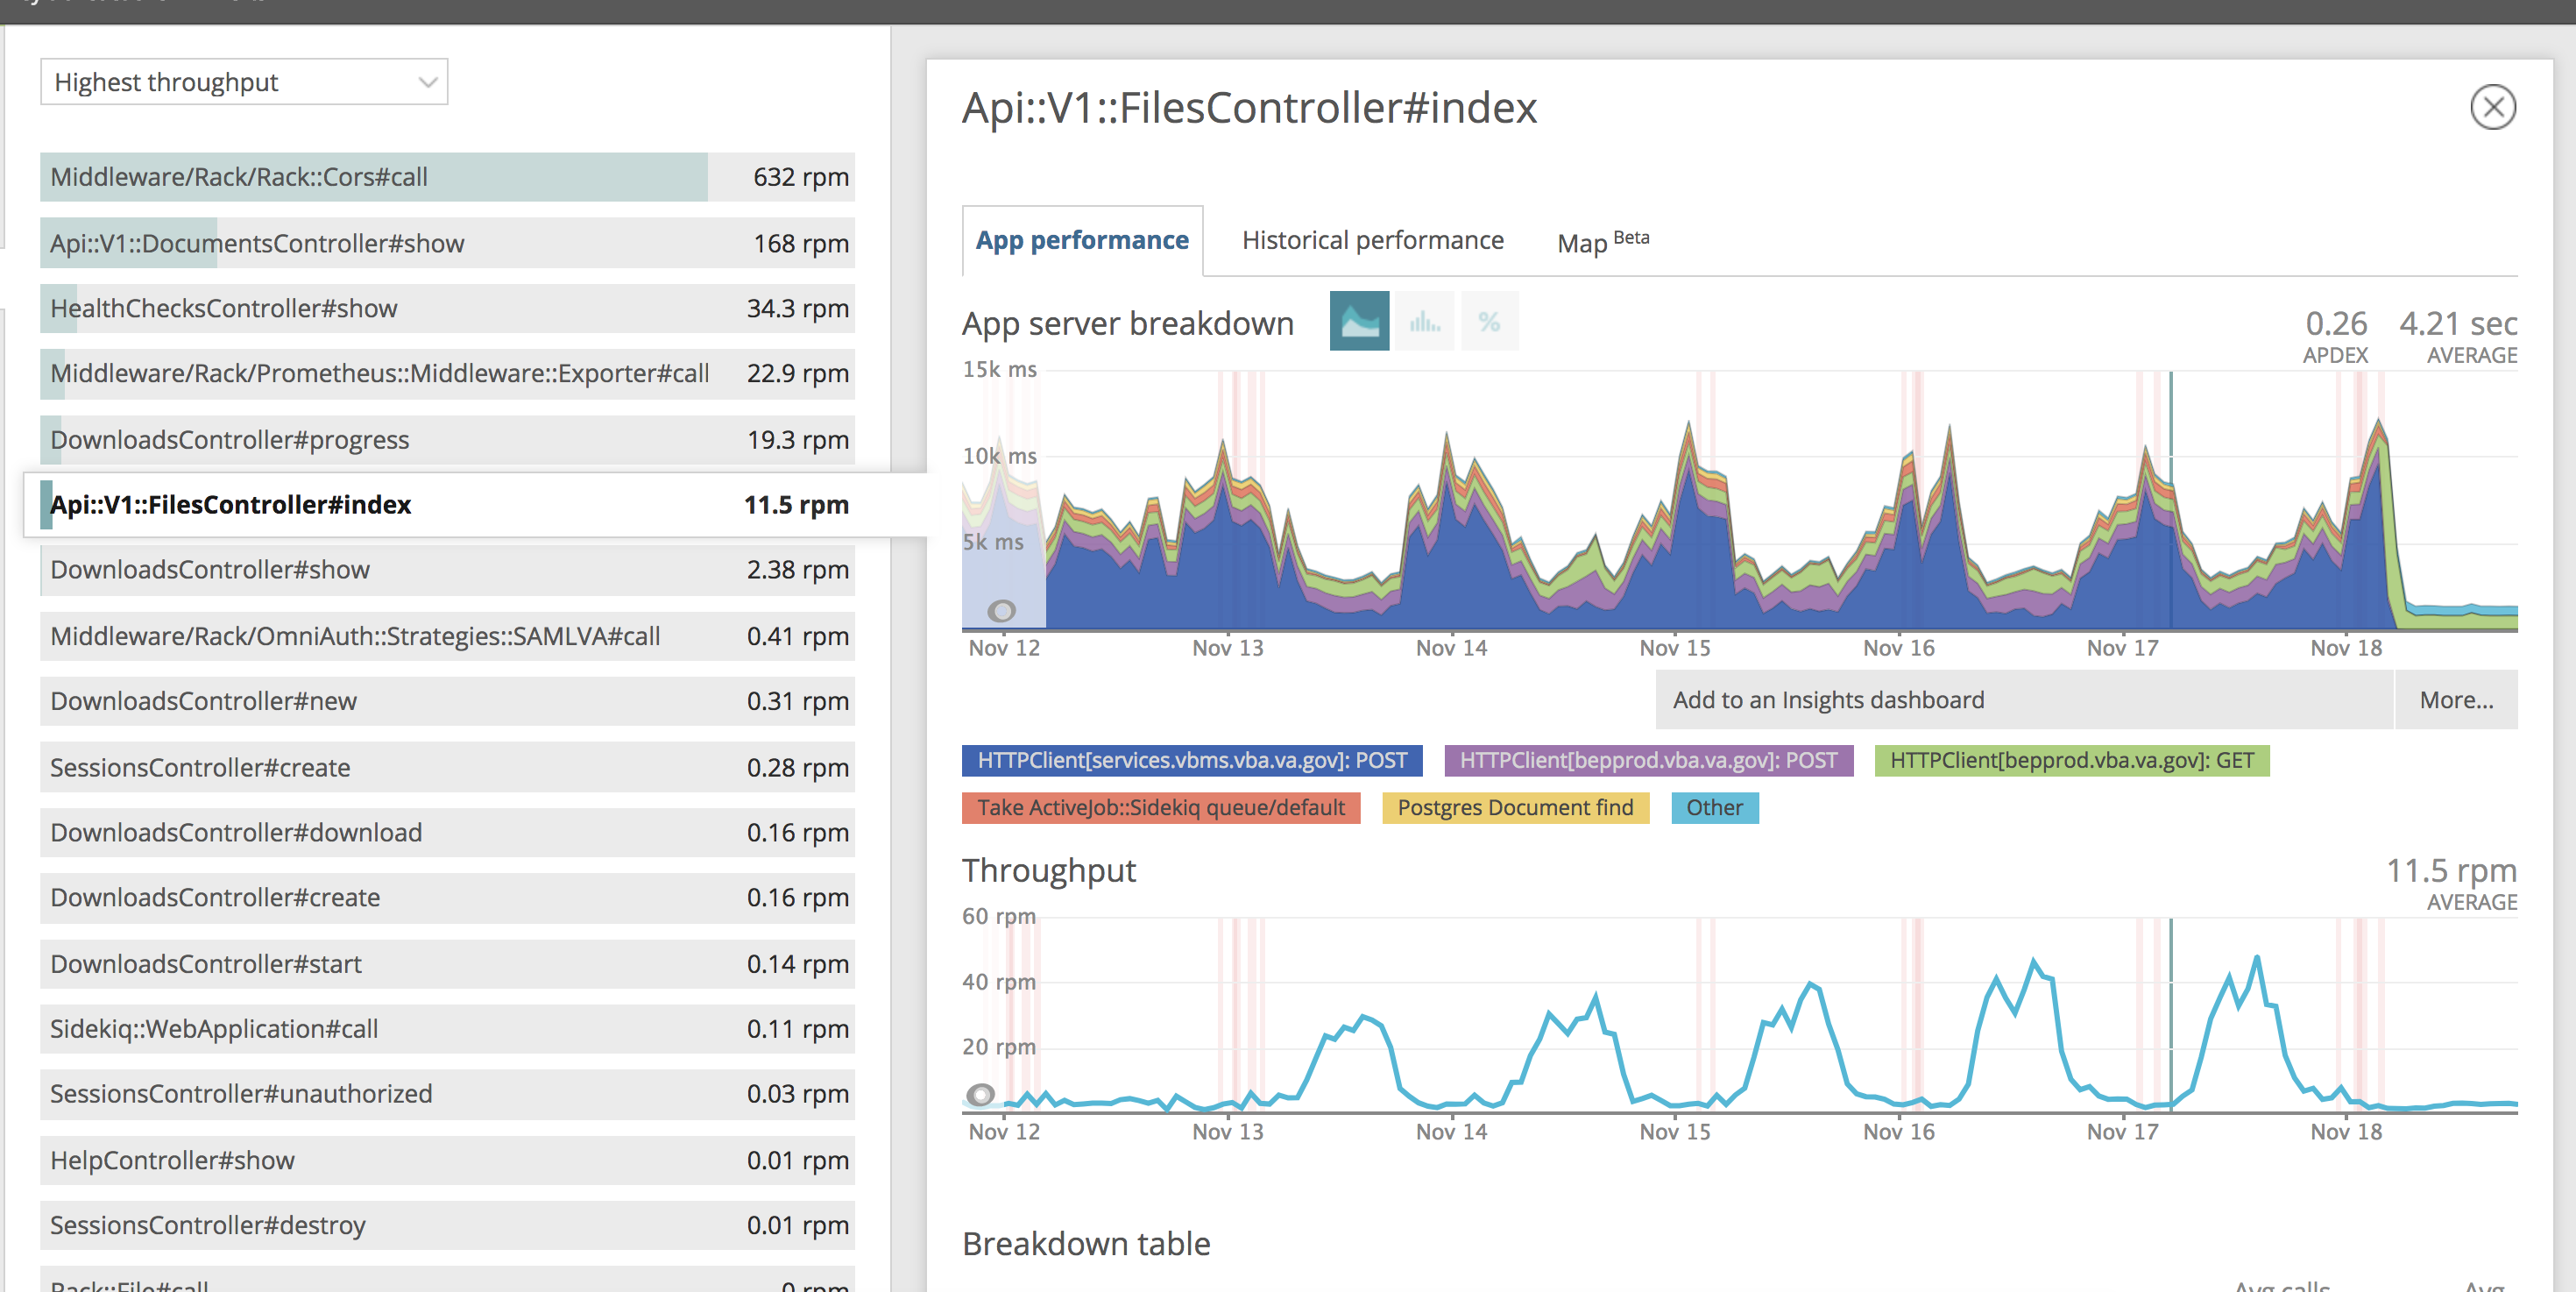
This looks to be at peak around 40 requests/min.
sunil-sadasivan
on 19 Nov 2017
@sunil-sadasivan
Thank you so much for looking into this and adding the S3 counters in!
I am not sure if background job is the culprit. Like @kierachell said, we probably have several performance issues here and each adds to the load.
Taking a look at throughput for the efolder Documents API. It does look like we're hitting increased load during business hours. This looks to hit close to 700 requests per minute to the api/documents#show route.
I was trying to confirm the 700 req per minute, but I can't get to the data anymore in NR (I don't know why). So I used Prometheus to track the same data.
This is the eX api/documents#show call per minute during Nov 16 business hours.
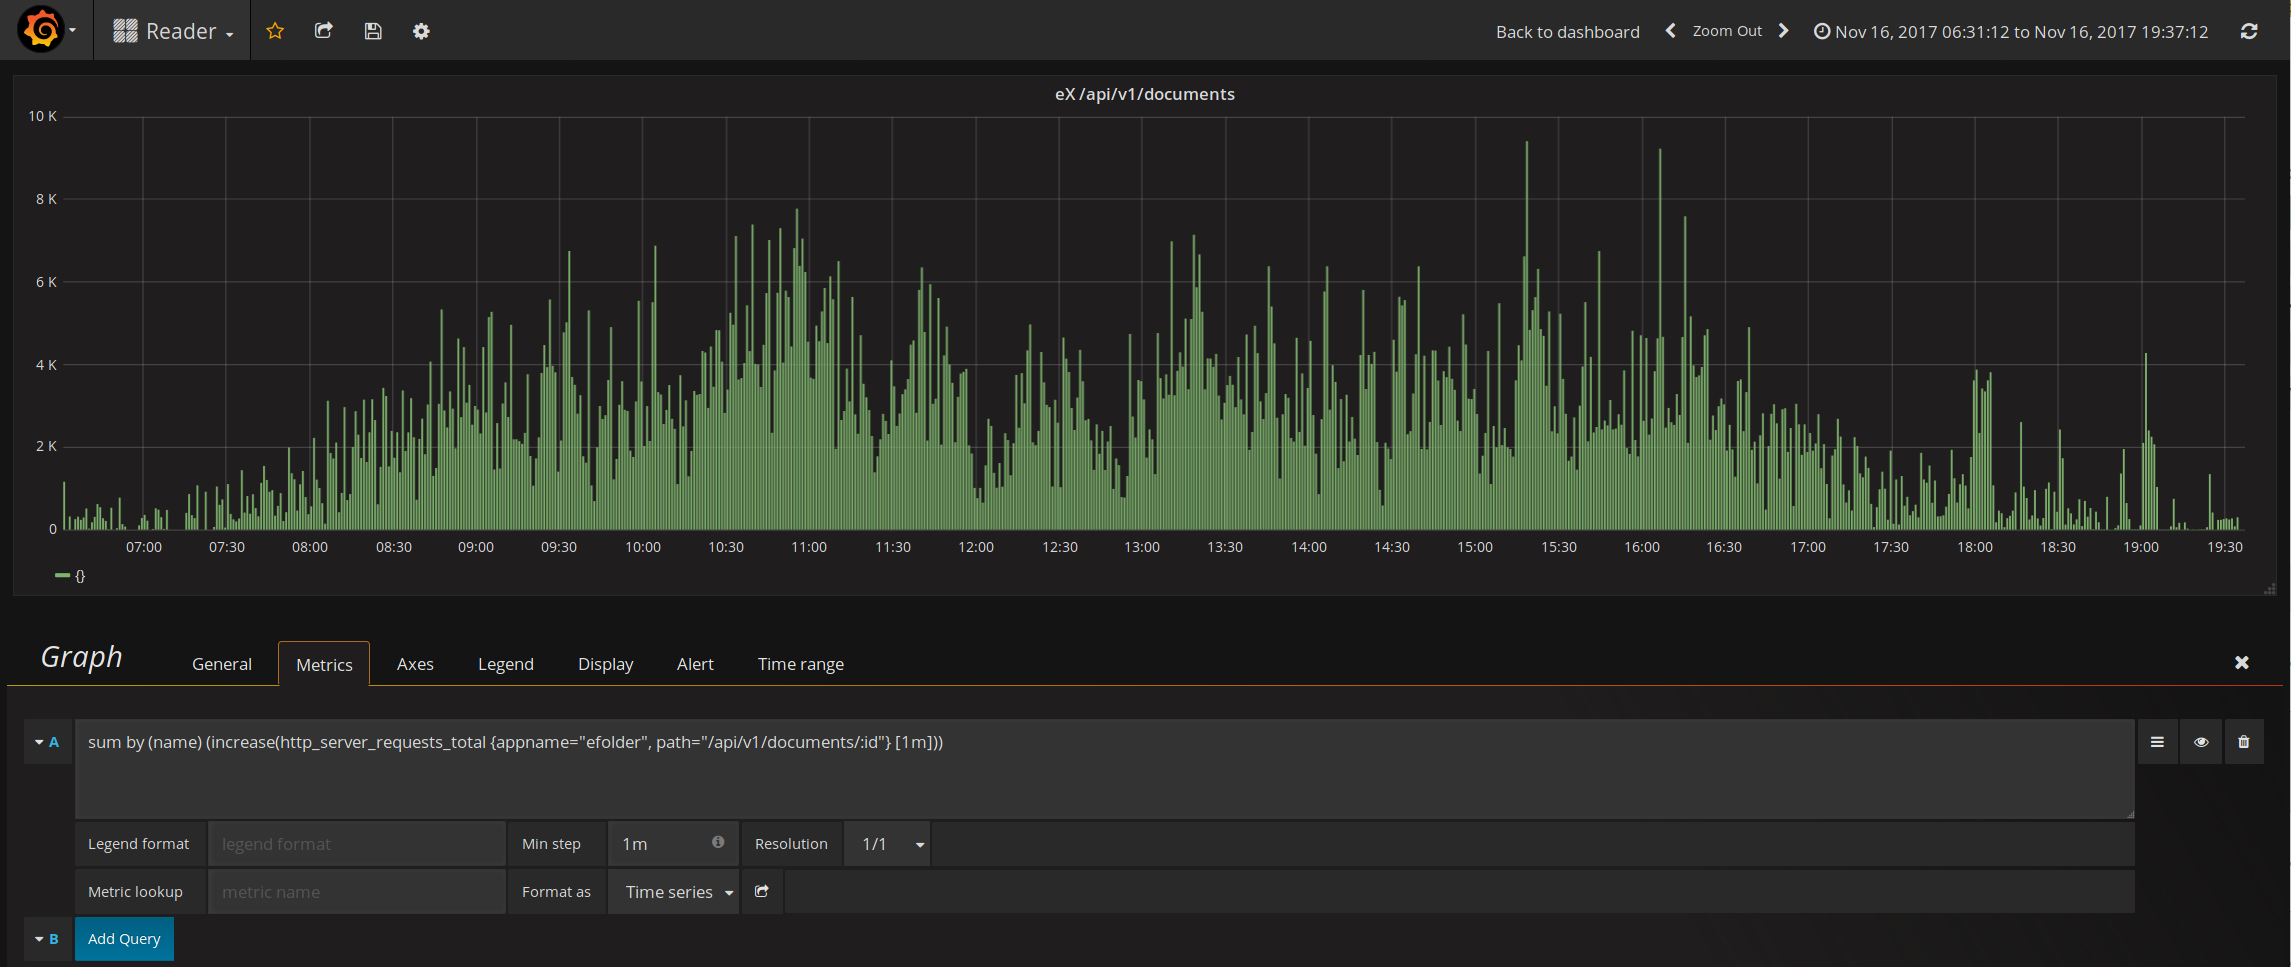
According to Prometheus, we hit 9400 request per minute at peak , which translates to about 156 request per second. This essentially answered my question on why we have 200 DB connections open. It looks like we really are serving 200 request concurrently in eX.
I am not sure how to get this data to agree with NR.
The next obvious question is why are we downloading so much? I thought we cache the PDFs in the browsers. This behavior is as if our users are streaming PDFs continuously during business hours
askldjd
on 19 Nov 2017
I also want to state the end goal once again so we don't lose sight. DB memory/connection, EC2 loads, CSR loads are all symptoms of the real problem - VPN bandwidth.
The hard cap for the VPN tunnel is 500 Mbps, and I would like to stay below 250 Mbps for safety. The limit applies to both current setup, and the future setup under Direct Connect. Whatever we do, we need to focus on reducing the bandwidth number.
askldjd
on 19 Nov 2017
Thanks @askldjd, with @mdbenjam out this week... I think it'd be good to get someone on the whiskey team to understand why we're triggering so many document downloads from the client. If we can limit this, this will likely help resolve the symptoms caused by a high number of doc downloads.
I'm going to look into the client side logic tomorrow and see what I can find.
I'd like to tag @dannysellers or @tejans24 who both have knowledge of the reader client side to see if either of them have some thoughts.
sunil-sadasivan
on 20 Nov 2017
New index:
- Just checked it again since it was built and I say it was a good optimization:
    relid::regclass AS table,
    indexrelid::regclass AS index,
    pg_size_pretty(pg_relation_size(indexrelid::regclass)) AS index_size,
    idx_tup_read,
    idx_tup_fetch,
    idx_scan
FROM
    pg_stat_user_indexes
    JOIN pg_index USING (indexrelid)
WHERE
    idx_scan > 100
    AND indisunique IS FALSE ORDER BY idx_scan DESC;
- Gives me:
   table   |                     index                      | index_size | idx_tup_read | idx_tup_fetch | idx_scan
-----------+------------------------------------------------+------------+--------------+---------------+----------
 documents | index_documents_on_download_id_and_document_id | 938 MB     |     24295292 |      22401666 |  1509980
 users     | index_users_on_css_id_and_station_id           | 56 kB      |        96857 |         96857 |    96859
 downloads | downloads_completed_at                         | 5472 kB    |     47307261 |      46252431 |    87004
 downloads | downloads_manifest_fetched_at                  | 5192 kB    |    127625758 |     125464955 |    49614
 searches  | searches_created_at                            | 1768 kB    |      7558853 |       2645796 |    44157
 searches  | searches_status_created_at                     | 4040 kB    |      7520239 |       2607182 |    17884
From a 2 day weekend. So that's good that it is faster now.
This does not solve the database DDOSing problem we have tho: why was it used 1.5mil times....holy shit
ghost
on 20 Nov 2017
Also that's pretty insane how we have 300+ requests for just 2 cases of 20 PDF docs. Looks like we're trying to DOS ourselves.
Hmm, yes, that is odd and worth looking in to further.
What are S3 counters?
I was trying to confirm the 700 req per minute, but I can't get to the data anymore in NR (I don't know why).
Our trial is running out.
I also want to state the end goal once again so we don't lose sight. DB memory/connection, EC2 loads, CSR loads are all symptoms of the real problem - VPN bandwidth.
:+1: 💯. We definitely need to keep the real problem in sight. And if we can solve any problem by just scaling up, we should do it. It'll be much more cost effective to use more server resources instead of burning team time.
nickheiner-usds
on 20 Nov 2017
What are S3 counters?
Ah, looks like this just refers to Prometheus metrics.
nickheiner-usds
on 20 Nov 2017
Yeah apologies for not being more explicit there. Over time, we should be hitting s3 more over vbms. We can infer a cache miss/hit rate for the docs API by measuring s3 vs VBMS requests.
sunil-sadasivan
on 20 Nov 2017
And if we can solve any problem by just scaling up, we should do it. It'll be much more cost effective to use more server resources instead of burning team time.
I don't fully agree with this. Reasonable engineering principle and best practices still applies. I am much more cautious of solutions that requires vertical scaling (e.g. RDS) than horizontal scaling because you can only play this card so many times.
In short term, scaling up might make sense. In long term, it may not. A classic example is VACOLS. The inefficiencies of VACOLS UI is the root cause of why VACOLS DB can not migrate to the cloud today. VACOLS DB is also vertically scaled up to the limit such that its size impacts VM migration and recovery.
Software inefficiencies should be treated as a technical debt. Optimization should be performed routinely to minimize impact to the long term sustainability of the project.
askldjd
on 20 Nov 2017
I'd agree with @askldjd on this, especially knowing that we have hit a limit of vertical scaling with our CSR. This boundary led us to understand that we're seeing excessive client requests which is likely a suboptimal user experience and something we should optimize.
There is certainly a trade-off of developer velocity and taking debt vs taking a step back to figure out the root cause. I think it's better to look at each occurrence of needing to make this trade-off with different assumptions of what is the reasonable course of action.
sunil-sadasivan
on 20 Nov 2017
And if we can solve any problem by just scaling up, we should do it. It'll be much more cost effective to use more server resources instead of burning team time.
does burning future teams' time count? or is the idea to provide employment for the future appeals modernization teams?
ghost
on 21 Nov 2017
And if we can solve any problem by just scaling up, we should do it. It'll be much more cost effective to use more server resources instead of burning team time.
I don't fully agree with this. Reasonable engineering principle and best practices still applies.
Agreed. We don't want to write disastrously bad code. I guess I'd just like us to keep scaling up as an option, instead of treating our current instance size as a constraint.
nickheiner-usds
on 22 Nov 2017
Hey @NickHeiner @sunil-sadasivan are there any more action items from this post mortem?
We've already done two things:
aroltsch
on 30 Nov 2017
@aroltsch I believe we can close this one now. We can follow up if there are future incidents.
sunil-sadasivan
on 30 Nov 2017
Related issues
 laurjpeterson
·
4Comments
laurjpeterson
·
4Comments
 lomaxap
·
3Comments
laurjpeterson
·
5Comments
lomaxap
·
3Comments
laurjpeterson
·
5Comments
 amprokop
·
6Comments
amprokop
·
6Comments
 marvokdolor-gov
·
3Comments
marvokdolor-gov
·
3Comments
Most helpful comment
Details:
Looking at New Relic the slowest query is 'Document find' from the Api::V1::FilesController#index
ACTION which the API endpoint used by the Reader job
Query:
The query is located here:

Checking the DB indexes on the
documentstable, it doesn't have an index for [download_id, document_id] combination.Running the query manually using
explain(LOCALLY)Solutions:
Run LOCALLY to test it: