Cacti: Boost cycles take significantly longer in cacti 1.2.14 than in 1.2.2
Describe the bug
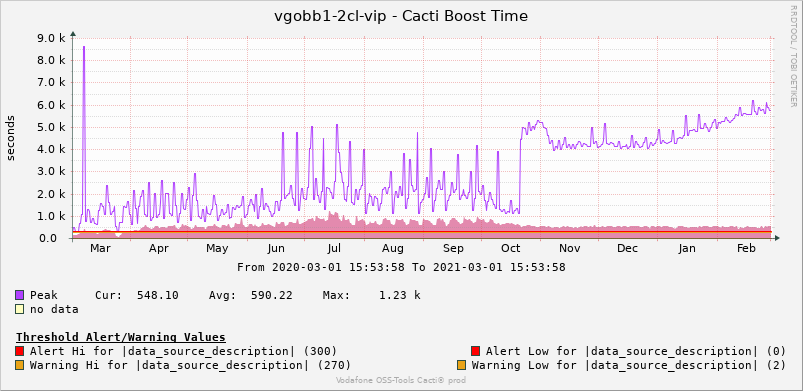
Our cacti installation was upgraded from 1.2.2 to 1.2.14 last year in October. I had a boost-runtime template running already, which takes the information from the boost timing logs and creates a nice graph out of it. Since the upgrade was done, i see a steep rise to a significantly higher boost time than before (factor 3 - see graph below) and we are also running into some ram problems due to which long running scripts are becoming victims of the Kernel OOM-killer.
My boost-stats-template is just parsing the stats-lines in the cacti logs to obtain the last runtime statistics, i assume those can be trusted.
The item count did not change in a significant manner directly after the upgrade, nor did we change any boost related settings. Therefore I assume that something has changed in the boost handling, which causes a higher stress on the system and thus it takes longer to process all the items.
Were there any significant changes in the boost code, which could explain such a quite high rise?
Would be good If you give me a few pointers, because this is now slowly hitting us more and more.
If needed, you can tell me where to look, i can add some debugging code if needed and we can try to find the source of the problem together.
To Reproduce
- Install 1.2.2
- add quite a lot of devices
(3. add boost runtime stats for nicer comparison) - let it run for a while and observe boost times int he graph
- upgrade to 1.2.14
- check boost times again
Expected behavior
Boost times should be in a similar region as in the previos version
Screenshots
Additional context
 bernisys
All 12 comments
There is a change in the 1.2.x branch that hits the reset button on this. For 1.2.14, it's going to be easier to upgrade to 1.2.17 when release vs. cherry picking the files to make it work.
 TheWitness
on 1 Mar 2021
TheWitness
on 1 Mar 2021
Hi Larry, thanks for the quick reply :)
Looking forward then to 1.2.17 - do you have a rough idea about a possible release date?
We planned to go to 16 in near future anyway (we have it running already on the test environment), so if 17 arrives quickly, we could decide to directly take that step.
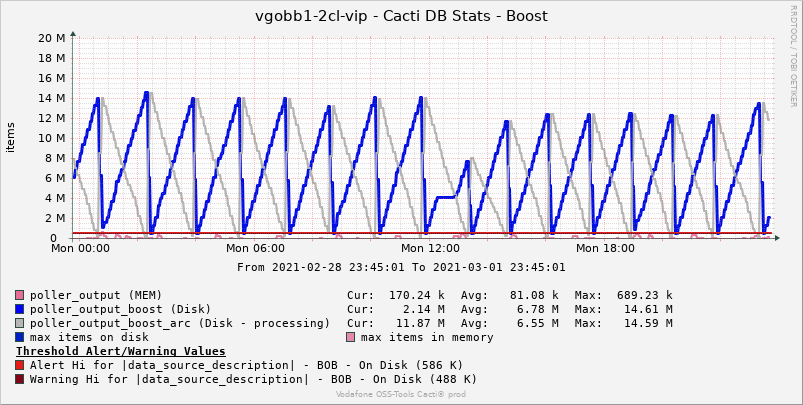
Meanwhile i have played a bit with the boost settings, i read some forum post which pointed out that decreasing the items per cycle would decrease the memory footprint, but it did not really yet bring too much benefit. It went down from 14M to 12M items in the boost table, means about 16-18 values per data source should be stored there.
I can provide a graph if you like - plus the template? It would be a nice addition to the standard templates.
Internal monitoring is somewhat important.
Until the release is done, do you think it is worth a try playing around with it a bit more? decreasing further? Because we are still facing several OOM killers hitting our boost process from time to time, i hope that decreasing that setting might help here at least a bit.
Here's the current situation:
$ grep "SYSTEM BOOST STATS"  cacti.log | grep -v "Time:1\."
2021-03-01 08:38:10 - SYSTEM BOOST STATS: Time:5396.4000 RRDUpdates:15028682
2021-03-01 10:08:31 - SYSTEM BOOST STATS: Time:5415.5500 RRDUpdates:14292680
2021-03-01 11:43:48 - SYSTEM BOOST STATS: Time:5438.2500 RRDUpdates:15072220
2021-03-01 13:20:48 - SYSTEM BOOST STATS: Time:5553.8300 RRDUpdates:15110294
2021-03-01 14:42:35 - SYSTEM BOOST STATS: Time:4757.7400 RRDUpdates:8811144 <-- 1st boost run after decreasing the value
2021-03-01 16:04:08 - SYSTEM BOOST STATS: Time:4855.2900 RRDUpdates:12762300
2021-03-01 17:31:52 - SYSTEM BOOST STATS: Time:5021.1400 RRDUpdates:13483237
2021-03-01 18:54:51 - SYSTEM BOOST STATS: Time:4897.8100 RRDUpdates:13493834
2021-03-01 20:20:18 - SYSTEM BOOST STATS: Time:4926.0400 RRDUpdates:13505921
2021-03-01 21:46:07 - SYSTEM BOOST STATS: Time:4977.7200 RRDUpdates:13317262
Times are a bit shorter, items processed are a bit less, still it sometimes takes quite a long time and i would expect that the system could process everything faster. I've tried to analyze it further, i think one of the problems might be that MySQL needs to swap out, while the boost php script eats up a lot of memory, and these two things are somehow winding each other up. Also there are quite a lot of items in the boost-cache table on disk, and the bulk-inserts often take 10 seconds and more when the table gets filled (I checked the mysql slow-query log). Maybe splitting the boost cache into multiple tables could help? For example one dedicated table per remote-poller? Decreases the rows to be processed per insert operation.
Here's a related graph with the boost items in the DB (poller_output_boost and the *_arch table). Last cycle is already rising again, not sure why. It went stable on 2M less items for a while, but now it starts rising again back to the original value.
BTW: when i dropped the boost items and saved the new values in the GUI, we had a quite long gap of 1h in many of the remote devices' graphs. So there might be something that needs to be fixed as well. I've checked - the values are gone from the DB but never reached the RRDs.
I've not been too deeply inside the boost scripts yet, so i have no idea how it works internally. If i would set the items per cycle even lower, would it still try to get as many values into one RRD file as possible in one step? Or would there be several updates to the same RRD file?
Other questions that come into my mind:
Why is it taking >8GB of memory to process 50k items? Could there be a leak somewhere? How could i find such leak, is there a way to profile this? (I'm not that much into php and web-gui related apps ... i'm more perl-affine.)
If there's anything i can do - tell me and i will try :) - if you say, i should still better wait for v17, i'll do that :)
I'd really like to help getting the code clean as possible, finding and fixing bugs, it benefits the whole user-community in the end.
bernisys
on 1 Mar 2021
@bernisys the graphs you posted are really well done, did you create them? do you have the possibility to share them or can I find them somewhere? thanks a lot.
 anarkia1976
on 2 Mar 2021
anarkia1976
on 2 Mar 2021
Hi anarkia,
thanks, i do monitoring for a living :)
And well, yes, that was my plan anyway. I will put my stuff on my github repo later. I just created a repo for it, i only have to weed thru the scripts and see if i have to clean out any hardcoded stuff that doesn't belong to github.
In total, i would rather see these templates in the cacti standard package, because i think cacti itself was so far lacking a bit of internal monitoring.
bernisys
on 2 Mar 2021
@anarkia1976 please check https://github.com/bernisys/cacti-templates
It is by far not complete yet, but the most important parts should be there.
bernisys
on 2 Mar 2021
I've put so much into 1.2.17. two weeks max. It'll be a performance focused release.
TheWitness
on 3 Mar 2021
@browniebraun is using the boost. He had a little incident today and flushed 70m boost records in 11 minutes.
TheWitness
on 3 Mar 2021
Now I'm REALLY interested in 1.2.17 - performance is something that hits us at several points.
Thanks & keep up the good work!
bernisys
on 3 Mar 2021
Just finishing a 30k host Cacti install in next two weeks. Then, it'll be ready for release. Polling time around 90-100 seconds.
TheWitness
on 3 Mar 2021
Boost memory issues are gone. Even updating 12M boost records with 10 process maxes out at about 80MB footprint.
TheWitness
on 19 Mar 2021
Going to mark this one duplicate and close.
TheWitness
on 19 Mar 2021
Boost memory issues are gone. Even updating 12M boost records with 10 process maxes out at about 80MB footprint.
Wow, that sounds really promising!
Thanks for the update, really looking forward to the upcoming 1.2.17 release. :)
Just one thing, you marked it as a duplicate, could you please relate/link the duplicate tickes to each other, so that it's easier to read the related stories ...
bernisys
on 19 Mar 2021
Related issues
anarkia1976
·
3Comments
 dqsuper
·
8Comments
anarkia1976
·
7Comments
dqsuper
·
8Comments
anarkia1976
·
7Comments
 josun-33
·
4Comments
josun-33
·
4Comments
 skyjou
·
6Comments
skyjou
·
6Comments
Most helpful comment
Just finishing a 30k host Cacti install in next two weeks. Then, it'll be ready for release. Polling time around 90-100 seconds.