Cacti: When clicking on Graph Details from an Aggregate Graph Tree node, permission denied notice is shown
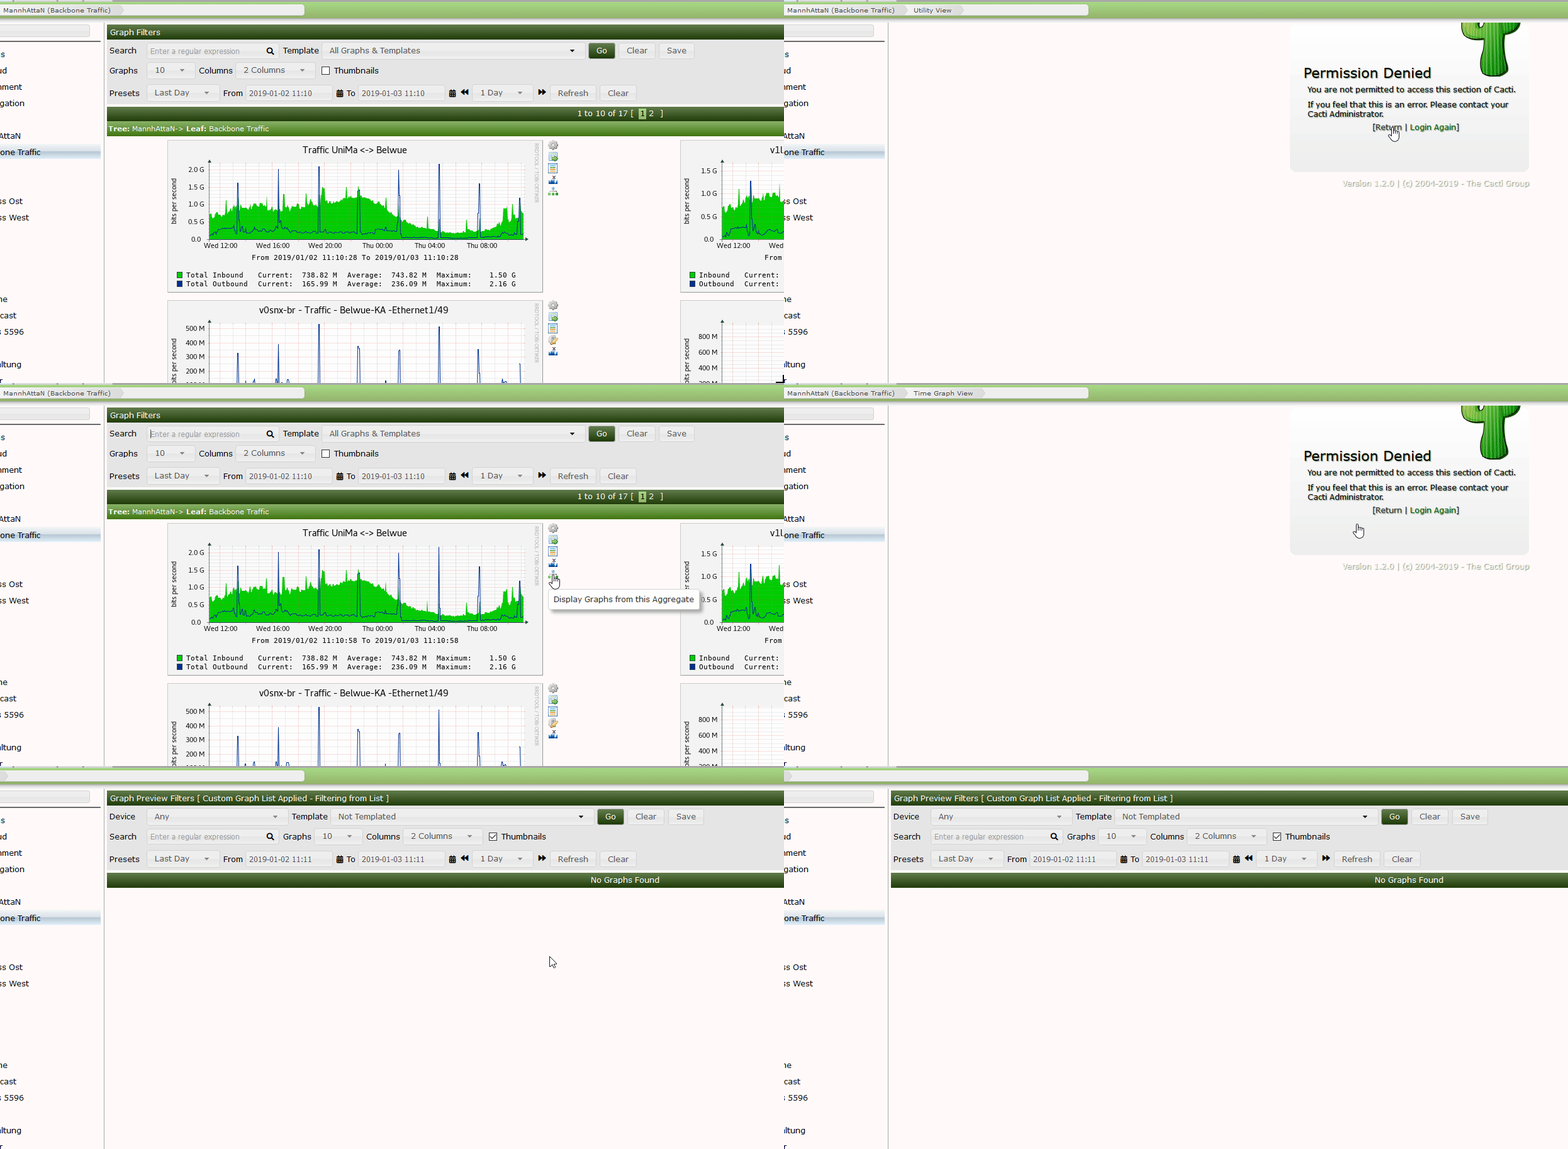
After the Update from 1.1.38 to 1.2.0 i have problems to see the following data from a Aggregate Graph:
- Graph Details
- Time Graph View
- Display Graphs from this Aggregate
With version 1.1.38 all works fine.
Issue only appears with aggregate Graphs.
 DavidLiedke
All 18 comments
I'll take a look. I don't recall a new permission being added for that but have you double checked your account permissions list?
 netniV
on 3 Jan 2019
netniV
on 3 Jan 2019
I'll take a look. I don't recall a new permission being added for that but have you double checked your account permissions list?
Yes i checked my permissions settings.
DavidLiedke
on 3 Jan 2019
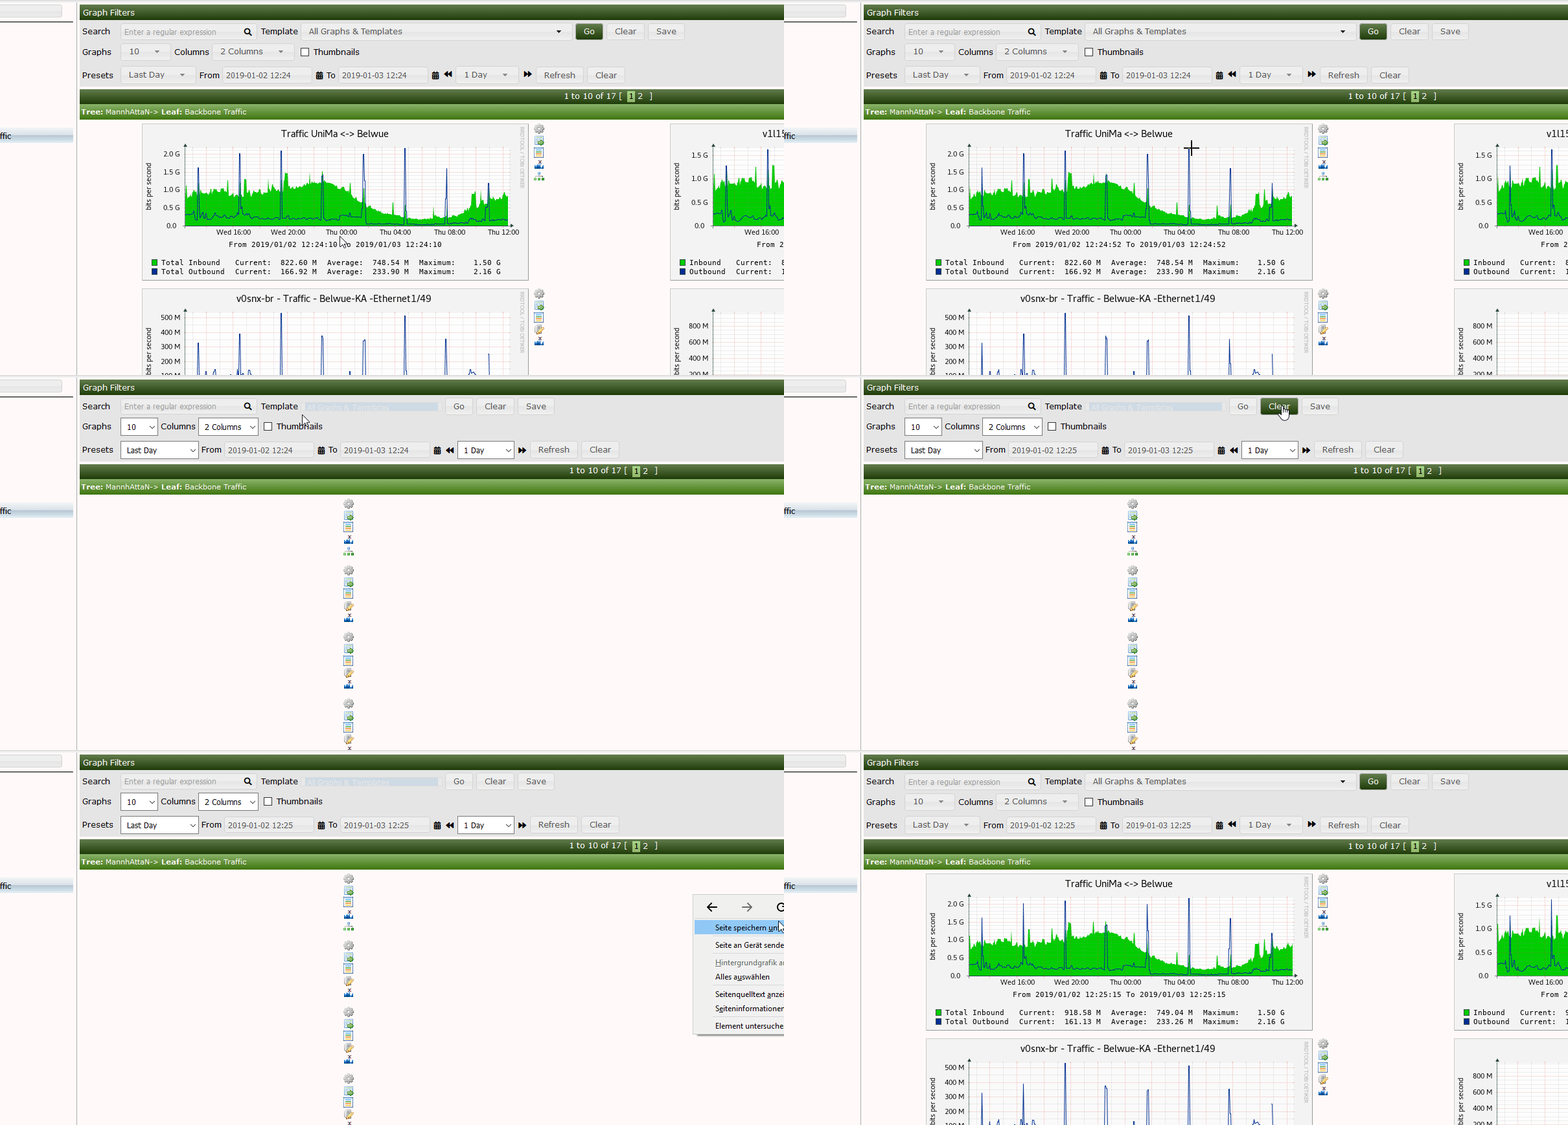
I found a second bug in the web gui:
Checked with Firefox and Google Chrome
DavidLiedke
on 3 Jan 2019
OK, can you report that as a separate issue (may be related but more than likely a different one).
netniV
on 3 Jan 2019
Are there any errors in your cacti log?
netniV
on 3 Jan 2019
Are there any errors in your cacti log?
No errors / warnings etc in the cacti log.
DavidLiedke
on 3 Jan 2019
I can confirm that this appears to be an issue with Aggregate graphs but ordinary graphs are OK.
netniV
on 3 Jan 2019
This appears to be because the code is looking for a template. Am I correct in assuming that your aggregate graph does not have a template? (mine didn't).
netniV
on 3 Jan 2019

DavidLiedke
on 3 Jan 2019
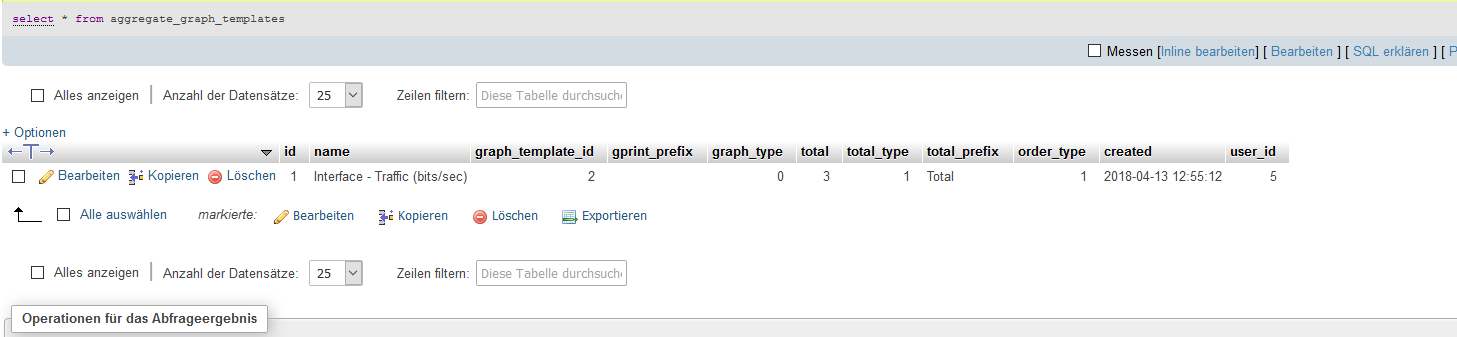
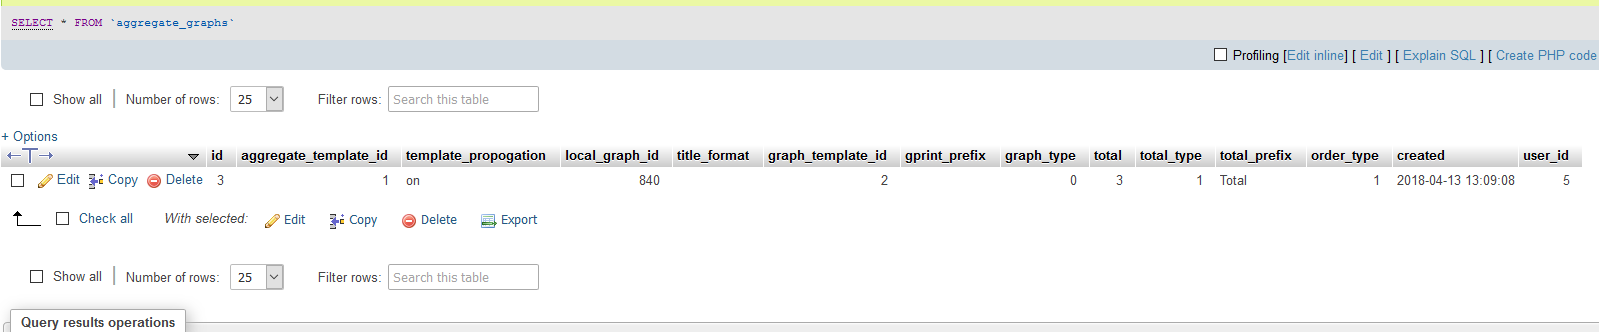
Can you run the following two SQL commands for me?
select * from aggregate_graphs where id = 843;
select * from aggregate_graph_templates;
select * from aggregate_graphs where id = 843;

Where do you get the id 843 ? Do you mean 840 ?
select * from aggregate_graph_templates;
DavidLiedke
on 3 Jan 2019
Yes I did. Sorry, it was my monitor and my bad eyesight :)
netniV
on 3 Jan 2019
DavidLiedke
on 3 Jan 2019
I think it might be better to get a db dump for analysis. Permissions seem to work on my system. It has to be some combination of security settings.
 cigamit
on 3 Jan 2019
cigamit
on 3 Jan 2019
Give me an mail adress and i will send you an dump of the database.
DavidLiedke
on 3 Jan 2019
send it to [email protected] so that we can both receive it.
netniV
on 3 Jan 2019
@DavidLiedke, I think I may have found the issue. Can you please get the latest lib/auth.php from the develop branch and try that out?
netniV
on 3 Jan 2019
Perfect - with the latest lib/auth.php it works :) Thanks @netniV
DavidLiedke
on 4 Jan 2019
Related issues
 interduo
·
6Comments
interduo
·
6Comments
 anarkia1976
·
3Comments
anarkia1976
·
7Comments
anarkia1976
·
3Comments
anarkia1976
·
7Comments
 barreljan
·
3Comments
barreljan
·
3Comments
 dqsuper
·
8Comments
dqsuper
·
8Comments