Cacti: Enhance scalability for large scale deployments
Hi Everyone,
I am currently deploying a modestly large Cacti implementation, nothing too extreme but still I found on my way a roadblock given by processing power.
I have an 8 Gig RAM with 4 vCPU VM carved out of our ESX server with something like 80 Gig of disk space, these specs are dedicated only for CACTI
I have 5 pollers, and a total of 10K data sources distributed on 648 devices (and counting).
The problem is that I have 227 of the devices being polled by the main cacti poller (that also is tasked to actually store all the remote pollers data) and it simply could not proceed further, cpu spiked between 120% to 200% for the mysqld process during updates and it got worse when the spine processes where running on the main poller.
My question are the following:
- Are these numbers too much for CACTI?
- Should the main poller be only collecting the remote pollers data by design?
- Should I fine tune something to achieve better perfomance (even...CPU processing well...)
I can provide any further detail you may need to assess this discussion, I hope this may lead to some guidelines in the documentation or in some changes into the design, I will go on with some tests and let you know.
First test will be to relocate all the devices from the main poller to a remote poller and check if the main poller then is capable of handling that load without local polling.
Between polling cycles I see the following alert from 2 of the remote pollers (even if on them the CPU is never above the 10%) , I believe it's about data sources missing data but it's not clear from the logs

Thanks in advance
 g1augusto
All 63 comments
to be honest I think CACTI may not be suited in this distributed fashion for any large deployment, I must confess I am thinking about moving to another direction unless proven wrong and for that I would be sorry:
Here the cpu utilization spike for the mysql process on the main poller, without running any spine process:
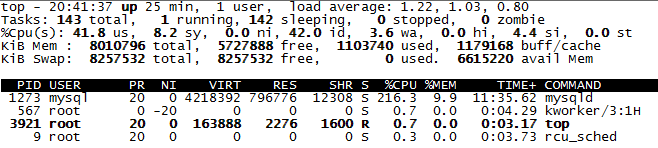
I tried moving the poller_output_boost table to MEMORY and then back to InnoDB without improvements.
Will be waiting for guidance, in case I cannot figure out a solution most probably I will need to move to another NMS, having performance issues monitoring 50% of our network is really worrisome
g1augusto
on 3 Nov 2017
jhonnyx82, I'm not an expert just an advanced user of the product. I run a master server on 2 Xeon 18 Core processors, 128GB DDR4 ram and Raid 6 SSD drives on a stand alone hardware. Your specs look very underwhelming for master server.
I have a master server and 4 pollers.
The only serious problem that I have encountered is that current design heavily rely on master server. That will be rectified in Cacti 1.2.x Until then it is very difficult to poll hosts via remote poller that has high latency over 100ms.

 ikorzha
on 4 Nov 2017
ikorzha
on 4 Nov 2017
Thanks for your feedback,
Do you have a suggestion for the remote poller specs? seems that the requirement for those may be less demanding.
Also, I may have missed it...what are the improvements in version 1.2.x that you are referring to?
g1augusto
on 4 Nov 2017
Just wanted to add that currently we have in production some 0.8 version servers that have lower resources than the new cacti 1.x servers. The 0.8 servers has more or less the same number of devices and show no such problem
g1augusto
on 4 Nov 2017
Version 1.2 hasn't been out but I heard from Cigamit that pollers in 1.2.x will have much greater autonomy. And as the result will act like a stand alone installs. They will maintain their own RRDs and might be even able to process Tholds alarms and send out notifications, how often they will sync with master server is unknown to me.
I personally eagerly awaiting its release to try, it suppose to be in Nov 2017 but probably delayed as Cigamit seems to be busy and absent lately.
I also have 0.8x install that I am migrating from. I have to say it does have a bit better performance if compared to Cacti 1.x with no pollers.
But no one can deny Cacti 1.0 strength a single pane of glass view of entire enterprise via Thold and Monitor plugin, as well as Howie's maps!
ikorzha
on 4 Nov 2017
I noticed too that the Logs tab is mangling the error message about things like 'poller_output_table' not emptied. If you view the log through the Console > Utilities > View Cacti Log, are the messages complete.
Also, on the 'scalability' comment. I know some Cacti systems above 25k hosts, and they run just fine. With the changes planned for 1.2.x, remote polling will be much more scalable. There will be more load on the main database due to some fundamental changes in authentication and authorization in this release, but with todays servers (number of cores) and ssd/nvme disk, it should not be a problem.
Now, relative to timing, I honestly won't have free time until December to get enough time to do anything but spot bug fixes similar to the ones that I have addressed this morning.
Someone needs to encourage Howie to complete Weather Maps for Cacti 1.x. Which in Howies world, that means $$$. Someone please donate to him.
 cigamit
on 4 Nov 2017
cigamit
on 4 Nov 2017
I have to say I love Howie's work but I can't master enough funds to move the needle, in the past tried to donate $100 to him he wasn't interested :)
ikorzha
on 4 Nov 2017
jhonnyx82,
The reason for the increased load right now, is that each data collector is querying the poller_items table which adds more load on the main data collector. Also, the remote data collectors are using the same thread and process count as the main data collector. So, there will be two design changes in the 1.2.x release to address these problems.
1) In the remote data collector, you will have the ability to define the number of processes and the number of threads. The value in Console > Settings > Poller will be the default for all new data collectors. So, the old value becomes a preset only.
2) The remote data collectors will leverage their own poller_items table instead of the main data collectors poller_items table. This will not only make the remote data collectors more responsive, but reduce the load on the main data collector. Right now, that behavior only takes place in offline collection mode.
Currently, with your number of remote data collectors, combined with the process and thread count, that is what is leading you to the higher loads on the main server. You have to be careful, in the near term, that you don't run the system out of database connections. Though, once this change is made, you should see a pretty significant reduction in the main data collectors load.
cigamit
on 4 Nov 2017
Thanks for the comments,
At this point I understand that with Cacti 1.1.x (we will see with 1.2.x) I need more processing power, allow me to ask some questions to help me through this:
First consider that at the time I started having issue the boost table size was around the following :
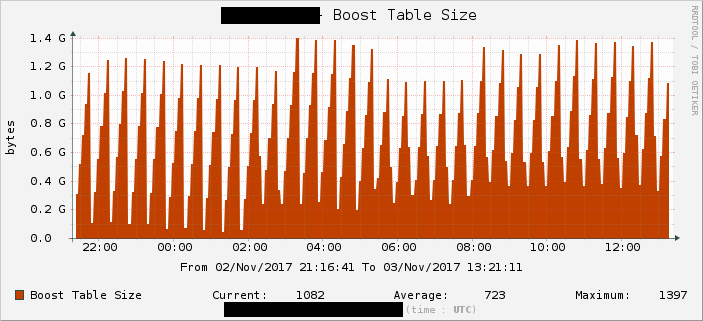
I believe I have done everything right in term of implementation and setup of the system but can you help me validating it or we can safely assume I just need more processing power for the Main poller?, for the number of the monitored device (total 650 and more or less 10K all SNMP get/walk data source and the boost table size ) is this expected?
In case we can agree that I need more hardware, can you suggest what should I request? I am asking this because I may have still a chance to put this into next year budget. It would be good to have an assumption for
- devices: 650 - Data source 10K
- devices: 1000 - Data source 25K
- devices: 1500 - Data source 40K
PS : I think this may be an helpful part of the Cacti 1.x documentation (to justify this thread opened here in Github)
g1augusto
on 4 Nov 2017
Totally agree on the documentation side. We need help from volunteers to contribute to that effort. We are a small team and everyone has a day job presently.
From the sizing perspective, the worlds very largest Cacti users use all solid state disk, some SAS, some SATA, and others on things like PCIe attached, and NVMe. When using Flash disk, it's important to have some redundancy, raid1 is sufficient. I personally have lost multiple systems and learned early on that having a backup is essential in cases where you did not budget such a thing. Actually, I expected it, and in all cases had a backup.
From a memory perspective, that really depends on what 'else' you plan to do on the system. Cacti itself, outside of the RRDfiles, boost and data source cache tables, is not a big consumer of disk space or memory. So, a good 64GB or 128GB server is totally overkill, unless you have other data on the server that causes the MySQL server to grow with lot's of data. For example, if you are using the Syslog plugin, and you plan to hold large amounts of data in the Syslog tables, you will obviously need more memory.
On the memory side, if you have more main system memory than you have RRDfiles, and you have flash disk, boost is almost secondary. It does help from a wear perspective though, and it's required for remote data collection anyway. More memory is always better, but technically, the numbers above are generally acceptable.
So, to answer that question, I just don't have enough information.
Lastly, on the number of cores, well, how can you get a physical server with less than 24 these days? That's more than enough by the way. That's not to say, you could get less than 24. But any real server is going to have dual sockets, a good amount of memory, and rock star disk (PCIe/Flash).
cigamit
on 4 Nov 2017
I was thinking it would help to distibute the BOOST mysql update through various processes, as I am checking that only one process is used and hence I guess that only 1 CPU is used but I may be wrong.
what do you think?
Another alternative, would it be possible to sync boost for times below 30 minutes (that is the minimum allowed I am using now) ?
g1augusto
on 6 Nov 2017
Can I jump into this conversation ?
I'm running into trouble on my cacti, ok I'm still using 0.8.8h due to missing weathermap on 1.x, but here is my situation:
Hosts:1044
DataSources:45817
And I'd like to have more but I don't think I can.
I'm using spine with this config:
Processes:20
Threads:15
Since we have a lot of performance problem on the server I need to talk to the server guy to find a solution, so now I try to find the basic think I need to ask, without looking on what I Have.
Can you give me guidance on cacti version 1.1.x is the way to go ? or wait for 1.2 and to bad for weathermap ?
Do I need to look for more poller, more server ?
So if jhonnyx82 has a large scall cacti config my is starting to be huge one no ?
Thanks for your input, but maybe this can be a talk on the forum
 arno-st
on 8 Nov 2017
arno-st
on 8 Nov 2017
Arno, I would highly recommend jumping on Cacti 1.1.28 the latest. It is stable and offer a number of enhancements vs 0.8.8h I myself in migration stage.
When it comes to Weathermap I have a working Weathermap version for 1.x from before Howie started a major re-write. It is a bit buggy but fully functional for editor and map runs. email me at ikorzha @ gmail com and I will email you a working copy.
ikorzha
on 8 Nov 2017
my situation:
Hosts:1044
DataSources:45817
And I'd like to have more but I don't think I can.
I'm using spine with this config:
Processes:20
Threads:15
Well, as it was stated before, I think that 0.8x cacti has lower requirements than 1.x, as a matter of fact one of my 0.8x cacti server has the following numbers
Hosts : 680
Datasources : 33875
and I am not really having problems, I wish to move to 1.x to consolidate and automate mainly and on that it works very well.
As I mentioned one of the bottleneck looks to be the BOOST table copied back on disk even at 30 min intervals + the incidence of the connection that each spine process makes back to the main CACTI server in version 1.x.
From an internal discussion we were considering that since mariadb/mysql runs on a single process and the BOOST copy to RRD works mainly over one thread (this is my understanding, correct me if I am wrong) it may not get any benefit out of multicores unless the process is distributed between more instances.
I may (most probably) be wrong, but it's just an opinion.
g1augusto
on 8 Nov 2017
I'm looking at making a minor enhancement to the boost process. Right now, boost is a serial process, but it should be quite easily to parallelize it to N processes, but you will have to watch your load average. I think by doing this, the boost process can be sped up by a significant amount.
cigamit
on 11 Nov 2017
Thank you!
g1augusto
on 11 Nov 2017
jhonnyx82, you should consider reducing your number of processes to something smaller. This is also a reason for some of the delay. At some point, the number of concurrent threads hitting the poller_item table will cause contention on that table. Having it on SSD or Flash will reduce some of that pressure of course.
You can view this by showing a custom crafted 'show processlist' command in a loop while the poller is running. You will find some queries that are potentially delayed for several seconds. This is another reason that the 1.2.x design is so important. We take pressure off of the poller_items table by distributing it across the remote data collectors.
Again, this activity will not be started until some time in December. I may have a patch for boost ahead of that though as I started working on it last night.
cigamit
on 11 Nov 2017
Thanks for the info/suggestions,
I have the pollee item as a memory tae, I guess it will help.
Also I would like to validate your suggestion about thw number of process/threads but I need help on the custom process list you mentioned.
g1augusto
on 11 Nov 2017
Well, first, poller_item as InnoDB would actually be better, there will be less blocking actually. I know some very large sites that poll with 2-3 processes and 30 threads just fine. 90 threads is generally good enough. If you have some hosts/devices that have long polling time, spine should prioritize them first.
cigamit
on 12 Nov 2017
Again SSD helps. SSD is as fast as a memory table actually.
cigamit
on 12 Nov 2017
Thanks for your input, allow me to provide an update:
I am currently running 60% of the network devices I intend to monitor, 2 remote pollers are in another continent (ASIA and NA) while 2 are on the same continent as the main poller (not the same site of course).
All data source are retrieved correctly with the same hardware I described earlier
8 Gig RAM with 4 vCPU VM carved out of our ESX server with something like 80 Gig of disk space

I have reduced the proces # from 4 to 3 with 30 threads max for spine ( I am considering going down to 2 in case I will see performance issues).
With the recent network devices monitored added, BOOST table grown to 1.5 GB
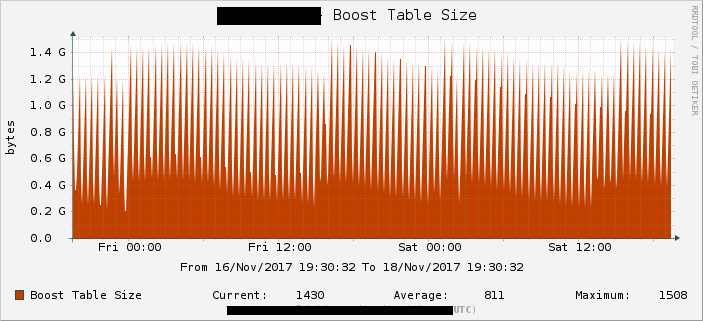
and I have verified through NETFLOW collected data that the amound of bandwidth required _inbound_ is 1.1 Mbit/s
I was surprised to check with the same Netflow collector that there is a 1.6 Mbit used for outbound traffic from the main poller to the remote pollers, I would expect the inbound to be higher...
So besides the report here my questions, with an eye to the next release:
- Is regular this amount of outbound data traffic? is it related to the spine process? will it change with upcoming next releases of CACTI? (referred to higher remote poller independency from the main poller)
- Will inbound bandwidth requirements be reduced with the upcoming releases of Cacti? (Still about remote pollers being more independent and as I read, having their own RRD files)
- If RRD files will also be on the remote pollers (just a rumor I read somewhere) how the interconnection and visualization will work ?
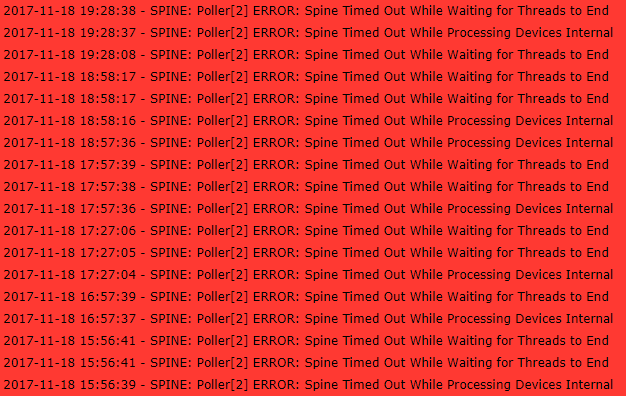
- Is this amount of BOOST table going to cause an issue if growing more? will there be a BOOST copy improvement (multi process) in the upcoming releases ? I notice that one of my poller has an increased number of error at the same time that the main poller performs a BOOST copy process SPINE: Poller[2] ERROR: Spine Timed Out While Waiting for Threads to End (see below). Is there a way to see which data sources are impacted by this?
_Main Poller_
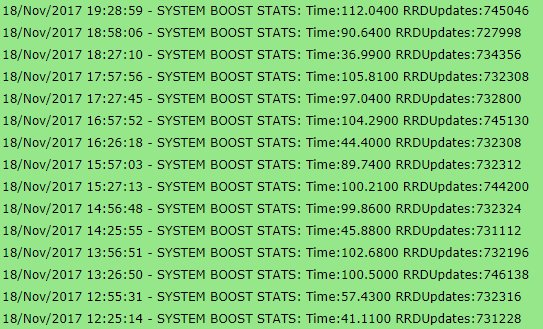
_Remote Poller_
g1augusto
on 18 Nov 2017
Those errors are due to the face that the data collection is not completing in a timely manner. Need more data to establish a correlation. The multi-process boost won't actually help the poller times at all, just the boost times. The boost table can grow up until you don't have more physical memory (for memory engine), or disk with InnoDB.
cigamit
on 19 Nov 2017
Another point, for future release (like 1.2 when I get to it), would be to track the data collectors min/avg/max timing over time, so you can find the problem data collector.
cigamit
on 19 Nov 2017
The first part of this performance enhancement is done here https://github.com/Cacti/cacti/commit/d3690a96935ddef52063277f8abfde2b73fce61a This moves processes and threads to the data collector. There is a corresponding spine change that will be put in place within the next day or so.
cigamit
on 20 Nov 2017
Thanks for your help, just came to mind something I forgot to ask from one of your reply:
Is it a good idea to move the poller_item table to MEMORY? Any reason to NOT do that?
jhonnyx82, you should consider reducing your number of processes to something smaller. This is also a reason for some of the delay. At some point, the number of concurrent threads hitting the poller_item table will cause contention on that table. Having it on SSD or Flash will reduce some of that pressure of course.
g1augusto
on 26 Nov 2017
jhonnyx82, I'm not an expert just an advanced user of the product. I run a master server on 2 Xeon 18 Core processors, 128GB DDR4 ram and Raid 6 SSD drives on a stand alone hardware. Your specs look very underwhelming for master server.
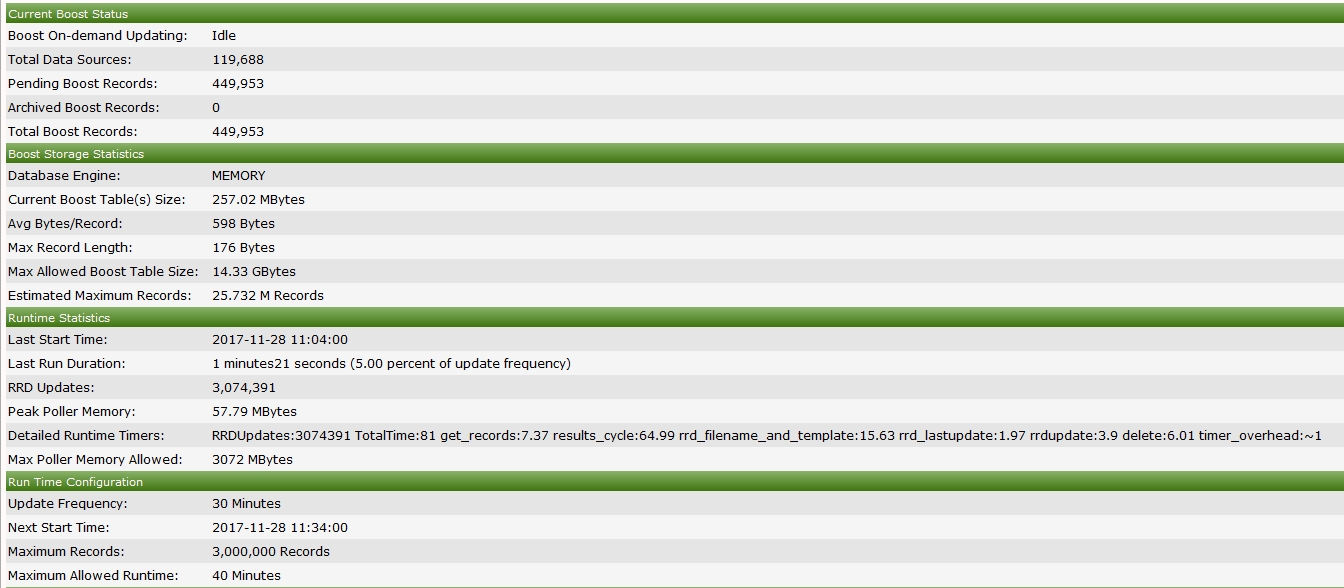
@ikorzha Can you give me more details about your hardware specs? I am going to request dedicated hardware for the master server, also can you tell me if you are running at _1 minute or 5 minutes_ polling interval ?
g1augusto
on 28 Nov 2017
I am running 1min polling

I also run boost in memory as to not to wear SSDs prematurely
ikorzha
on 28 Nov 2017
Thanks a lot,
Can you also post the hardware detail? like
- server model
- ram
- disks # and RAID used
- cpu model and number
Will help me making a request to our management for approvals.
g1augusto
on 28 Nov 2017
719064-B21 HP HPE ProLiant DL380 Gen9 8SFF Configureto-
order Server
Part NumberDescriptionQty
719064-B21HPE DL380 Gen9 8SFF CTO
Server1
817963-B21HPE DL380 Gen9 E5-2697v4
Kit2
805353-B21HPE 32GB 2Rx4 PC4-2400T-L
Kit3
749974-B21HP Smart Array P440ar/2G FIO
Controller1
690827-B21HP 400GB 6G SAS ME SFF SSD
6
720478-B21HPE 500W FS Pwr Supply Kit2
733660-B21HP 2U SFF Easy Install Rail Kit1
ikorzha
on 28 Nov 2017
Thank you again,
this will help me making a request.
I suppose you use also plugins like weathermap - syslog - thold - without having gaps on your graphs
g1augusto
on 28 Nov 2017
I absolutely use these plugins without any gaps in the charts :)
ikorzha
on 28 Nov 2017
Where can I get the table with the polling report ? (the one like ikorzha has )
thanks
arno-st
on 4 Dec 2017
Where can I get the table with the polling report ? (the one like ikorzha has )
You can find it here:

g1augusto
on 4 Dec 2017
Hi everyone,
wanted to give an update here about this topic:
I am currently still running the master poller from the original VM specs I provided at my first post, but I moved to 5 minutes polling.
Any synchronization problem is not happening anymore and even if the graph population of my system is still not at 100% it looks relatively OK
What I am experiencing is that certain graphs has a 30 minutes gap time by time and not always the same, most of them are coming from the poller that holds most of the Data sources.
I tried inreasing the number of processes for spine but I could not really see a benefit
g1augusto
on 22 Dec 2017
Update:
I will receive soon dedicated server to run the CACTI main poller.
I will migrate the whole thing there and will let you know if the gaps I am seeing currently using the VM will disappear.
In case not I hope you can give me an hand on check what could be fine tuned.
Thanks in advance!
g1augusto
on 26 Jan 2018
UPDATE :
We are going to setup the new physical CACTI main server, we would like to perform in advance some optimization of the Filesystem before migrating from the VM, we are considering mainly the MariaDB cacti database folder and the RRD folder for CACTI.
I would like to not change the default path so we will just mount these folders on a separate filesystem, do you have any recommendation and guidelines on how to improve the overall performance from this point of view (PS: we will have 2x SSD DISKS).
Something that comes in mind is noatime and nodiratime for both the FS for MariaDB and the RRA cacti folder FS
g1augusto
on 7 Feb 2018
SSD is the only way to go. Just follow the recommendations in the installer. It walks your through the settings by the number. Hard to get it wrong.
cigamit
on 8 Feb 2018
UPDATE:
New Physical server is arrived and I just migrated the configuration from the virtual one.
I am going to move the polling for many devices on the physical server but I am waiting for the enhancement to set the number of SPINE threads per poller rather than for all pollers.
I will let you know if the gaps will reduce and how the whole system performs with the increase in the number of polled devices
Thanks!
g1augusto
on 12 Feb 2018
UPDATE:
After running on the new main poller hardware for all night I can see that the overall situation has improved but still I see some 30 minutes long gaps on certain data sources :
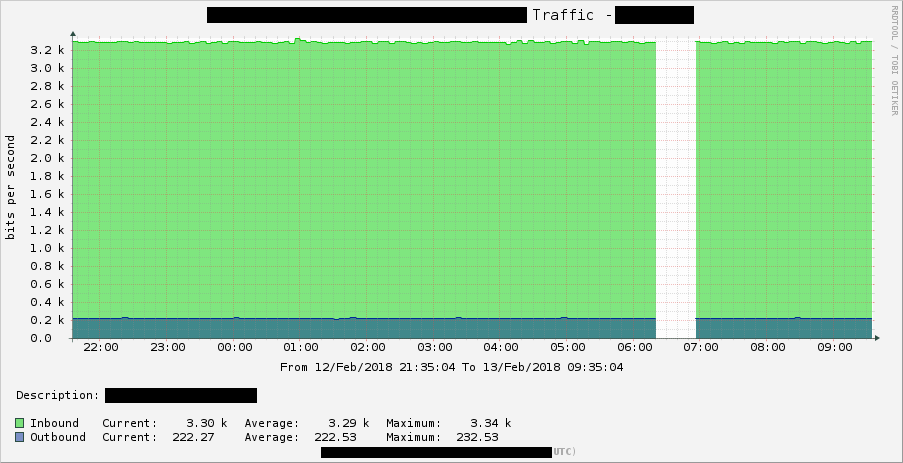
Now this specific graph is from a device polled directly from the main poller, and giving the length of the gap I suppose is due to the BOOST writing process (that is set to run every 30 minutes).
Is there anyway to monitor if this happens because of that, or there is anything we can do to avoid it?
Thanks in advance
@netniV and @cigamit and @ikorzha : what do you think?
g1augusto
on 13 Feb 2018
Can you enable "debug logging" and check what type of errors do you have in this time frame?
I have 2 virtual cacti instances (main and poller) over mpls network and i don't have gap problems.

 anarkia1976
on 13 Feb 2018
anarkia1976
on 13 Feb 2018
Can you enable "debug logging" and check what type of errors do you have in this time frame?
I would do that with selective file debug, do you know which file should I debug to limit the amount of logs to the necessary ones ?
g1augusto
on 13 Feb 2018
Under settings:
Generic Log Level -> debug
Poller Syslog/Eventlog Selection -> errors
Web Events -> developer
You have to find logs related to the time frame issue.
anarkia1976
on 13 Feb 2018
I think this would generate debug logs for everything, cannot it be scoped to what is needed only?
g1augusto
on 13 Feb 2018
If you use the Selective File debug rather than the debug log level, that will only debug any cacti_log statement used within that file. Since poller.php actually calls other files to do the work, such as spine, cmd.php, script_server.php etc. I think should only log those parts that occur within poller.php.
 netniV
on 13 Feb 2018
netniV
on 13 Feb 2018
it could be that someone viewed the graph from the web, and the web user did not have access to write the data. That is required when using the performance boost feature. The web user needs write permissions. If you poller is running as one user, and the web as another, there is a published technique on the forums to allow the Apache user and the poller user to both write, otherwise, make the accounts the same.
cigamit
on 13 Feb 2018
Thanks for your replies,
some responses:
it could be that someone viewed the graph from the web, and the web user did not have access to write the data. That is required when using the performance boost feature. The web user needs write permissions. If you poller is running as one user, and the web as another, there is a published technique on the forums to allow the Apache user and the poller user to both write, otherwise, make the accounts the same.
In my installation the user running the CACTI polling process and the httpd user are member of each other's group and the way RRD files are created, they have owner and group rw privileges, owner is the user for cacti, group is the httpd user group. I think it should be fine
If you use the Selective File debug rather than the debug log level, that will only debug any cacti_log statement used within that file. Since poller.php actually calls other files to do the work, such as spine, cmd.php, script_server.php etc. I think should only log those parts that occur within poller.php.
I am going to set the following debugs :
- Generic Log Level:
- LOW
- Selective Plugin Debug :
- poller.php
- Selective Plugin Debug
- none
- Selective Device Debug
- none
- Poller Syslog/Eventlog Selection
- Errors
@netniV and @cigamit : will this be OK ?
g1augusto
on 13 Feb 2018
I would be looking for any errors in the log related to gaps in polling, then there is a boost debug file area in Settings > Performance at the very bottom. That is where boost debug log will go. Without a detailed analysis of your log's, it will be hard to debug. If your database is on flash and you are running MySQL 5.6+ or MariaDB 10+, you can convert the poller_output_boost table to InnoDB without worry.
The 1.2 enhancement for threads and processes at the data collector level, you should be able to chisel in before the 1.2 release. I won't have time till the weekend to help you with that though.
cigamit
on 13 Feb 2018
I just noticed that from the virtual to physical server migration I forgot to set a parameter I had on the virtual one:
Maximum Data Source Items Per Pass in the boost settings was set to 10,000 and now I set it to 100,000 as with the new hardware I guess it should be able to accomodate it.
I will give it a run and today or tomorrow I will set the log level as agreed, just I would like to know if these log level settings are fine to collect the necessary log data:
- Generic Log Level:
- LOW
- Selective Plugin Debug :
- poller.php
- Selective Plugin Debug
- none
- Selective Device Debug
- none
- Poller Syslog/Eventlog Selection
- Errors
Just asking to not waste time on providing some evidence.
PS : Boost Debug Log is populated but until now I got no logs written in there, does it write only when the log level is set to debug? with the settings above will it write some logs in there?
Thanks,
g1augusto
on 13 Feb 2018
I thought they would write simply be the presence of the file. However, I have not reviewed that code in quite a long time.
cigamit
on 15 Feb 2018
Update:
I have not yet applied the debugs on the main poller but the Maximum Data Source Items Per Pass set to 50,000 (default) seems that gave some improvements as I could see only some gaps in the last 24 hours against much more when I had the old value of 10,000.
now about the debugs: I should enable them and leave the server then go and look at the timestamp of one of the occurrences (as it does not happen at regular intervals) and since I need to have this server in production now, can you validate that the debug settings I listed before will be ok and will not make the server unusable or generate false positives ?
Thanks in advance, I will be waiting for your much appreciated thoughts
g1augusto
on 15 Feb 2018
Okay, the first half of this is done. I still have to update spine, and create a periodic full sync column and setting to perform a full sync periodically in background.
cigamit
on 23 Sep 2018
Thank you,
this is great news indeed!
Just to give an update, I am running in a quite stable condition with dedicated hardware for the main poller for a while now

Again number of DS is not too extreme but on top of that there is THOLD (nice job, some room for improvement but very nice) and @howardjones Weathermaps (well that to try and build a use case to try and get some support to have it into our network, hardly without GUI :( )
I know you are working hardly on the release 1.2 and that is really an achievement, but along with that can you find some time to publish some guidelines on how to upgrade _safely_ from 1.1.38 to 1.2 (final) ? It would help a lot.
g1augusto
on 23 Sep 2018
This has reminded me that I haven't done any testing with multiple pollers :-)
 howardjones
on 23 Sep 2018
howardjones
on 23 Sep 2018
@jhonnyx82, this is pretty stable at the moment. Though please note, I have to finish spine yet. You should just be able to upgrade your primary system to 1.2, and that upgrade should cascade to all the remote data collectors automatically. So, basically, you only have to upgrade one system. How's that. Now, don't just go out and upgrade your production system without setting up a parallel installation and calling me a liar first. That system won't upgrade all tables, so you should manually run the upgrade_database.php script from data collector (I will attempt to add this to the things to be done before release).
This information and much more needs to be added to the documentation of course and the cron user needs write access to the web site of course to cascade the upgrade.
Before upgrading, you should perform a full sync from the primary server to all remote data collectors so that data collection is not impacted immediately after upgrade.
Once the change is complete, offline mode will continue to work as before. The primary changes in behavior are as follows:
1) The remote data collectors leverage the concurrent process and thread limits of the data collector, the two settings are no longer global
2) Each data collector will obtain it's poller_items from the local database
3) Each data collector will bulk insert into the central servers poller_output and poller_output boost tables in online mode. In offline mode, they will continue to dump locally as before.
4) The remote data collectors will bulk publish host uptime, etc. details to the central server after polling is complete
5) The remote data collectors will bulk publish rrd_next_step to the central server after polling is complete.
6) The central server will periodically perform a bulk synchronization, which right now is service impacting (though I'm looking for a way that is not). You can control the frequency of this bulk full sync from Settings > Poller.
That's all I have as an update for now.
cigamit
on 25 Sep 2018
Thanks, this is really gold
I will be waiting that you complete the _spine_ update to match this and when you will feel comfortable that 1.2.x is good for release then I will start this new _journey_ into it, as it comes something will require fixes so I will have to make sure to prep my backups well (including RRD files this time!) :)
nice job really
g1augusto
on 25 Sep 2018
Latest spine working flawlessly with the new design. Put a fork in it. @jhonnyx82, it would be nice to see how load and traffic changes with this update. Main server load should drop pretty heavily.
cigamit
on 26 Sep 2018
UPDATE: seems like the upgrade process didn't update all files on the remote pollers, so forced a run now. Looks good now.
 thurban
on 8 Oct 2018
thurban
on 8 Oct 2018
I would have thought starting a script server would be occurring on a thread of it's own to keep things concurrent.
netniV
on 8 Oct 2018
I think you should open that as a new issue @thurban and we can track it separately.
netniV
on 8 Oct 2018
I can confirm that this has indeed a huge positive effect on polling times. Using latest spine and cacti reduces remote polling time by up to 90%.
Great work. and sorry for the confusion
thurban
on 8 Oct 2018
Wow, that's good to hear!
netniV
on 8 Oct 2018
@thurban, but does the script server comment still apply? Please advise, then if it does, open a separate ticket as @netniV suggested. 90% is awesome by the way.
This change should also allow some interesting horizontal scaling opportunities as well since once of the largest scaling issue is contention between threads getting to the poller_items table, which are now separated by data collector therefore reducing contention.
cigamit
on 8 Oct 2018
No ignore the Script Server comment I had earlier. It was a manual/human error.
thurban
on 8 Oct 2018
Related issues
 imax64
·
8Comments
imax64
·
8Comments
 skyjou
·
6Comments
anarkia1976
·
3Comments
skyjou
·
6Comments
anarkia1976
·
3Comments
 riversdev0
·
3Comments
riversdev0
·
3Comments
 Initarts
·
6Comments
Initarts
·
6Comments
Most helpful comment
Latest spine working flawlessly with the new design. Put a fork in it. @jhonnyx82, it would be nice to see how load and traffic changes with this update. Main server load should drop pretty heavily.