Azuredatastudio: unsaved tabs crashing
- Azure Data Studio Version:
Version: 1.9.0 (system setup)
Commit: 78a42e1d112ae3231777722b51eaf44f83ddbe55
Date: 2019-07-10T04:31:36.998Z
VS Code 1.34.0
Electron: 3.1.8
Chrome: 66.0.3359.181
Node.js: 10.2.0
V8: 6.6.346.32
OS: Windows_NT x64 10.0.17134
Steps to Reproduce:
- open a new sql tab
- write some tsql code and connected to an instance
- after some idle time, the pop with the error message shows up and the tab closes automatically
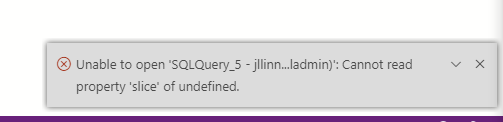
Error: Unable to open 'SQLQuery_1 - *...grated)': Cannot read property 'slice' of undefined.
Note: the problem occurs rarely.
 anand348
All 24 comments
@brentwc
 hfleitas
on 15 Aug 2019
hfleitas
on 15 Aug 2019
I would say this occurs for me about once to twice a week? This will also happen on tabs where the query has been saved previously.
Version: 1.10.0 (user setup)
Commit: 5fdb967ffcea41df0335ec17cfa396a694bb174e
Date: 2019-08-14T18:28:10.311Z
VS Code 1.37.0
Electron: 4.2.7
Chrome: 69.0.3497.128
Node.js: 10.11.0
V8: 6.9.427.31-electron.0
OS: Windows_NT x64 10.0.18362
 dzsquared
on 20 Aug 2019
dzsquared
on 20 Aug 2019
could be related #7177
 anthonydresser
on 17 Sep 2019
anthonydresser
on 17 Sep 2019
This just happened to me. Quite frustrating.
Version: 1.12.1 (user setup)
Commit: cccb9327c707fe71de24d5ce655acb29cc8946d1
Date: 2019-10-07T21:49:53.568Z
VS Code 1.37.0
Electron: 4.2.9
Chrome: 69.0.3497.128
Node.js: 10.11.0
V8: 6.9.427.31-electron.0
OS: Windows_NT x64 10.0.17134
 bsmithart
on 10 Oct 2019
bsmithart
on 10 Oct 2019
frequently encountering this issue.
 BHARATH1986-A1
on 27 Nov 2019
BHARATH1986-A1
on 27 Nov 2019
Is there any way to open the closed file?
BHARATH1986-A1
on 27 Nov 2019
Still happing.
 danilo900
on 13 Jan 2020
danilo900
on 13 Jan 2020
This is also still happening to me as well about once or twice a week, and I am losing important queries that I was not planning on saving, but just working on temporarily. I am unfortunately unable to use ADS until this issue is resolved.
Version: 1.14.1 (user setup)
Commit: f9b968c1ae514a0d1210788629e1c69125857279
Date: 2019-12-24T02:42:26.303Z
VS Code: 1.38.0
Electron: 6.1.5
Chrome: 76.0.3809.146
Node.js: 12.4.0
V8: 7.6.303.31-electron.0
OS: Windows_NT x64 10.0.18362
 stelth240
on 15 Jan 2020
stelth240
on 15 Jan 2020
When this happens could you post the error from the logs? F1 -> Developer: Show Logs -> Window
anthonydresser
on 15 Jan 2020
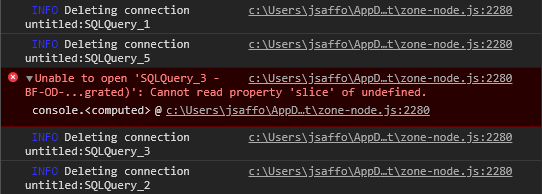
Hi Anthony, thank you for responding. I just had another tab crash, but the Window log does not show any errors. SQLQuery_3 was the tab that crashed, right after I closed SQLQuery_5. Here is the log anyway just in case, and a screenshot of the developer tools error.
2020-02-04 14:01:55.861] [renderer1] [info] Creating new connection untitled:SQLQuery_3
[2020-02-04 14:01:55.861] [renderer1] [info] Adding connection untitled:SQLQuery_3
[2020-02-04 14:01:55.861] [renderer1] [info] Successfully added connection untitled:SQLQuery_3
[2020-02-04 14:13:53.211] [renderer1] [info] Creating new connection untitled:SQLQuery_5
[2020-02-04 14:13:53.212] [renderer1] [info] Adding connection untitled:SQLQuery_5
[2020-02-04 14:13:53.214] [renderer1] [info] Successfully added connection untitled:SQLQuery_5
[2020-02-04 15:29:38.564] [renderer1] [info] Deleting connection untitled:SQLQuery_1
[2020-02-04 15:30:26.200] [renderer1] [info] Deleting connection untitled:SQLQuery_5
[2020-02-04 15:30:26.230] [renderer1] [info] Deleting connection untitled:SQLQuery_3
[2020-02-04 15:30:57.877] [renderer1] [info] Deleting connection untitled:SQLQuery_2
stelth240
on 5 Feb 2020
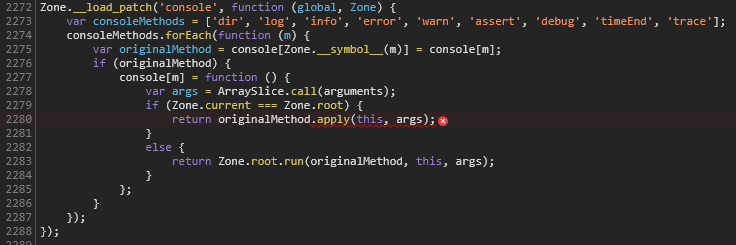
This is the JS code that it says is failing. Not sure if this is relevant or if it helps, but I thought I would post it just in case.
stelth240
on 5 Feb 2020
I'm seeing this issue in ADS as well. I'll have an (unsaved) query editor open with results, switch to another query editor or dashboard, then when I attempt to return to the query editor the tab disappears and I get "cannot read property 'slice' of undefined"
Same dev console logs as above except my instance is a system install.
Version: 1.15.0 (system setup)
Commit: e57eb999fc5f1e000477da8fe0b8679ff0bfd57b
Date: 2020-02-12T20:48:43.389Z
VS Code: 1.42.0
Electron: 6.1.6
Chrome: 76.0.3809.146
Node.js: 12.4.0
V8: 7.6.303.31-electron.0
OS: Windows_NT x64 10.0.19569
Edit: it just happened again, and it happened to be the same query editor that crashed. I'm now paranoid that it has something to do with the multiple results sets or the XML in the results sets.
dzsquared
on 28 Feb 2020
Hi @kburtram, is there any update on this issue? I am currently unable to use the software due to potential loss of work from this bug. Thank you.
stelth240
on 17 Jun 2020
@stelth240 unfortunately the error message provided doesn't give enough information to go on. Basically it says we're calling slice somewhere with a null object, which could be one of numerous places in the code. The Zone code is a wrapper to handle calls that cross an isolation boundary and isn't the actual source of the error. I haven't been able to repro this yet, but some mentioned that perhaps force killing Azure Data Studio could force this bug to occur, but I haven't had a chance to test that out. I'll take a look again to try to repro.
 kburtram
on 17 Jun 2020
kburtram
on 17 Jun 2020
@kburtram Thanks for the reply. I actually did find where I think the error is occurring based on the error message that is thrown. Maybe that will help trace back to the root issue. It is in the "vs" folder under "src", so is it something that the vscode team would need to fix?
Here is the line with the error that is emitted, on method "doHandleOpenEditorError":
That method seems to be called from one location only, this line on method "doShowEditor":
stelth240
on 17 Jul 2020
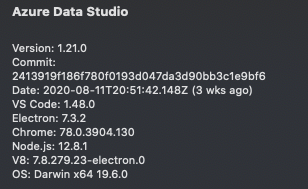
error also occurs on mac.
 bwilson-cjusd
on 2 Sep 2020
bwilson-cjusd
on 2 Sep 2020
I'm seeing the same issue. It seems to mostly happen on one file which was saved previously. I can open the file, run the query, then change tabs and leave it for a while - at which point when I try switching back to the tab it will crash with the same error.

I'm getting a ton of stack traces like the one below in Log (Window) but I don't know if it's related.
[2020-09-15 20:16:30.608] [renderer1] [error] TreeError [MarkersView] Tree element not found: [object Object]: Error: TreeError [MarkersView] Tree element not found: [object Object]
    at new i (file:///C:/Users/USER_NAME/AppData/Local/Programs/Azure Data Studio/resources/app/out/vs/workbench/workbench.desktop.main.js:127:950) [<root>]
    at t.ObjectTreeModel.getElementLocation (file:///C:/Users/USER_NAME/AppData/Local/Programs/Azure Data Studio/resources/app/out/vs/workbench/workbench.desktop.main.js:218:613) [<root>]
    at t.ObjectTreeModel.setCollapsed (file:///C:/Users/USER_NAME/AppData/Local/Programs/Azure Data Studio/resources/app/out/vs/workbench/workbench.desktop.main.js:217:855) [<root>]
    at j.expand (file:///C:/Users/USER_NAME/AppData/Local/Programs/Azure Data Studio/resources/app/out/vs/workbench/workbench.desktop.main.js:1509:277) [<root>]
    at H.autoReveal (file:///C:/Users/USER_NAME/AppData/Local/Programs/Azure Data Studio/resources/app/out/vs/workbench/workbench.desktop.main.js:8931:818) [<root>]
    at H.onActiveEditorChanged (file:///C:/Users/USER_NAME/AppData/Local/Programs/Azure Data Studio/resources/app/out/vs/workbench/workbench.desktop.main.js:8928:842) [<root>]
    at file:///C:/Users/USER_NAME/AppData/Local/Programs/Azure Data Studio/resources/app/out/vs/workbench/workbench.desktop.main.js:8927:715 [<root>]
    at file:///C:/Users/USER_NAME/AppData/Local/Programs/Azure Data Studio/resources/app/out/vs/workbench/workbench.desktop.main.js:190:827 [<root>]
    at c.fire (file:///C:/Users/USER_NAME/AppData/Local/Programs/Azure Data Studio/resources/app/out/vs/workbench/workbench.desktop.main.js:194:423) [<root>]
    at F.doHandleActiveEditorChangeEvent (file:///C:/Users/USER_NAME/AppData/Local/Programs/Azure Data Studio/resources/app/out/vs/workbench/workbench.desktop.main.js:7989:92) [<root>]
    at F.handleActiveEditorChange (file:///C:/Users/USER_NAME/AppData/Local/Programs/Azure Data Studio/resources/app/out/vs/workbench/workbench.desktop.main.js:7988:882) [<root>]
    at file:///C:/Users/USER_NAME/AppData/Local/Programs/Azure Data Studio/resources/app/out/vs/workbench/workbench.desktop.main.js:7989:202 [<root>]
    at c.fire (file:///C:/Users/USER_NAME/AppData/Local/Programs/Azure Data Studio/resources/app/out/vs/workbench/workbench.desktop.main.js:194:423) [<root>]
    at file:///C:/Users/USER_NAME/AppData/Local/Programs/Azure Data Studio/resources/app/out/vs/workbench/workbench.desktop.main.js:8228:665 [<root>]
The most recent error in that window log after the problem occurs and I see the error pop-up, though, are these:
[
2020-09-15 21:22:24.781] [renderer1] [error] An unknown error occurred. Please consult the log for more details.
[2020-09-15 21:22:33.585] [renderer1] [error] An unknown error occurred. Please consult the log for more details.
[2020-09-15 21:23:37.538] [renderer1] [error] An unknown error occurred. Please consult the log for more details.
[2020-09-15 21:23:41.789] [renderer1] [error] An unknown error occurred. Please consult the log for more details.
[2020-09-15 21:23:49.722] [renderer1] [error] An unknown error occurred. Please consult the log for more details.
[2020-09-15 21:23:55.931] [renderer1] [error] An unknown error occurred. Please consult the log for more details.
Of course this is IN the log, so I'm not sure what I'm supposed to consult for more details.
 ScriptPup
on 16 Sep 2020
ScriptPup
on 16 Sep 2020
this happens to me couple times a week :*(
 mrjrdnthms
on 17 Sep 2020
mrjrdnthms
on 17 Sep 2020
This has happened to me seemingly randomly over the past year or so, and just happened to me again twice today, both on unsaved tabs. This time it was a tab with the same name twice.
The window log was useless and had nothing in it, but the developer tools gave me the following error:

I still don't know how to reliably reproduce this issue (as in, I don't know what triggers it), but hopefully this screenshot of the error helps track down this issue.
Another thing I should note is that I always see this error when I'm trying to switch to the tab that crashes.
 Kanmuri
on 4 Nov 2020
Kanmuri
on 4 Nov 2020
It happened again just now. Similar error as last time, but with a slightly different stack trace:

I had just saved another tab (to a new file) and was switching back to "SQLQuery_1" to check something when that tab crashed and gave me that error.
Kanmuri
on 19 Nov 2020
Happened again, just now. Here's the stack trace this time:

Looks like it's the same as last time.
So what happened before this error?
I went to a tab I had an opened saved file in that I hadn't switched to for a few hours, and did a Save As to save it with a different name so I could make some tweaks to it for a task I'm working on, and when I switched back to the last unsaved tab I was in (with Ctrl+Tab) right after the save, that unsaved tab then crashed.
I had a similar sequence of events for the last crash I reported, so hopefully this helps narrow things down a bit.
Kanmuri
on 2 Dec 2020
Any additional logs or details that would help troubleshoot this? I have it re-occur frequently enough in ADS that it is unproductive.
 hillsrobin
on 30 Dec 2020
hillsrobin
on 30 Dec 2020
Likewise. This issue occurs for me several times a week.
Edit: Here is the output from a few minutes ago. FWIW, in this instance I had just issued a 'run query' in this tab, then switched to another while I waited for this one. I switched back to check on it and *poof*.
[2021-01-05 12:38:15.093] [renderer1] [info] Successfully added connection untitled:SQLQuery_5
[2021-01-05 16:54:59.453] [renderer1] [error] Cannot read property 'reduce' of null: TypeError: Cannot read property 'reduce' of null
    at runner.batchSets.reduce (file:///usr/share/azuredatastudio/resources/app/out/vs/workbench/workbench.main.js:203378:49)
    at Array.reduce (<anonymous>)
    at RowCountStatusBarContributions._displayValue (file:///usr/share/azuredatastudio/resources/app/out/vs/workbench/workbench.main.js:203377:47)
    at disposable.add.queryModelService.onRunQueryComplete.e (file:///usr/share/azuredatastudio/resources/app/out/vs/workbench/workbench.main.js:203370:34)
    at Emitter.fire (file:///usr/share/azuredatastudio/resources/app/out/vs/workbench/workbench.main.js:10502:38)
    at queryRunner.onQueryEnd.totalMilliseconds (file:///usr/share/azuredatastudio/resources/app/out/vs/workbench/workbench.main.js:204719:42)
    at Emitter.fire (file:///usr/share/azuredatastudio/resources/app/out/vs/workbench/workbench.main.js:10502:38)
    at QueryRunner.handleQueryComplete (file:///usr/share/azuredatastudio/resources/app/out/vs/workbench/workbench.main.js:203963:30)
    at _notify (file:///usr/share/azuredatastudio/resources/app/out/vs/workbench/workbench.main.js:120708:24)
    at QueryManagementService.enqueueOrRun (file:///usr/share/azuredatastudio/resources/app/out/vs/workbench/workbench.main.js:120597:17)
    at QueryManagementService._notify (file:///usr/share/azuredatastudio/resources/app/out/vs/workbench/workbench.main.js:120602:18)
    at QueryManagementService.onQueryComplete (file:///usr/share/azuredatastudio/resources/app/out/vs/workbench/workbench.main.js:120707:18)
    at MainThreadDataProtocol.$onQueryComplete (file:///usr/share/azuredatastudio/resources/app/out/vs/workbench/workbench.main.js:228979:42)
    at RPCProtocol._doInvokeHandler (file:///usr/share/azuredatastudio/resources/app/out/vs/workbench/workbench.main.js:234588:27)
    at RPCProtocol._invokeHandler (file:///usr/share/azuredatastudio/resources/app/out/vs/workbench/workbench.main.js:234573:45)
    at RPCProtocol._receiveRequest (file:///usr/share/azuredatastudio/resources/app/out/vs/workbench/workbench.main.js:234505:32)
    at RPCProtocol._receiveOneMessage (file:///usr/share/azuredatastudio/resources/app/out/vs/workbench/workbench.main.js:234433:26)
    at RPCProtocol._protocol.onMessage (file:///usr/share/azuredatastudio/resources/app/out/vs/workbench/workbench.main.js:234323:52)
    at Emitter.fire (file:///usr/share/azuredatastudio/resources/app/out/vs/workbench/workbench.main.js:10502:38)
    at deliverMessages (file:///usr/share/azuredatastudio/resources/app/out/vs/workbench/workbench.main.js:32349:25)
    at source (file:///usr/share/azuredatastudio/resources/app/out/vs/workbench/workbench.main.js:32355:13)
    at Emitter.fire (file:///usr/share/azuredatastudio/resources/app/out/vs/workbench/workbench.main.js:10502:38)
    at PersistentProtocol._receiveMessage (file:///usr/share/azuredatastudio/resources/app/out/vs/workbench/workbench.main.js:32580:37)
    at PersistentProtocol._socketDisposables.push._socketReader.onMessage.msg (file:///usr/share/azuredatastudio/resources/app/out/vs/workbench/workbench.main.js:32458:83)
    at Emitter.fire (file:///usr/share/azuredatastudio/resources/app/out/vs/workbench/workbench.main.js:10502:38)
    at ProtocolReader.acceptChunk (file:///usr/share/azuredatastudio/resources/app/out/vs/workbench/workbench.main.js:32199:37)
    at ProtocolReader._register._socket.onData.data (file:///usr/share/azuredatastudio/resources/app/out/vs/workbench/workbench.main.js:32168:61)
    at Socket.listener (file:///usr/share/azuredatastudio/resources/app/out/vs/workbench/workbench.main.js:32737:40)
    at ZoneDelegate.invokeTask (/usr/share/azuredatastudio/resources/app/node_modules.asar/zone.js/dist/zone-node.js:421:31)
    at Zone.runTask (/usr/share/azuredatastudio/resources/app/node_modules.asar/zone.js/dist/zone-node.js:188:47)
    at ZoneTask.invokeTask (/usr/share/azuredatastudio/resources/app/node_modules.asar/zone.js/dist/zone-node.js:496:34)
    at Socket.ZoneTask.invoke (/usr/share/azuredatastudio/resources/app/node_modules.asar/zone.js/dist/zone-node.js:485:48)
    at Socket.emit (events.js:182:13)
    at addChunk (_stream_readable.js:283:12)
    at readableAddChunk (_stream_readable.js:264:11)
    at Socket.Readable.push (_stream_readable.js:219:10)
    at Pipe.onStreamRead [as onread] (internal/stream_base_commons.js:94:17)
[2021-01-05 16:55:26.503] [renderer1] [info] Deleting connection untitled:SQLQuery_5
 elmat0
on 4 Jan 2021
elmat0
on 4 Jan 2021
happening to me to... very frustrating...
Version: 1.25.1
 estebanbernal77
on 12 Jan 2021
estebanbernal77
on 12 Jan 2021
Related issues
 RobLW
·
3Comments
RobLW
·
3Comments
 carloscfcortez
·
3Comments
carloscfcortez
·
3Comments
 haydnlj
·
3Comments
haydnlj
·
3Comments
 jsmith8858
·
3Comments
jsmith8858
·
3Comments
 stevenreddie
·
3Comments
stevenreddie
·
3Comments
Most helpful comment
This is also still happening to me as well about once or twice a week, and I am losing important queries that I was not planning on saving, but just working on temporarily. I am unfortunately unable to use ADS until this issue is resolved.
Version: 1.14.1 (user setup)
Commit: f9b968c1ae514a0d1210788629e1c69125857279
Date: 2019-12-24T02:42:26.303Z
VS Code: 1.38.0
Electron: 6.1.5
Chrome: 76.0.3809.146
Node.js: 12.4.0
V8: 7.6.303.31-electron.0
OS: Windows_NT x64 10.0.18362