Apexcharts.js: rangeBar bars overlap
@junedchhipa
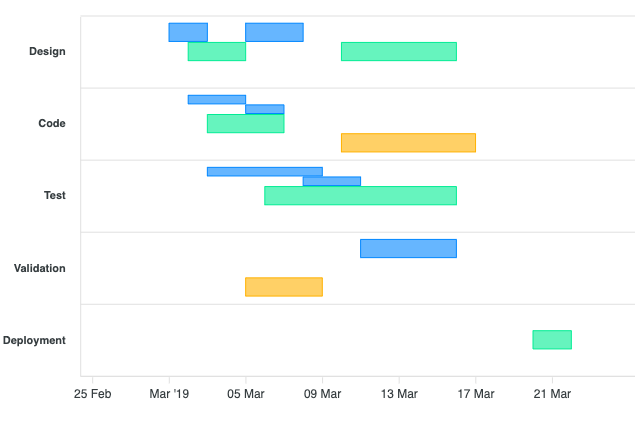
Using the demo here, adding the following Test section to Bob, will make the bars looked merged
        {
          x: 'Test',
          y: [
            new Date('2019-03-08').getTime(),
            new Date('2019-03-12').getTime()
          ]
        },
Just in between two ranges. As you can see in the picture it looks like they are merged.

If there are any overlapses, it should show in a new row
 thellimist
All 15 comments
What if there are more than 2 items of the same row that overlaps?
Creating n number of new rows for each overlap doesn't seem right.
 junedchhipa
on 20 Dec 2019
junedchhipa
on 20 Dec 2019
Creating n number of new rows for each overlap doesn't seem right.
Wonder what's your thought process? In my opinion losing visibility of data is worse than slightly more data.
// Method 1
11111    222222
    3333333
// Method 2
11111
         222222
    3333333
// Method 3
111133333332222
where each number represents a bar and it's length. In my opinion Method 1 > Method 2 > Method 3. Currently, rangeBar uses Method 3.
thellimist
on 20 Dec 2019
Sure, I was just asking for an opinion.
I was thinking of squeezing everything in 1 row but that will result in loss of data.
Method 1 looks good to me, I will try that one.
junedchhipa
on 20 Dec 2019
IMHO, it's a question of whether it should be the library or developer who handles such cases. I also see problem of dealing with such overlaps, but in my case I would prefer the overall chart to look nice (with the number rows being defined by the chart options and not changing from one series to another).
If method 1 or 2 gets implemented I think there should still be an option to use method 3.
 sergkop
on 20 Dec 2019
sergkop
on 20 Dec 2019
Yes, giving an option in the config whether to overlap the bars or to split those bars into two is a good way to let the developer control it.
Here is what I am thinking

It looks a bit ugly but the data is not lost.
Adding a new row for the overlapping bars will require a good amount of rewriting the range-bar module.
junedchhipa
on 20 Dec 2019
+1 for method 1 or 2
 julianmcolina
on 20 Dec 2019
julianmcolina
on 20 Dec 2019
https://codepen.io/thellimist/pen/mdypaOO
With commit https://github.com/apexcharts/apexcharts.js/commit/2214bfb6bc0304334bd2773aa0f0047e7ea54a63 empty data values are broken.
series: [
          {
            name: 'Bob',
            data: []
          },
          {
            name: 'Joe',
            data: [
              {
                x: 'Design',
                y: [
                  new Date('2019-03-02').getTime(),
                  new Date('2019-03-05').getTime()
                ]
              }
          }
      ]
Would not work anymore
thellimist
on 7 Jan 2020
Hello. This change in the rangeBar bars has completely broken how my layout was showing the information.
The overlap was desirable for me.
Is there an option to toggle the previous behaviour? This is the method 3 that @thellimist commented. If not, would it be hard to add one?
Thank you in advance.
 ccarrascoml
on 10 Jan 2020
ccarrascoml
on 10 Jan 2020
@ccarrascoml Sure, that's a valid point.
As @sergkop suggested, there needs to be an option to toggle the behavior.
I will address it soon.
junedchhipa
on 10 Jan 2020
Hello,
With the demo of the site on the Timeline multiple range series, this does not give me the desired rendering at the bars.
For example for Design, with 2 different dates for bob, that doesn't put me 2 bars in Design but puts my first date in design and the 2nd in code. (when I have the 3 active people in the legend).
And when I just display Bob, it creates 2 Design lines for me instead of the bars being gathered on the same line, is that normal?
 Irianne
on 15 Jan 2020
Irianne
on 15 Jan 2020
This property is now under bar as per this commit
 Gari-sincere
on 11 May 2020
Gari-sincere
on 11 May 2020
This bar.rangeBarOverlap is not working.
Can u share an example.
 pawanvivekananda
on 3 Oct 2020
pawanvivekananda
on 3 Oct 2020
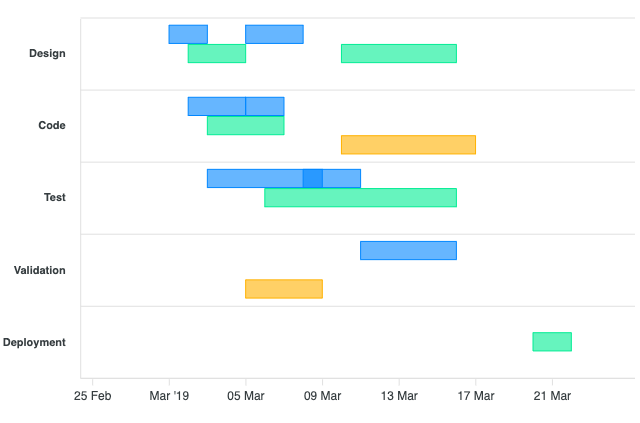
plotOptions.bar.rangeBarOverlap: false
plotOptions.bar.rangeBarOverlap: true
junedchhipa
on 3 Oct 2020
Can we get graph in single row for like method 3 (111133333332222) but the above graph looks like Method 2.
If that kind of graph is already available can u please the codepen link?
pawanvivekananda
on 4 Oct 2020
Any inputs on how to configure graph for method 3?
pawanvivekananda
on 26 Dec 2020
Related issues
 benhaynes
·
19Comments
benhaynes
·
19Comments
 jimfilippou
·
23Comments
jimfilippou
·
23Comments
 richardpolzer
·
24Comments
richardpolzer
·
24Comments
 LucaCorcella
·
14Comments
LucaCorcella
·
14Comments
 sdq-sts
·
15Comments
sdq-sts
·
15Comments
Most helpful comment
@ccarrascoml Sure, that's a valid point.
As @sergkop suggested, there needs to be an option to toggle the behavior.
I will address it soon.