Apexcharts.js: X axis labels are still misaligned
Codepen
https://codepen.io/jimfilippou-the-animator/pen/VEBrwe
Explanation
I believe this was an older issue which wasn't fixed. I am aware that using labels: [1,2,3,4,5,6,7,8,9] will solve the problem, but this is not a solution since the default behavior should align the x-axis properly.
What do you suggest wise man? 💯
Removing paddings is not a solution
What is the behavior you expect?

What is happening instead?

What error message are you getting?
No error message.
 jimfilippou
All 23 comments
Codepen not found
 junedchhipa
on 22 Oct 2018
junedchhipa
on 22 Oct 2018
@junedchhipa updated... once again 😛
jimfilippou
on 22 Oct 2018
If you don't know the number of dataPoints initially, then you can run an additional function after render()
chart.render()

chart.updateOptions({
  xaxis: {
    categories: chart.w.globals.labels
  }
})
Also, you need to set xaxis.tickAmount = 'dataPoints' for it to set the correct tick intervals.
xaxis: {
    type: "categories",
    tickAmount: 'dataPoints',
    categories: [],
},
Updated codepen
junedchhipa
on 22 Oct 2018
Why can't I view this ticket on GitHub?
On Mon, Oct 22, 2018 at 2:41 PM Jim Filippou notifications@github.com
wrote:
Codepen
https://codepen.io/jimfilippou-the-animator/pen/VEBrwehoot your problem.
ExplanationI believe this was an older issue which wasn't fixed. I am aware that
using labels: [1,2,3,4,5,6,7,8,9] will solve the problem, but this is not
a solution since the default behavior should align the x-axis properly.
What do you suggest wise man? 💯Removing paddings is not a solution
-
What is the behavior you expect?
[image: untitlee]
https://user-images.githubusercontent.com/6877046/47284037-6815ec00-d5ee-11e8-829b-261f22f90973.png
-What is happening instead?
[image: untitled]
https://user-images.githubusercontent.com/6877046/47284048-72d08100-d5ee-11e8-91cc-7ea7425aeb71.png
-What error message are you getting?
No error message.—
You are receiving this because you are subscribed to this thread.
Reply to this email directly, view it on GitHub
https://github.com/apexcharts/apexcharts.js/issues/167, or mute the
thread
https://github.com/notifications/unsubscribe-auth/ARHnx7M1mb3TZIqONt1dW4w0elNQadprks5unYvYgaJpZM4XzBhu
.
junedchhipa
on 22 Oct 2018
Github is experiencing a lot of issues today, a lot! 💢
jimfilippou
on 22 Oct 2018
The problem is fixed, although this seems more like a 'hacky' way to solve this problem.
Thanks anyway
jimfilippou
on 22 Oct 2018
Yeah, for now, it seems hacky way.
I will add this as a default behavior in the next releases for empty categories. Let's keep this ticket open until I fix it
junedchhipa
on 22 Oct 2018
@junedchhipa another issue showed up related to this, take a look at this picture
Taking a look at this codepen https://codepen.io/jimfilippou-the-animator/pen/vVzddq
you will see that everything is ok until you see the console which looks like this

On my end, when it updates the categories with
chart.updateOptions({
        xaxis: {
          categories: chart.w.globals.labels
        }
      }, false, true);
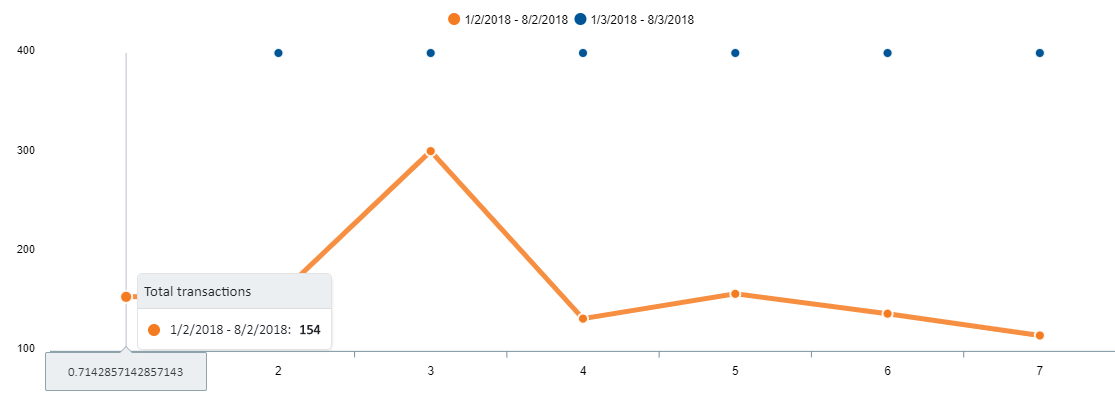
the w.globals.labels is
[0.7142857142857142, 1.8117913832199546, 2.909297052154195, 4.006802721088436, 5.104308390022676, 6.201814058956916, 7.299319727891157]
I can imagine why this is happening and there should probably be checks so that you can Math.round()
jimfilippou
on 23 Oct 2018
Just to help you out, I have tested the Math.round() for a large number of x values and the round function is accurate, take a look https://codepen.io/jimfilippou-the-animator/pen/XxxvZb?editors=1111
jimfilippou
on 24 Oct 2018
Thanks for testing with bigger datasets.
Another issue I just noted in your example is that markers show at the top for an empty dataset. That needs to be taken care of as well.
junedchhipa
on 24 Oct 2018
Yes, that is also an issue, I was going to open it in another GitHub issue, should I do it now or you prefer to have them both here
jimfilippou
on 24 Oct 2018
Please open another, so I can keep track
junedchhipa
on 24 Oct 2018
Fixed it in https://github.com/apexcharts/apexcharts.js/commit/7a34f2365394272aeb0661e48a06a38d510eef68
junedchhipa
on 25 Oct 2018
Okay, when is the upcoming build?
jimfilippou
on 25 Oct 2018
In 1 hour 😁
junedchhipa
on 25 Oct 2018
The issue is still here https://codepen.io/jimfilippou-the-animator/pen/zmyKMx?editors=0010
Steps I followed:
1) Removed this piece of code (ignore class syntax etc)
this.apexChart.updateOptions({
          xaxis: {
            categories: this.apexChart.w.globals.labels.map((l: any) => Math.round(l))
          }
}, false, true);
2) I have kept tickAmount to 'dataPoints'
Also, Categories array on x axis is empty
jimfilippou
on 25 Oct 2018
@jimfilippou Oops! I totally forgot to test without taking out the hacky code which we used previously.
Sorry about that. Also, I noticed - in the docs page, I have mentioned xaxis.type = 'categories' when in fact, it has to be xaxis.type = 'category'. Fixed the docs and all typos in code also.
Some code refactoring is required now as I did some quick fixes. Will be taken care in the next release.
You'll have to wait for Monday for the next release now 😁

I tested your latest codepen with my recent fixes - and it's working fine currently.
Cheers
junedchhipa
on 25 Oct 2018
Thanks again! let me know if you need any kind of help 😃
jimfilippou
on 25 Oct 2018
@junedchhipa padding is not present
https://codepen.io/jimfilippou-the-animator/pen/XxQKEp?editors=0010
jimfilippou
on 29 Oct 2018
I didn't understand the problem. Can you post a screenshot pointing the issue?
junedchhipa
on 29 Oct 2018

Also the padding is missing from left and right
jimfilippou
on 29 Oct 2018
Wait i think i didn't have my cache cleared
jimfilippou
on 29 Oct 2018
Yep that was my mistake, solved
jimfilippou
on 29 Oct 2018
Related issues
 frlinw
·
3Comments
frlinw
·
3Comments
 rudeayelo
·
3Comments
rudeayelo
·
3Comments
 tcarlsen
·
3Comments
tcarlsen
·
3Comments
 rcoundon
·
3Comments
rcoundon
·
3Comments
 drew-dulgar
·
3Comments
drew-dulgar
·
3Comments
Most helpful comment
@jimfilippou Oops! I totally forgot to test without taking out the
hackycode which we used previously.Sorry about that. Also, I noticed - in the docs page, I have mentioned
xaxis.type = 'categories'when in fact, it has to bexaxis.type = 'category'. Fixed the docs and all typos in code also.Some code refactoring is required now as I did some quick fixes. Will be taken care in the next release.
You'll have to wait for Monday for the next release now 😁
I tested your latest codepen with my recent fixes - and it's working fine currently.
Cheers