Altair: Facet a Layered plot with dual y axes.
Following the documentation provided on Bar Chart with Line on Dual Axis, I am trying to create a layered facet plot with dual axes, but I can't seem to figure it out. If I have the dataframe tmp:
          date        cfgi  isotherm      WY
10  2001-10-10    0.000000 -4.952924  2002.0
40  2001-11-09    0.000000 -2.244898  2002.0
54  2001-11-23    1.970406  0.735294  2002.0
62  2001-12-01   20.986111  2.027944  2002.0
70  2001-12-10   30.591290  1.088372  2002.0
78  2001-12-18   35.261295  1.152225  2002.0
86  2001-12-26   39.000690  1.964444  2002.0
94  2002-01-03   42.506378  1.791183  2002.0
102 2002-01-11   43.781593  1.586375  2002.0
110 2002-01-19   45.760792  1.705882  2002.0
118 2002-01-27   46.406609  1.781095  2002.0
126 2002-02-04   47.744289  2.436893  2002.0
134 2002-02-12   48.599140  2.673317  2002.0
142 2002-02-20   49.158649  2.788804  2002.0
150 2002-02-28   49.829014  2.752577  2002.0
158 2002-03-08   50.229359  2.835979  2002.0
166 2002-03-16   50.622917  2.557377  2002.0
174 2002-03-24   50.606747  2.643875  2002.0
200 2002-04-19    0.000000 -3.219276  2002.0
245 2002-11-02   27.117952 -0.211765  2003.0
253 2002-11-10   36.563366 -1.084746  2003.0
261 2002-11-18   43.002235 -0.344086  2003.0
271 2002-11-28   51.917686  0.700906  2003.0
279 2002-12-06   50.253212 -0.430976  2003.0
287 2002-12-14   66.070999  0.709030  2003.0
295 2002-12-22   91.186234  0.867133  2003.0
303 2002-12-30  106.678818  1.229730  2003.0
311 2003-01-07  112.494690  0.424908  2003.0
319 2003-01-15  117.110832  0.253968  2003.0
327 2003-01-23  120.141266 -0.603774  2003.0
335 2003-01-31  119.556870 -0.618357  2003.0
343 2003-02-08  123.463593  1.520000  2003.0
351 2003-02-16  124.573181 -0.297297  2003.0
359 2003-02-24  125.794930  9.050000  2003.0
367 2003-03-04  129.740936  5.607143  2003.0
375 2003-03-12  125.997314 -0.454546  2003.0
387 2003-03-26  110.702423 -4.196079  2003.0
455 2003-11-05   41.696335  0.893142  2004.0
463 2003-11-13   54.320972 -0.290599  2004.0
471 2003-11-21   58.672596 -1.099756  2004.0
479 2003-11-29   92.213356  0.913753  2004.0
487 2003-12-07   87.266273 -0.343839  2004.0
495 2003-12-15  101.789902 -0.942675  2004.0
503 2003-12-23  120.944778  0.735905  2004.0
511 2003-12-31  126.368637 -0.161172  2004.0
519 2004-01-08  129.912613 -0.725806  2004.0
527 2004-01-16  132.039307 -0.911392  2004.0
535 2004-01-24  135.563690 -0.912281  2004.0
543 2004-02-01  136.759705 -1.415094  2004.0
551 2004-02-09  138.018036 -1.830846  2004.0
559 2004-02-17  139.166611 -2.041667  2004.0
567 2004-02-25  139.626389 -2.802261  2004.0
575 2004-03-04  140.959839 -4.384616  2004.0
583 2004-03-12  140.847992 -3.194968  2004.0
and plot like:
chart2 = alt.Chart().mark_point().encode(
    x = 'date:T',
    y = 'isotherm')

chart3 = alt.Chart().mark_point(color='red').encode(
    y = 'cfgi',
    x='date:T')

combined = alt.layer(chart2,chart3, data = tmp ).facet('WY', columns=4).resolve_scale(y='independent',x='independent')
combined.display()
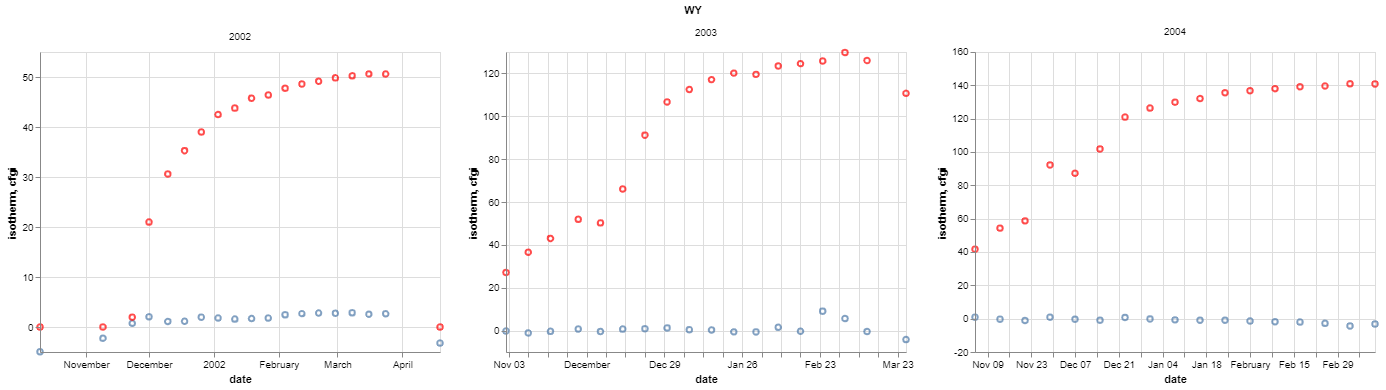
Why isn't cfgi plotting on a dual y-axis?
question
 danhamill
All 2 comments
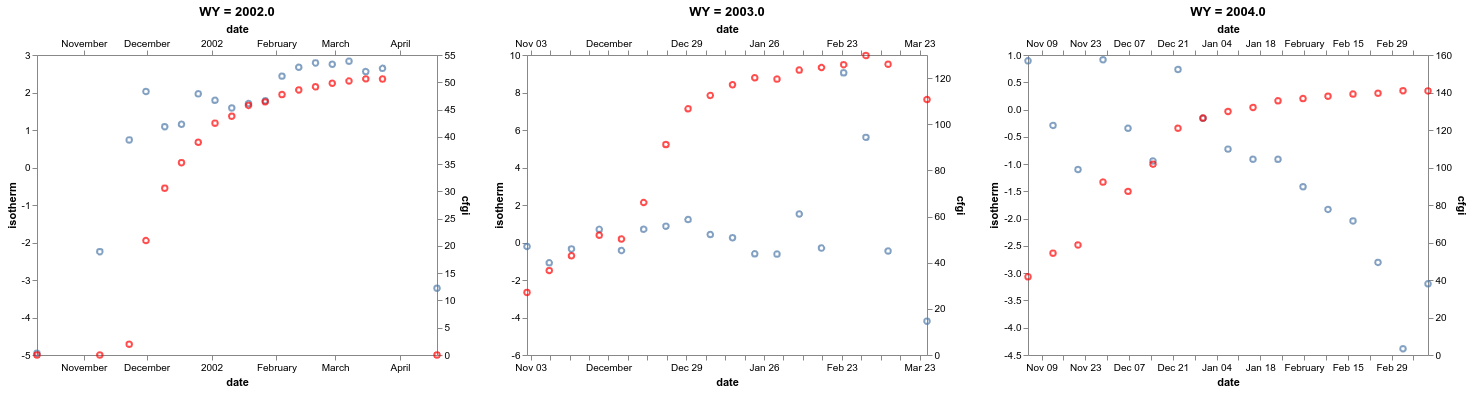
This is not possible currently due to a bug in Vega-Lite; see https://github.com/vega/vega-lite/issues/4373
As a workaround, you can manually filter and concatenate the charts:
chart2 = alt.Chart(data).mark_point().encode(
    x = 'date:T',
    y = 'isotherm')

chart3 = alt.Chart(data).mark_point(color='red').encode(
    y = 'cfgi',
    x='date:T')

alt.concat(*(
    alt.layer(chart2, chart3, title=f"WY = {val}").transform_filter(alt.datum.WY == val).resolve_scale(y='independent',x='independent')
    for val in data.WY.unique()
))
 jakevdp
on 28 Jan 2020
jakevdp
on 28 Jan 2020
👍4
Thank you!
danhamill
on 29 Jan 2020
Was this page helpful?
0 / 5 - 0 ratings
Related issues
 dzonimn
·
3Comments
dzonimn
·
3Comments
 bmcfee
·
3Comments
bmcfee
·
3Comments
 HalukaMB
·
3Comments
HalukaMB
·
3Comments
 tonylee3399
·
3Comments
tonylee3399
·
3Comments
 DentonGentry
·
3Comments
DentonGentry
·
3Comments
Most helpful comment
This is not possible currently due to a bug in Vega-Lite; see https://github.com/vega/vega-lite/issues/4373
As a workaround, you can manually filter and concatenate the charts: