Altair: How to generate a dataset when using from_json method?
Hi,
I have created a Vega-Lite spec using the Vega editor, now I would like to load this json spec but use Altair with pandas DataFrames to generate a new spec that contains the data (the dataset section of the spec). How can I do this?
UPDATE:
I realised that I didn't phrased it in the best way, what I actually want to reuse is the chart definition and discard the existing data in the JSON spec. Then, using pandas load new data from a different source and produce the same JSON spect but with the updated data.
 fj-sanchez
All 4 comments
Good question! Say you have a chart like this (vega editor):
{
"data": {
"values": [
{"name": "A", "value": 4},
{"name": "B", "value": 7},
{"name": "C", "value": 2},
{"name": "D", "value": 4},
{"name": "E", "value": 3}
]
},
"mark": "bar",
"encoding": {
"x": {"type": "quantitative", "field": "value"},
"y": {"type": "nominal", "field": "name"}
}
}
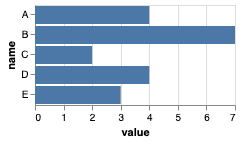
The easiest way to turn it into an Altair chart is with the from_json method:
spec = """
{
"data": {
"values": [
{"name": "A", "value": 4},
{"name": "B", "value": 7},
{"name": "C", "value": 2},
{"name": "D", "value": 4},
{"name": "E", "value": 3}
]
},
"mark": "bar",
"encoding": {
"x": {"type": "quantitative", "field": "value"},
"y": {"type": "nominal", "field": "name"}
}
}
"""
import altair as alt
alt.Chart.from_json(spec)
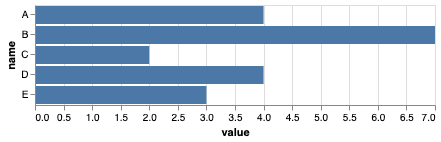
(The chart looks a bit different because of Altair's default theme; setting alt.themes.enable('none') will change this).
If you want to extract the data, turn it into a dataframe, and construct the chart from scratch, you can do something like this:
import pandas as pd
import json
data = json.loads(spec)['data']['values']
df = pd.DataFrame.from_records(data)
alt.Chart(df).mark_bar().encode(
x='value:Q',
y='name:N'
)
 jakevdp
on 7 Oct 2019
jakevdp
on 7 Oct 2019
What I'm trying to do is just the opposite, I want to use the Vega-Lite editor to generate a spec, I'm using a dataset section with dummy data while creating the spec. What I want to do now is to load the JSON, remove the data and use a DataFrame with different data (same fields) to generate a new json spec.
fj-sanchez
on 7 Oct 2019
Sure, you could do something like this:
import altair as alt
import pandas as pd

df = pd.DataFrame({
    'name': list('ABCDE'),
    'value': [4, 7, 2, 4, 3]
})

spec = """
{
  "data": {
    "values": [
      {"name": "dummy", "value": 0}
    ]
  },
  "mark": "bar",
  "encoding": {
    "x": {"type": "quantitative", "field": "value"},
    "y": {"type": "nominal", "field": "name"}
  }
}
"""

chart = alt.Chart.from_json(spec)
chart.data = df
chart

jakevdp
on 7 Oct 2019
Amazing how easy it actually is!
Thanks!
fj-sanchez
on 7 Oct 2019
Related issues
 HalukaMB
·
31Comments
HalukaMB
·
31Comments
 mattijn
·
23Comments
jakevdp
·
23Comments
mattijn
·
23Comments
jakevdp
·
23Comments
 Hisham-Hussein
·
29Comments
Hisham-Hussein
·
29Comments
 XaviFar
·
19Comments
XaviFar
·
19Comments
Most helpful comment
Sure, you could do something like this: