Altair: Space between rectangles / bars?
Sorry if this is covered elsewhere, but I wasn't able to find it anywhere. When using mark_bar() or mark_rect() to create a heatmap, is it possible to remove the spacing between rectangles/bars?
In my case I'm plotting a 2-D density and the rectangle boundaries distract from the density.
thanks!
 breadbaron
All 5 comments
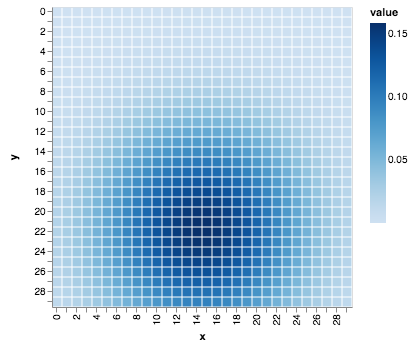
It looks like the size property is not applied to rect or bar marks. But one way you can do this is to encode both the fill and the stroke, and make the stroke fill the space between marks. For example:
import numpy as np
import pandas as pd
import altair as alt
x, y = np.meshgrid(np.arange(30), np.arange(30))
z = np.exp(-(x - 14)**2 / (5 ** 2) - (y - 22) ** 2 / (5 ** 2))
data = pd.DataFrame({
'x': x.ravel(),
'y': y.ravel(),
'z': z.ravel()
})
alt.Chart(data).mark_rect(strokeWidth=3).encode(
x='x:O',
y='y:O',
fill='z:Q',
stroke='z:Q'
)
 jakevdp
on 23 Jan 2019
jakevdp
on 23 Jan 2019
Thanks for looking into that @jakevdp . This solution works great
breadbaron
on 23 Jan 2019
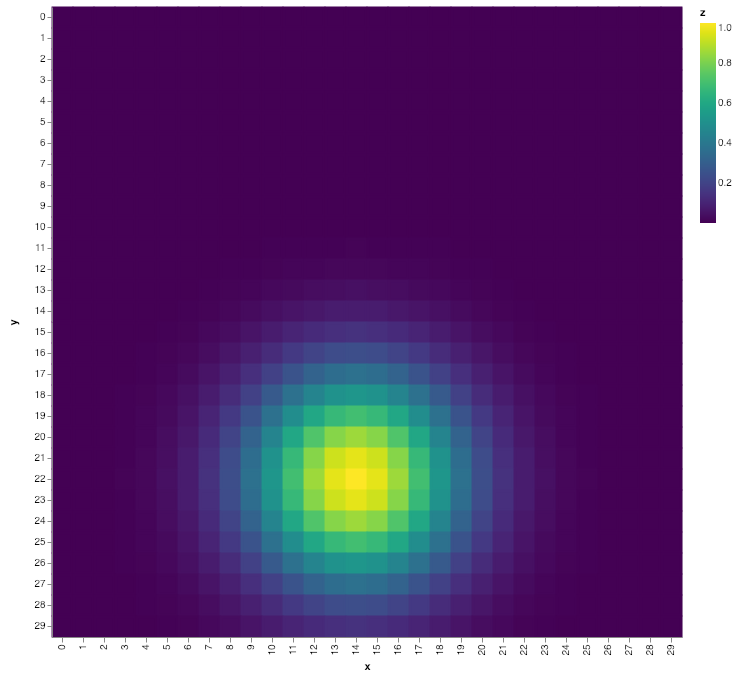
A better solution would be to adjust the inner padding for x and y band-ordinal scales using the bandPaddingInner, which defaults to 0.1 (docs).
alt.Chart(data).mark_rect().encode(
  x='x:O',
  y='y:O',
  fill='z:Q'
).configure_scale(bandPaddingInner=0)
 mattijn
on 23 Jan 2019
mattijn
on 23 Jan 2019
Thanks @mattjin – I didn't know about that configuration.
jakevdp
on 23 Jan 2019
Just a quick note for anyone else who comes across this--the bandPaddingInner solution didn't work for me, but the fill and stroke solution worked fine. (I guess there was some change in the code, or there's something different about my plot.)
 caleb-lindgren
on 12 Jun 2020
caleb-lindgren
on 12 Jun 2020
Related issues
breadbaron
·
4Comments
 LukeMathWalker
·
3Comments
LukeMathWalker
·
3Comments
 tonylee3399
·
3Comments
tonylee3399
·
3Comments
 mroswell
·
4Comments
mroswell
·
4Comments
 Juan-132
·
3Comments
Juan-132
·
3Comments
Most helpful comment
A better solution would be to adjust the inner padding for x and y band-ordinal scales using the
bandPaddingInner, which defaults to0.1(docs).