A Redditor posted a seemingly simple chart design, asking how to produce the design:

Initial responses about how to produce the chart were in three main flavors:
- gantt
- stacked bar
- calendar heatmap
In practice, each of the above chart types present unique challenges for, and may be incapable of rendering, the desired output.
The data structure might be, in effect, an array of two-tuples where each tuple contains a start and end Datetime.
What are some ideas on how this chart could be created with Altair?
 brylie
All 4 comments
This could be done with straight D3, but I'm not sure the Altair/Vega abstraction can support it.
 curran
on 4 Sep 2018
curran
on 4 Sep 2018
It depends how your data is represented, but something like this can definitely be done in Altair. For example:
import altair as alt
import pandas as pd

df = pd.DataFrame({
    'start': pd.to_datetime(['2018-09-03T08:00', '2018-09-03T16:00',
                             '2018-09-04T10:00', '2018-09-04T15:00',
                             '2018-09-05T09:00', '2018-09-05T12:30']),
    'end': pd.to_datetime(['2018-09-03T14:00', '2018-09-03T18:00',
                           '2018-09-04T12:00', '2018-09-04T17:00',
                           '2018-09-05T11:00', '2018-09-05T17:30'])
})

alt.Chart(df.reset_index()).mark_bar().encode(
    y='day(start):O',
    x='hoursminutes(start)',
    x2='hoursminutes(end)',
    detail='index'
)
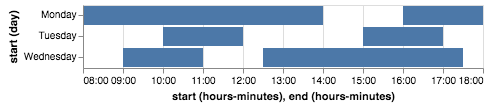
To me, this shows one of the great strengths of the declarative approach: rather than trying to figure out what chart type this maps to, and e.g. calling a gantt() method and digging into the options to figure out how to get it to work, you effectively just write down what you want to see using the grammar: "I want bars from start time to end time, with day on the y axis and detail for every row".
 jakevdp
on 4 Sep 2018
jakevdp
on 4 Sep 2018
OK, that is elegant!
Thanks @jakevdp :-)
brylie
on 4 Sep 2018
That's fantastic!
curran
on 4 Sep 2018
Related issues
 mroswell
·
4Comments
mroswell
·
4Comments
 pabloinsente
·
3Comments
pabloinsente
·
3Comments
 nielsmde
·
4Comments
nielsmde
·
4Comments
 jtbaker
·
3Comments
jtbaker
·
3Comments
 HalukaMB
·
3Comments
HalukaMB
·
3Comments
Most helpful comment
It depends how your data is represented, but something like this can definitely be done in Altair. For example:
To me, this shows one of the great strengths of the declarative approach: rather than trying to figure out what chart type this maps to, and e.g. calling a
gantt()method and digging into the options to figure out how to get it to work, you effectively just write down what you want to see using the grammar: "I want bars from start time to end time, with day on the y axis and detail for every row".