Altair: color of bars and text mark on bar chart
Hi Jake and all,
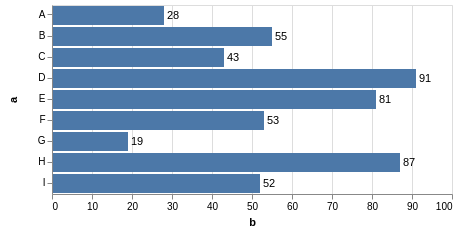
Here is an example from the docs where there is text on a bar chart. If I encode the bar mark color to the categorical variable, this forces the text mark to also have these colors, despite selecting a different color in the "mark_text" method.
data = pd.DataFrame({
    'a': ['A', 'B', 'C', 'D', 'E', 'F', 'G', 'H', 'I'],
    'b': [28, 55, 43, 91, 81, 53, 19, 87, 52]
})

bars = alt.Chart(data).mark_bar().encode(
    y='a',
    x='b',
    color='a'
)

text = bars.mark_text(
    align='left',
    baseline='middle',
    dx=3,
    color='black'
).encode(
    text='b'
)

bars + text

If I leave the color option out of both places. Then the bars are blue and the text is black (like in the docs), which makes me think that I can control these colors independently somehow.
Using the fill and color options seem to have no effect (if color has been previously encoded for the bars). The stroke option does work, but if the chart is large enough, you can see the inner part of the text still has the colors of the bars.
Is there a way to encode the bar color, but leave the text black or have it set to some other color?
Al
 Alcampopiano
All 2 comments
When you do text = bars.mark_text() it copies all the attributes of bars, such that text includes every specified encoding, including the color. Colors specified in encodings take priority over colors specified in mark properties, so the encoding wins out as you've coded it above.
If you don't want text to have a color encoding, then make sure not to include a color encoding. Here's one approach:
base = alt.Chart(data).encode(
    y='a',
    x='b'
)

bars = base.mark_bar().encode(
    color='a'
)

text = base.mark_text(
    align='left',
    baseline='middle',
    dx=3,
).encode(
    text='b',
)

bars + text
 jakevdp
on 18 Jul 2018
jakevdp
on 18 Jul 2018
This is awesome. I see what I was doing wrong. Thanks Jake. I'm slowly learning!
Alcampopiano
on 19 Jul 2018
Related issues
 Juan-132
·
3Comments
Juan-132
·
3Comments
 maxgerma
·
3Comments
maxgerma
·
3Comments
 HalukaMB
·
3Comments
HalukaMB
·
3Comments
 pabloinsente
·
3Comments
pabloinsente
·
3Comments
 floringogianu
·
3Comments
floringogianu
·
3Comments
Most helpful comment
This is awesome. I see what I was doing wrong. Thanks Jake. I'm slowly learning!