Altair: create multiple lines with the same color?
I'd like to create a plot with several (~50) lines, each of which is one of two colors depending on a field of the data. Right now I can't figure out how to do this, since under the hood the color parameter is being used as the group-by to determine what points should fall on the same line.
Is it possible to specify a group-by manually for drawing lines so that I can have non-unique values for color?
question
 willwhitney
❤2
All 2 comments
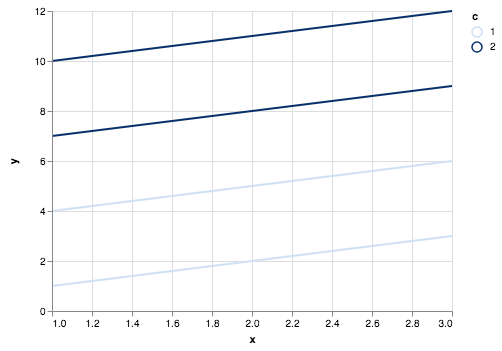
You can use the detail channel, which affects data groups but does not change the appearance of those groups on the chart. For example:
data = pd.DataFrame({
    'x': [1, 2, 3, 1, 2, 3, 1, 2, 3, 1, 2, 3],
    'y': [1, 2, 3, 4, 5, 6, 7, 8, 9, 10, 11, 12],
    'c': [1, 1, 1, 1, 1, 1, 2, 2, 2, 2, 2, 2],
    'd': [1, 1, 1, 2, 2, 2, 1, 1, 1, 2, 2, 2]
})

alt.Chart(data).mark_line().encode(
    x='x',
    y='y',
    color='c:O',
    detail='d'
)
 jakevdp
on 28 Jun 2018
jakevdp
on 28 Jun 2018
❤7
👍1
That is exactly perfect. Thank you so much for the quick response!
willwhitney
on 28 Jun 2018
👍2
Was this page helpful?
0 / 5 - 0 ratings
Related issues
 LukeMathWalker
·
3Comments
LukeMathWalker
·
3Comments
 DentonGentry
·
3Comments
DentonGentry
·
3Comments
 dzonimn
·
3Comments
dzonimn
·
3Comments
 HalukaMB
·
3Comments
HalukaMB
·
3Comments
 SuperShinyEyes
·
3Comments
SuperShinyEyes
·
3Comments
Most helpful comment
You can use the
detailchannel, which affects data groups but does not change the appearance of those groups on the chart. For example: