Is there any way to draw arrows? Imagine a simple vector of (Xo,Yo) --> (Xi, Yi) coordinates. How can I get the head of the arrow?
Thanks!
 biotemon
All 7 comments
I do not see a builtin ability to do that.
Searching through the vega-lite issues it looks like the suggestion here is to use a text mark with a unicode character:
https://github.com/vega/vega/issues/974
 afonit
on 1 Jun 2018
afonit
on 1 Jun 2018
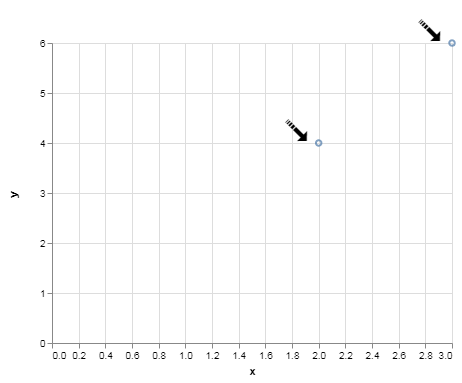
Here is a small example:
import altair as alt
import pandas as pd

a = {'x': [2,3], 'y': [4,6], 'textof': ['➟', '➟']}
df = pd.DataFrame(a)

point = alt.Chart(df).mark_point().encode(
    x='x',
    y='y')

text = alt.Chart(df).mark_text(dx=-25,dy=19, angle=45, fontSize=35).encode(
    x='x',
    y='y',
    text='textof'
)

point + text
afonit
on 1 Jun 2018
Thanks, but that is not what I want. Look the eigenvector plots in this link.
https://cran.r-project.org/web/packages/ggfortify/vignettes/plot_pca.html
The only solution I have found is just to generate flat straight lines, and using and vector image processor I might manually add the heads in the lines.
biotemon
on 1 Jun 2018
Arrows are not yet supported in Vega-Lite, so they are not supported in Altair.
 jakevdp
on 1 Jun 2018
jakevdp
on 1 Jun 2018
It seems some support may have been added arrows/unicode characters was added in Vega-lite - see [here]?(https://vega.github.io/vega/examples/wind-vectors/)
Is this now possible in Altair?
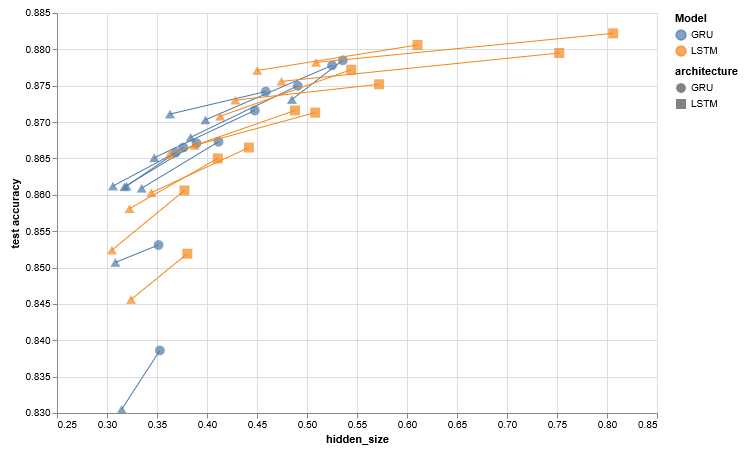
I guess what I really want is to be able to annotate my plots with arrows - something like this, but much less complex. This is from an old this issue
 firasm
on 7 Mar 2020
firasm
on 7 Mar 2020
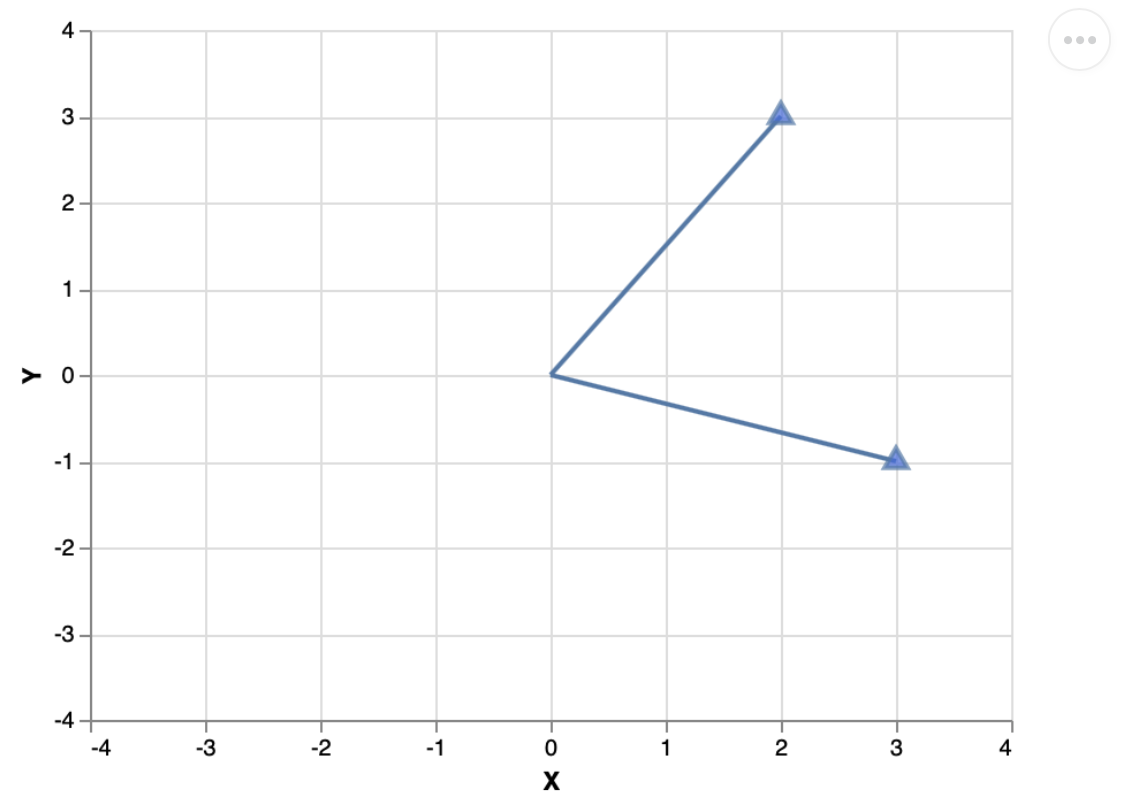
Hi, to 'plot' vectors I have been using mark_line + mark_point (triangle-shape) charts, but I think it is not very efficient. I was wondering if there is a better way to plot vectors with Altair, or if you are already working in this issue to make it possible.
This is an example of what I am doing:
# plot a vector in altair
# points
origin = [0,0]
vector1 = [3,-1]
vector2 = [2,3]

v = pd.DataFrame([origin, vector1, vector2], columns=['X','Y'])

# plots
lines = {}
for i in v.loc[v.index!=0].index:
    lines[i] = alt.Chart(v.loc[(v.index==0)|(v.index==i)]).mark_line().encode(
        alt.X('X', scale=alt.Scale(domain=(-4,4))),
        alt.Y('Y', scale=alt.Scale(domain=(-4,4))))

heads = alt.Chart(v.loc[v.index!=0]).mark_point(
    shape='triangle', size=100, fill='royalblue').encode(x='X',y='Y')

lines[1] + lines[2] + heads
 vcuspinera
on 16 Mar 2020
vcuspinera
on 16 Mar 2020
 zacharylawrence
Related issues
jakevdp
·
48Comments
 wmayner
·
22Comments
wmayner
·
22Comments
 Znafon
·
23Comments
jakevdp
·
36Comments
jakevdp
·
17Comments
Znafon
·
23Comments
jakevdp
·
36Comments
jakevdp
·
17Comments
Most helpful comment
It seems some support may have been added arrows/unicode characters was added in Vega-lite - see [here]?(https://vega.github.io/vega/examples/wind-vectors/)
Is this now possible in Altair?
I guess what I really want is to be able to annotate my plots with arrows - something like this, but much less complex. This is from an old this issue