Altair: faceted layered chart errors out while "validating 'anyOf'"
I was trying to reproduce a custom non-altair/vega chart I saw online when I ran into some trouble.
When faceting a chart then layering it - produces this error:
SchemaValidationError                     Traceback (most recent call last)
C:\Users\jthomp261\AppData\Local\Continuum\anaconda3\envs\data_analysis\lib\site-packages\altair\vegalite\v2\api.py in to_dict(self, *args, **kwargs)
    338         if dct is None:
    339             kwargs['validate'] = 'deep'
--> 340             dct = super(TopLevelMixin, copy).to_dict(*args, **kwargs)
    341
    342         if is_top_level:

C:\Users\jthomp261\AppData\Local\Continuum\anaconda3\envs\data_analysis\lib\site-packages\altair\utils\schemapi.py in to_dict(self, validate, ignore, context)
    252                 self.validate(result)
    253             except jsonschema.ValidationError as err:
--> 254                 raise SchemaValidationError(self, err)
    255         return result
    256

SchemaValidationError: Invalid specification

        altair.vegalite.v2.api.LayerChart->layer->items, validating 'anyOf'
Here is the non-faceted that works:
import altair as alt
from vega_datasets import data

stocks = data.stocks()
# get the price on the most recent date for the point chart
stocks_max = pd.merge(stocks.groupby('symbol')['date'].max().reset_index(),
                      stocks, on=['symbol', 'date'], how='left')

point = alt.Chart(stocks_max).mark_point().encode(
    x='date:T',
    y='price',
    color='symbol')

line = alt.Chart(stocks).mark_line(color='red').encode(
    x='date:T',
    y='price',
    color='symbol')

line+point

Now when I change the
color='symbol'
to
row='symbol'
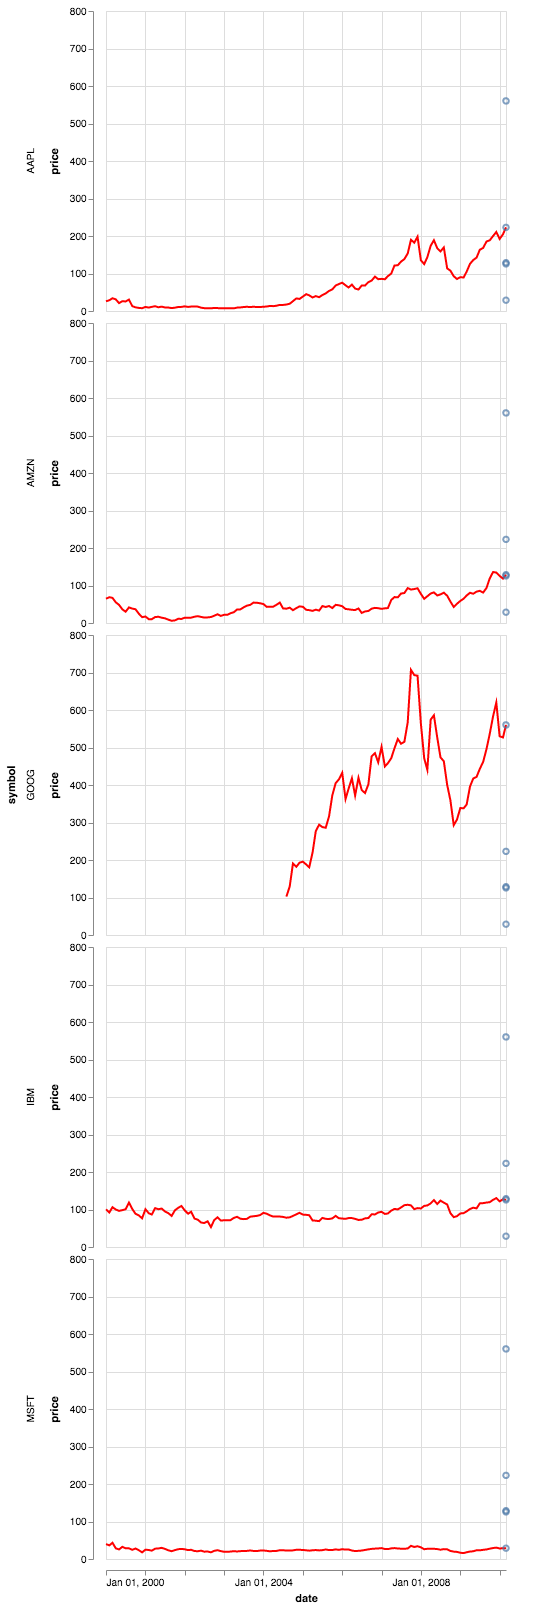
so that the bottom part looks like this:
point = alt.Chart(stocks_max).mark_point().encode(
    x='date:T',
    y='price',
    row='symbol')

line = alt.Chart(stocks).mark_line(color='red').encode(
    x='date:T',
    y='price',
    row='symbol')

line+point
I then get the error mentioned above.
I have searched on this repo and on vega-lite's repo for layered facets with many results of errors but they were all different from this one. I may be missing something basic here.
Note: this is not the completed chart, was was going to layer on another bar plot to get some other effect, but hit this roadblock on the way.
 afonit
All 7 comments
A LayeredChart cannot contain faceted charts as its elements, which is why this produces an invalid specification.
On the other hand, a FacetChart can facet a layered chart, so this will work:
point = alt.Chart(stocks_max).mark_point().encode(
    x='date:T',
    y='price')

line = alt.Chart().mark_line(color='red').encode(
    x='date:T',
    y='price')

(line + point).facet(row='symbol:N', data=stocks)
Notice that I removed the data argument from the line and put it in the facet call instead... the way facet works is to split the data and then pass it to each facet: if you provide the full dataset to the base chart, it will override the partial dataset being passed from its parent.
 jakevdp
on 26 Apr 2018
jakevdp
on 26 Apr 2018
@jakevdp thanks for the clarifcation that a LayeredChart cannot contain faceted charts.
I was reading through https://idl.cs.washington.edu/files/2018-InSituCodeVis-CHI.pdf and was just trying combinations that look like this:
https://xeno.graphics/spark-bar-chart/
to just try to combine things in interesting ways.
afonit
on 26 Apr 2018
The path of data objects within faceted layers is super confusing, and has come up before (see #668). I've tried to address it in the docs: https://altair-viz.github.io/user_guide/compound_charts.html#faceted-charts
But I think things are obscured by the fact that chart.facet() is silently creating a parent chart and this may not be clear to users. We may want to remove the facet() method and make people call FacetChart directly, in which case it will be more clear what is happening.
jakevdp
on 26 Apr 2018
@jakevdp these examples are super helpful, thanks!
I'm wondering if it's possible to make a chart that is both layered and faceted where the data from the layers comes from different data tables? Or is it necessary to join all the data going into the layers into a single table before making the chart (and passing this joined table to facet()) ?
 breadbaron
on 30 Jul 2018
breadbaron
on 30 Jul 2018
Hi @breadbaron – no, a layer cannot contain a facet, but a facet can contain layers.
If you need to facet on both data sources, you'll have to either combine them outside Altair or use a Lookup transform to combine them within the plot spec.
jakevdp
on 30 Jul 2018
@jakevdp I the transform_lookup is what makes most sense. Thanks!
breadbaron
on 30 Jul 2018
It would be great to add this limitation as a side note to the example at https://altair-viz.github.io/gallery/choropleth_repeat.html. As soon as the user tries to add another map layer, the chart is broken and the error message is rather cryptic. Took me a while to find this issue report.
 anitagraser
on 4 Jan 2019
anitagraser
on 4 Jan 2019
Related issues
 lzamparo
·
39Comments
lzamparo
·
39Comments
 dyuval
·
34Comments
dyuval
·
34Comments
 pagpires
·
21Comments
jakevdp
·
24Comments
pagpires
·
21Comments
jakevdp
·
24Comments
 Znafon
·
23Comments
Znafon
·
23Comments