Altair: sort channel not working when I add text on top of my bars
This sorts like I want.
import altair as alt
from vega_datasets import data

barley = data.barley()
alt.Chart(cars.head(10)).mark_bar().encode(
    x='Miles_per_Gallon:Q',
    y=alt.Y('Name:N', sort=alt.SortField(field="Miles_per_Gallon", op="sum", order="descending"))
)

This does not.
bars = alt.Chart(cars.head(10)).mark_bar().encode(
    x='Miles_per_Gallon:Q',
    y=alt.Y('Name:N', sort=alt.SortField(field="Miles_per_Gallon", op="sum", order="descending"))
)

text = bars.mark_text(
    align='left',
    baseline='middle',
    dx=3,
).encode(text='Miles_per_Gallon:Q')

bars + text

Why?
 palewire
All 16 comments
That is a known bug in vega-lite, if this is the same issue I was having.
Here is the issue:
https://github.com/vega/vega-lite/issues/2177
It looks like they have merged a fix, so just a matter of time I suppose before it works its way to a release.
 afonit
on 3 Apr 2018
afonit
on 3 Apr 2018
Fixed in Altair 3:
import altair as alt
from vega_datasets import data

cars = data.cars()

bars = alt.Chart(cars.head(10)).mark_bar().encode(
    x='Miles_per_Gallon:Q',
    y=alt.Y('Name:N', sort=alt.EncodingSortField(field="Miles_per_Gallon", op="sum", order="descending"))
)

text = bars.mark_text(
    align='left',
    baseline='middle',
    dx=3,
).encode(text='Miles_per_Gallon:Q')

bars + text
 jakevdp
on 27 May 2019
jakevdp
on 27 May 2019
I know this was closed, but wanted to confirm, would you expect this to work if the data was split across multiple dataframes? I can work to assemble it all into a single frame, but I have a situation where I want the data labels in the middle of a stacked bar (similar to https://github.com/altair-viz/altair/issues/1147) and I am doing the position calculation separately.
I've tried it with two different dataframes as the base and it doesn't work. I get the similar alphabetical ordering that happens above, even though the frames use the same categories and it matches them up correctly (right text with right bars).
I should note, one reason I want to do it as two separate dataframes is I want the first labels to be align = center in the first bar, and the second to be align=middle. I get the issue if I try to subset it from the same df.
Thanks, and thanks for all the work on Altair, it's great.
Aaron
PS If you'd expect it to work, I can submit a full report.
 aaronbarzilai
on 25 Jun 2019
aaronbarzilai
on 25 Jun 2019
I'm not certain what you mean when you say the data are split across multiple dataframes, so I'm not sure whether I expect it to work (or what "work" means in this context). An example would be helpful.
jakevdp
on 25 Jun 2019
df=pd.DataFrame({'category': ['Start','Test 1', 'Test 1', 'Finish','Finish', ],
                 'grouping': ['group2', 'group2','group1', 'group2','group1'],
                 'count': [10000,8000,2000,5000,3000],
                 'position': [5000, 4000, 11000, 2500, 9000]})
display(df)

bars=alt.Chart(df).mark_bar().encode(
    alt.X('count',axis=None,scale=alt.Scale(domain=[0, 15000])),
    alt.Y('category',
          axis=alt.Axis(title=None, ticks=False),
         ),
    alt.Color('grouping',
              scale=alt.Scale(
                  domain=['group2', 'group1'],
                  range=['#3d85c6','#D9D9D9',]
              ),
              legend=None
             )
)
print("Just the bars drawn, not sorted:")
display(bars)

####################################################


bars=alt.Chart(df).mark_bar().encode(
    alt.X('count',axis=None,scale=alt.Scale(domain=[0, 15000])),
    alt.Y('category',
          sort=['Start','Test 1','Finish'],
          axis=alt.Axis(title=None, ticks=False),

         ),
    alt.Color('grouping',
              scale=alt.Scale(
                  domain=['group2', 'group1'],
                  range=['#3d85c6','#D9D9D9',]
              ),
              legend=None
             )
)

text=alt.Chart(df).mark_text(align='center', baseline='middle').encode(
    alt.X('position', axis=None),
    alt.Y('category',
          sort=['Start','Test 1','Finish'],
          axis=alt.Axis(title=None, ticks=False),
         ),
    text='count')
print("Sorts with the bars and text when alt.Chart called with same df")
display(alt.layer(bars, text))


#################################

bars=alt.Chart(df).mark_bar().encode(
    alt.X('count',axis=None,scale=alt.Scale(domain=[0, 15000])),
    alt.Y('category',
          sort=['Start','Test 1','Finish'],
          axis=alt.Axis(title=None, ticks=False),

         ),
    alt.Color('grouping',
              scale=alt.Scale(
                  domain=['group2', 'group1'],
                  range=['#3d85c6','#D9D9D9',]
              ),
              legend=None
             )
)

text1=alt.Chart(df[df['grouping']=='group2']).mark_text(align='center', baseline='middle').encode(
    alt.X('position', axis=None),
    alt.Y('category',
          sort=['Start','Test 1','Finish'],
          axis=alt.Axis(title=None, ticks=False),
         ),
    text='count')

# Note text 2 is align left
text2=alt.Chart(df[df['grouping']=='group1']).mark_text(align='left', baseline='middle').encode(
    alt.X('position', axis=None),
    alt.Y('category',
          sort=['Start','Test 1','Finish'],
          axis=alt.Axis(title=None, ticks=False),
         ),
    text='count')

print("Does not Sort with bars and two texts when use text with slice (for diff align).\nSame problem if different df as well.")
display(alt.layer(bars, text1,text2))
As an aside, I also couldn't get it to reverse the sorting of the stacking of group2 and group1 (which is closest to 0) so had to list in opposite order.
Here's what it looks like.
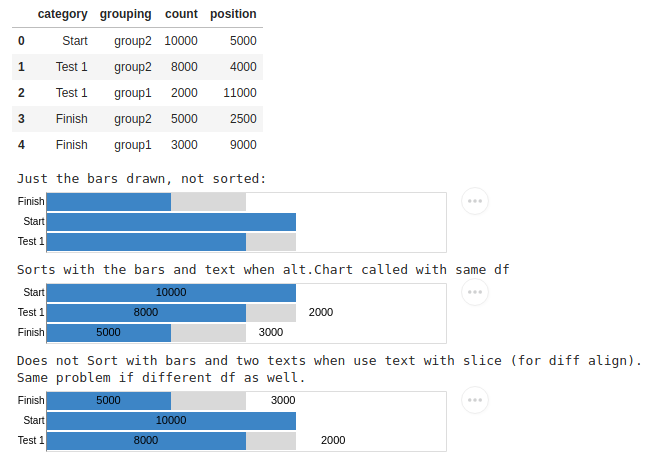
Thanks and sorry if this is a duplicate of another issue.
Aaron
aaronbarzilai
on 25 Jun 2019
Yeah, I think this is a bug. Here's a simpler reproduction:
import altair as alt
import pandas as pd

df = pd.DataFrame({
    'label': ['one', 'two', 'three'],
    'value': [1, 2, 4],
})

df2 = pd.DataFrame({
    'label': ['one', 'two', 'three'],
    'value': [2, 3, 5],
})

bars = alt.Chart(df).mark_bar().encode(
    x='value',
    y=alt.Y('label', sort=['one', 'two', 'three']),
)

text = alt.Chart(df2).mark_text().encode(
    x='value',
    y=alt.Y('label', sort=['one', 'two', 'three']),
    text='value'
)

bars + text
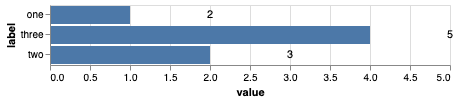
Sort order appears to not be respected when scales are drawn from multiple datasets. The workaround until this is fixed is to put all your values in a single dataset.
jakevdp
on 25 Jun 2019
If you look in the console output, you'll see the reason for this:
[Warning] Dropping sort property {"field":"y_label_sort_index","op":"min"} as unioned domains only support boolean or op 'count'.
Relevant Vega-Lite issue: https://github.com/vega/vega-lite/issues/5048
The bug is closed with the recommendation that datasets be joined to a single source, similar to my recommendation above (the reason, IIUC, is that unioned domains in general will not have compatible sorting semantics, and in the corner case where the semantics are identical, it is better style and more efficient to have a single data source. So rather than doing a costly check for axis compatibility to support the corner case, they instead show the warning and recommend using a single data source).
jakevdp
on 25 Jun 2019
hi @jakevdp
The error also seems to come up with a single data source, if an aggregation op for the sort property isn't specified. Here is a small repro.
# altair version: 4.0.0
# vega version: 2.6.0

import altair as alt
import pandas as pd
import numpy as np

# data
df = pd.DataFrame(
    {
        'city': ['D', 'B', 'C', 'A'],
        'col1': [1, 2, 3, 4],
        'col2': 10*np.random.random(4),
    }
).assign(
    colA = lambda x: x.col2 + 1,
    colB = lambda x: x.col2 - 1
)

# common x axes
unsorted_x_axis = alt.X('city', sort=alt.EncodingSortField('col1', order='ascending'))
sorted_x_axis = alt.X('city', sort=alt.EncodingSortField('col1', op='min', order='ascending'))

# expected plot order - D C B A
chart1 = alt.Chart(df).mark_line().encode(x = sorted_x_axis, y = 'col2')
chart2 = chart1.mark_errorbar().encode(y = 'colB', y2 = 'colA')

# underspecified plot - A B C D
chart3 = alt.Chart(df).mark_line().encode(x = unsorted_x_axis, y = 'col2')
chart4 = chart3.mark_errorbar().encode(y = 'colB', y2 = 'colA')

(chart1 + chart2) | (chart3 + chart4)
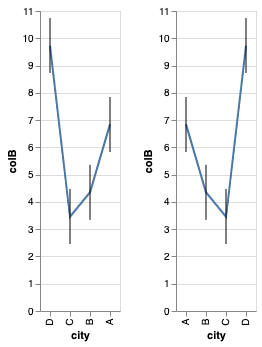
From the helpful console warning, it seems Vega assumes the default aggregation op to be "mean" when none is specified and proceeds to drop it when layering >1 charts.
WARN Dropping sort property {"field":"num_demos","op":"mean","order":"descending"} as unioned domains only support boolean or op "count", "min", and "max".
"mean" feels like the suitable default when an aggregation op isn't specified, and we aggregate over values of X. Although the dropped sort behavior might seem counterintuitive to people who aren't doing any aggregations on X axis and just plotting 2 curves together., like in the example.
Do you think changing the default aggregation op to something like min is a good idea?
PS. Thank you for your work on this library.
 ananis25
on 18 Dec 2019
ananis25
on 18 Dec 2019
The default aggregation is set within Vega-Lite. It might be worth a feature request there.
jakevdp
on 18 Dec 2019
@jakevdp does filtering the same data source but only for text chart, still count as single data source? I am getting the exact same issue with sorting here. I have a single dataframe for both bar and text, however to hide some text, I just filter the data when calling mark_text and then my graph just sorts alphabetically.
Let me know if you want me to give you an example?
I was hoping that while using the same dataframe, but filtering internally in altair, sorting shoud work too.
 armsp
on 19 Jul 2020
armsp
on 19 Jul 2020
@armsp - I'm not sure I understand. Can you give an example that demonstrates the problem you're seeing?
Also, renderer warnings in the javascript console can often help clarify what is happening.
jakevdp
on 20 Jul 2020
@jakevdp Sure, I was able to reproduce this behavior with one of the inbuilt datasets.
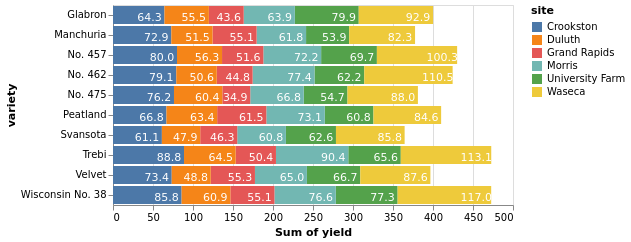
Let's take the stacked bar chart with text overlay example but order the internal bars based on site.
Let's modify the dataset to add an order column so that we can easily the order the y-axis based on that -
import altair as alt
from vega_datasets import data

source=data.barley()
source['order'] = source.groupby(['variety'])['yield'].transform('sum')
Now I will show you 3 scenarios -
Coloured Bars ordered by site, y-axis is unordered
bars = alt.Chart(source).mark_bar().encode(
    x=alt.X('sum(yield):Q', stack='zero'),
    y=alt.Y('variety:N'),
    color=alt.Color('site'),
    order = 'site'
)

text = bars.mark_text(dx=-15, dy=3, color='white').encode(
    color=alt.value('white'),
    text=alt.Text('sum(yield):Q', format='.1f')
)

bars + text
gives as expected -
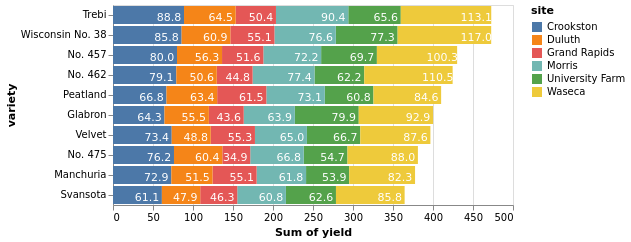
Now, we will order the y-axis too -
bars = alt.Chart(source).mark_bar().encode(
    x=alt.X('sum(yield):Q', stack='zero'),
    #y=alt.Y('variety:N'),
    y=alt.Y('variety:N', sort=alt.SortField('order', order='descending')),
    color=alt.Color('site'),
    order = 'site'
)

text = bars.mark_text(dx=-15, dy=3, color='white').encode(
    color=alt.value('white'),
    text=alt.Text('sum(yield):Q', format='.1f')
)

bars + text
gives as expected -
However, when I filter the data in text chart (still using the same data source since using it via bars.mark_text) to show text labels for only a couple of sites, the y-axis order is lost
bars = alt.Chart(source).mark_bar().encode(
    x=alt.X('sum(yield):Q', stack='zero'),
    #y=alt.Y('variety:N'),
    y=alt.Y('variety:N', sort=alt.SortField('order', order='descending')),
    color=alt.Color('site'),
    order = 'site'
)

text = bars.mark_text(dx=-15, dy=3, color='white').transform_filter({'field': 'site', 'oneOf': ['Crookston', 'Duluth']}).encode(
    color=alt.value('white'),
    text=alt.Text('sum(yield):Q', format='.1f')
)

bars + text
gives the following which is not as expected -

The y-axis order is same as first scenario in this one. I was however expecting that it retain the correct y-axis order.
armsp
on 20 Jul 2020
I'm not sure why this is happening; I think it's a vega-lite bug. Here's a simplified vega-lite spec showing the issue (Open the Chart in the Vega Editor):
{
  "data": {"url": "https://vega.github.io/vega-datasets/data/barley.json"},
  "transform": [
    {
      "joinaggregate": [{"op": "sum", "field": "yield", "as": "order"}],
      "groupby": ["variety"]
    }
  ],
  "encoding": {
    "x": {
      "field": "yield",
      "aggregate": "sum",
      "type": "quantitative",
      "stack": "zero"
    },
    "y": {
      "field": "variety",
      "type": "nominal",
      "sort": {"field": "order", "order": "descending"}
    },
    "order": {"type": "nominal", "field": "site"}
  },
  "layer": [
    {
      "mark": "bar",
      "encoding": {"color": {"type": "nominal", "field": "site"}}
    },
    {
      "transform": [{"filter": "true"}],
      "mark": {"type": "text", "color": "white", "dx": -15, "dy": 3},
      "encoding": {
        "text": {
          "type": "quantitative",
          "aggregate": "sum",
          "field": "yield",
          "format": ".1f"
        }
      }
    }
  ],
  "width": 600
}
If you delete the filter line, the sort works as expected.
I think it's probably some issue with unioned domains, though strangely there is no warning in the Vega editor.
As a workaround, you can set resolve_scale(y='independent'), which preserves the sort:
import altair as alt
from vega_datasets import data

source=data.barley.url

bars = alt.Chart(source).transform_joinaggregate(
    order='sum(yield)', groupby=['variety']
).mark_bar().encode(
    x=alt.X('sum(yield):Q', stack='zero'),
    y=alt.Y('variety:N', sort=alt.SortField('order', order='descending')),
    color=alt.Color('site:N'),
    order = 'site:N'
)

text = bars.mark_text(
    dx=-15, dy=3,
).transform_filter(
    {'field': 'site', 'oneOf': ['Crookston', 'Duluth']}
).encode(
    color=alt.value('white'),
    text=alt.Text('sum(yield):Q', format='.1f'),
    y=alt.Y('variety:N', sort=alt.SortField('order', order='descending'), axis=None),
)

(bars + text).resolve_scale(y='independent')

jakevdp
on 21 Jul 2020
@jakevdp Yup, resolve_scale(y='independent') helps a lot. Thanks !
armsp
on 23 Jul 2020
@jakevdp When you say it's probably a Vega-Lite bug, then should we raise an issue in Vega-Lite?
armsp
on 26 Jul 2020
Related issues
 dyuval
·
34Comments
dyuval
·
34Comments
 XaviFar
·
19Comments
XaviFar
·
19Comments
 mroswell
·
54Comments
mroswell
·
54Comments
 choldgraf
·
20Comments
jakevdp
·
48Comments
choldgraf
·
20Comments
jakevdp
·
48Comments