Altair: MaxRowsError for pandas.df with > 5000 rows
Hey,
Thanks for the package, I'm very keen to try it out on my own data. When trying to create a simple histogram with my own data, VegaLite fails on dataframes with more than 5000 rows. Here's a minimal reproducible example:
import altair as alt
import os
import pandas as pd
import numpy as np

lengths = np.random.randint(0,2000,6000)
lengths_list = lengths.tolist()
labels = [str(i) for i in lengths_list]
peak_lengths = pd.DataFrame.from_dict({'coords': labels, 'length': lengths_list},orient='columns')
alt.Chart(peak_lengths).mark_bar().encode(alt.X('lengths:Q', bin=True),y='count(*):Q')
Here's the error:
---------------------------------------------------------------------------
MaxRowsError                              Traceback (most recent call last)
~/anaconda/envs/py3/lib/python3.5/site-packages/altair/vegalite/v2/api.py in to_dict(self, *args, **kwargs)
    259         copy = self.copy()
    260         original_data = getattr(copy, 'data', Undefined)
--> 261         copy._prepare_data()
    262
    263         # We make use of two context markers:

~/anaconda/envs/py3/lib/python3.5/site-packages/altair/vegalite/v2/api.py in _prepare_data(self)
    251             pass
    252         elif isinstance(self.data, pd.DataFrame):
--> 253             self.data = pipe(self.data, data_transformers.get())
    254         elif isinstance(self.data, six.string_types):
    255             self.data = core.UrlData(self.data)

~/anaconda/envs/py3/lib/python3.5/site-packages/toolz/functoolz.py in pipe(data, *funcs)
    550     """
    551     for func in funcs:
--> 552         data = func(data)
    553     return data
    554

~/anaconda/envs/py3/lib/python3.5/site-packages/toolz/functoolz.py in __call__(self, *args, **kwargs)
    281     def __call__(self, *args, **kwargs):
    282         try:
--> 283             return self._partial(*args, **kwargs)
    284         except TypeError as exc:
    285             if self._should_curry(args, kwargs, exc):

~/anaconda/envs/py3/lib/python3.5/site-packages/altair/vegalite/data.py in default_data_transformer(data)
    122 @curry
    123 def default_data_transformer(data):
--> 124     return pipe(data, limit_rows, to_values)
    125
    126

~/anaconda/envs/py3/lib/python3.5/site-packages/toolz/functoolz.py in pipe(data, *funcs)
    550     """
    551     for func in funcs:
--> 552         data = func(data)
    553     return data
    554

~/anaconda/envs/py3/lib/python3.5/site-packages/toolz/functoolz.py in __call__(self, *args, **kwargs)
    281     def __call__(self, *args, **kwargs):
    282         try:
--> 283             return self._partial(*args, **kwargs)
    284         except TypeError as exc:
    285             if self._should_curry(args, kwargs, exc):

~/anaconda/envs/py3/lib/python3.5/site-packages/altair/vegalite/data.py in limit_rows(data, max_rows)
     47             return data
     48     if len(values) > max_rows:
---> 49         raise MaxRowsError('The number of rows in your dataset is greater than the max of {}'.format(max_rows))
     50     return data
     51

MaxRowsError: The number of rows in your dataset is greater than the max of 5000
A quick issues search didn't turn up any hits for MaxRowsError. There is a related issue (#287), but this was a data set with > 300k rows, and I have a measly 35k. Also, the FAQ link referenced in that issue now turns up a 404. For the meantime, does the advice in #249 still apply?
Package info: Running on Altair 2.0.0rc1, JupyterLab 0.31.12-py35_1 conda-forge
 lzamparo
All 39 comments
This is a deliberate setting, to keep users from inadvertently generating notebooks that are too big and unwieldy. This error is set in place to prevent users from creating notebooks that are so large that they crash the browser.
For large datasets, we'd suggest not embedding the data directly into the notebook (the default behavior), but rather saving it as a CSV or JSON file before rendering. You can do this by running
alt.data_transformers.enable('csv')
That said, I'm not able to get this to work when I try it; the resulting chart was empty.
@ellisonbg designed the data transformer interface; hopefully he can weigh in and recommend a solution that will work.
 jakevdp
on 20 Mar 2018
jakevdp
on 20 Mar 2018
@ellisonbg: in previous Altair versions, the MaxRowsError message included some information to help the user figure out what to do when they hit it. I think it would be useful to add something like that back in.
jakevdp
on 20 Mar 2018
@jakevdp @eitanlees FYI, I'm able to create and display a chart in the notebook with the workaround proposed in #249 by @pteehan
lzamparo
on 20 Mar 2018
@lzamparo note that enabling the json data transformer, i.e.
alt.data_transformers.enable('json')
does exactly the same thing as @pteehan's solution, but without any monkey-patching of chart object methods. This is the pattern you should use if you wish to save data to files when creating charts.
jakevdp
on 20 Mar 2018
This is the behavior I am seeing
Generate the data
import altair as alt
import os
import pandas as pd
import numpy as np

alt.data_transformers.enable('json')

lengths = np.random.randint(0,2000,6000)
lengths_list = lengths.tolist()
labels = [str(i) for i in lengths_list]
peak_lengths = pd.DataFrame.from_dict({'coords': labels,
                                       'lengths': lengths_list},
                                      orient='columns')
Try to plot
alt.Chart(peak_lengths).mark_bar().encode(
    x = alt.X('lengths:Q', bin=True),
    y='count(*):Q'
)

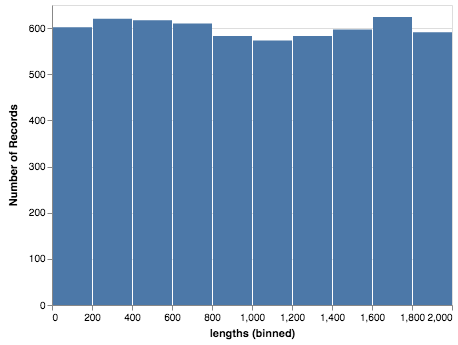
Blank plot but I noticed a json file was created. If I use the newly created json file (note yours will have a different name) as the data source then I get
alt.Chart('altair-data-73871b65-46d6-4133-97e5-4d413426ffb5.json').mark_bar().encode(
    x = alt.X('lengths:Q', bin=True),
    y='count(*):Q'
)
I feel like the first method should generate the json file and use it as the source. Maybe I am missing something.
 eitanlees
on 20 Mar 2018
eitanlees
on 20 Mar 2018
Yes, my understanding is that the first method should work as you say. (at least that's what I've understood from @ellisonbg's description of his intent in designing the data transformation code).
As I mentioned above, it's not working for me either – I'm seeing the same blank chart that you're seeing. I hope @ellisonbg can weigh-in soon and help debug this.
jakevdp
on 20 Mar 2018
This bug in the data_transformer also also precludes using even the monkey patch hack for composing layers (e.g box and whisker example), unless the patch method can generate a df-dependent json file name.
lzamparo
on 20 Mar 2018
Hi al, sorry about the delay. Two sides of this:
max rows
the magic to increase the max rows is this:
from altair import pipe, limit_rows, to_values
t = lambda data: pipe(data, limit_rows(max_rows=10000), to_values)
alt.data_transformers.register('custom', t)
alt.data_transformers.enable('custom')
I have thought that we probably want to have a higher level API than this - it is powerful and flexible, but a bit too low level for this simple usage case. I thought about trying to have the data transformers to have a dict of options that get passed as **kwargs to the individual stages, but not sure how that will work.
CSV/JSON URL bugs
I too am seeing some bugs related to using the csv and json data transformers. The issue is that the actual URL path to the generated file depends on how the notebook server is setup. There are options in the underlying data transformers to customize that, but it is painful. I think the right solution will be to change the renderers in lab/notebook to resolve the URLs automatically. Here is some hack'ish code I am using the get around this:
def custom(data):
    return alt.pipe(data, alt.to_json(
        base_url='<url to the base of the server for your user>'
    ))
alt.data_transformers.register('custom', custom)
alt.data_transformers.enable('custom')
@domoritz is this the option we want to use for this in the renderers?
https://github.com/vega/vega-embed/blob/master/src/embed.ts#L20
 ellisonbg
on 21 Mar 2018
ellisonbg
on 21 Mar 2018
OK @gnestor and I are making progress. It looks like JupyterLab master and the current release of the vega3 lab extension has some of the right logic here:
https://github.com/jupyterlab/jupyterlab/blob/master/packages/vega3-extension/src/index.ts#L80
I have a modified data transformer that works with this on a locally hosted lab, but fails on JupyterHub. I think this is because on a JupyterHub server, there is an additional "baseURL" that comes before the /files portion (something like /user/<username>). I think we need to prefix PageConfig.getBaseUrl() to that and then modify the data transformers (it will actually simplify them greatly.
This will allow the data transformers to refer to files using relative path and have it work on all JupyterLab deployments for VegaLite2/Vega3. However it still leaves the following issues:
- Vega2 embed doesn't support the loader if I remember
- We will need to make some changes to ipyvega3 to use the loader like this.
@domoritz
ellisonbg
on 23 Mar 2018
Yeah, the vega3 extension in jupyterlab creates a custom loader that is passed to Vega-Embed. As an aside: passing a baseURL is becoming a common use case. I could add a property baseURL to the Vega-Embed options object (internally, embed would create a loader with that baseURL).
 domoritz
on 23 Mar 2018
domoritz
on 23 Mar 2018
From my understanding, JupyterLab provides the "resolver" object that in turn provides the base URL to vega-loader. Given that, it would make sense to address this in lab's resolver so that other extensions can support JupyterHub and other types of deployments out-of-the-box.
@domoritz I think that makes sense 👍
 gnestor
on 23 Mar 2018
gnestor
on 23 Mar 2018
+1 to documenting how to workaround these limits and including a link to the docs in the error message. I think that could go a long way to addressing newbie frustrations.
 palewire
on 23 Mar 2018
palewire
on 23 Mar 2018
Here is the issue on JupyterLab tracking the fix on that side. We are planning on a new release on April 9th, should be in that release.
ellisonbg
on 28 Mar 2018
I just opened #672, which would allow users to run alt.data_transformers.enable('no_max_rows') and then be able to embed arbitrarily large datasets in the notebook, if that is what they wish to do.
@ellisonbg, do you think we should offer that option?
jakevdp
on 28 Mar 2018
@ellisonbg What is the base url of my server? I tried various things, but it keeps storing the file in the directory I started the server from and then generates a different path that is handed to the chart. I was able to make it work like so:
def custom(data):
    def change_path(d):
        d["url"] = d["url"].rsplit("/", 1)[1]
        return d

    return alt.pipe(data, alt.to_json, change_path)
But that seems unnecessarily complex.
 kuchenrolle
on 30 Mar 2018
kuchenrolle
on 30 Mar 2018
@kuchenrolle you're right that that is unnecessarily complex, and it's not our intention that the user would have to do that. It sounds like this issue will be fixed in the new JupyterLab release next week, at which point all you'll have to do is run alt.data_transformers.enable('json') and everything will work as expected.
jakevdp
on 30 Mar 2018
Update: if you use version 0.32 or newer of jupyterlab, this will work correctly; i.e. you can run
alt.data_transformers.enable('json')
and data will be saved as a file and loaded into the chart by URL.
jakevdp
on 13 Apr 2018
There's an 0.32 release candidate on pip if you want to try it out:
pip install jupyterlab==0.32rc0
I just checked that this also works in the classic notebook without any additional configuration.
jakevdp
on 13 Apr 2018
I know this is closed, but with fresh installs of Altair 2.0.0rc2 and jupyterlab 0.32.0 in a new conda environment I still get the MaxRowsError, even when I've run alt.renderers.enable('json'). Once I've set alt.renderers.enable('json'), creating a chart with data under 5000 rows displays JSON inline rather than the chart.
import altair as alt
import numpy as np
import pandas as pd

alt.renderers.enable('json')

lengths = np.random.randint(0,2000,6000)
lengths_list = lengths.tolist()
labels = [str(i) for i in lengths_list]
peak_lengths = pd.DataFrame.from_dict({'coords': labels, 'length': lengths_list},orient='columns')
alt.Chart(peak_lengths[:500]).mark_bar().encode(alt.X('lengths:Q', bin=True),y='count(*):Q')
 gschivley
on 27 Apr 2018
gschivley
on 27 Apr 2018
@gschivley When you set alt.renderers.enable('json'), the intended effect is exactly this: to render charts as JSON.
I think what you're looking for is alt.data_transformers.enable('json'), which will transform the data to JSON and load it into the chart by URL when displaying the chart.
jakevdp
on 27 Apr 2018
I've fixed the typo in my comment above that led you do this. Sorry about that :smile:
jakevdp
on 27 Apr 2018
Great, thanks! For anyone else who comes across this, find more information on options here. There are also built-in functions altair.limit_rows() and altair.sample() for testing figures with subsets of large data.
gschivley
on 27 Apr 2018
Also, note that once #757 is merged you can just do alt.data_transformers.enable('default', max_rows=1000000) if you actually want to embed large amounts of data within your notebook (I would not recommend that as the default solution).
I'm going to update the docs once that's in the release.
jakevdp
on 27 Apr 2018
Thanks to everyone who coordinated to solve this!
lzamparo
on 27 Apr 2018
I'm sorry if I'm missing something but the plots are still blank...
Using the same code as in @lzamparo 's example but setting alt.data_transformers.enable('json') as suggested. A json file is created but even making a direct reference to the file (i.e. as done by @eitanlees ) still produces a blank plot.
altair   2.1.0    py_0     conda-forge
jupyterlab  0.32.1   py36_0   conda-forge
 ffisc
on 24 Jul 2018
ffisc
on 24 Jul 2018
Do you have adblock turned on? That can sometimes prevent external data from being loaded in javascript.
jakevdp
on 24 Jul 2018
The alternative is to use alt.data_transformers.enable('default', max_rows=None) and just embed the data in your notebook (though this can lead to very large and slow notebooks if you are making multiple plots)
jakevdp
on 24 Jul 2018
Hi Jake, thank you for the quick reply.
I disabled adblock and even tried to run jupyterlab from Safari just in case, but this doesn't seem to be the issue.
Setting max_rows=None was what I had been doing so far until my notebooks in fact got very large and slow and jupyterlab would refuse to save them, so that unfortunately isn't an option.
ffisc
on 24 Jul 2018
How did you launch jupyterlab?
The key is that you need the saved files in a place that is accessible by the jupyter web server. If you use all the standard settings, data_transformers.enable('json') should work out of the box. If you change things (such as your current directory in Python, etc.) then it may not.
Another thing to check would be the javascript console. What error are you seeing there?
jakevdp
on 24 Jul 2018
Oh wow, the javascript console... I guess I'll limit myself to pasting a screenshot below without making inferences (I'm far from understanding what's going on)
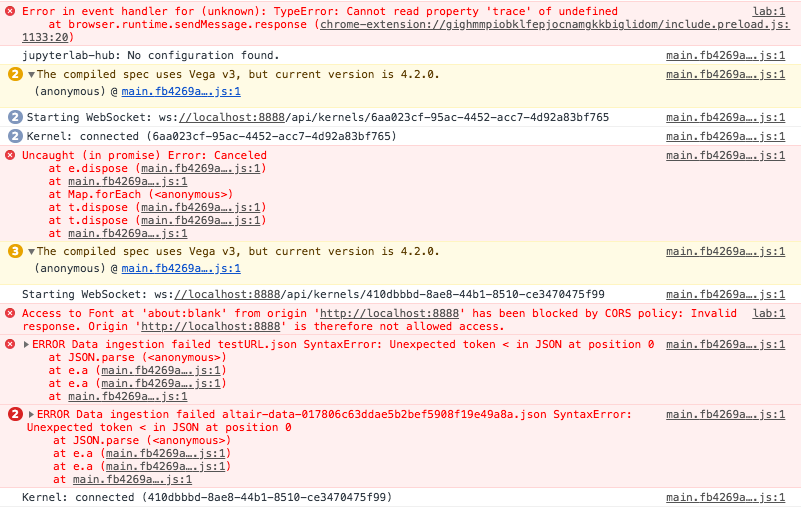
For the record I am launching jupyterlab from the Terminal and just running that piece of code.
ffisc
on 24 Jul 2018
I think the key is the CORS policy violation. The browser is telling you that the javascript is not allowed to access data from the server.
Are you using Jupyter Hub? I've never tried loading data from file on Jupyter hub, and it may have some extra protections in place that are blocking data access from javascript.
jakevdp
on 24 Jul 2018
It might be as easy as using https:// rather than http://.
jakevdp
on 24 Jul 2018
I've removed Jupyter Hub. The message below remains:
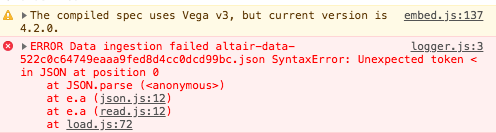
ffisc
on 25 Jul 2018
For anyone still getting blank plots with the json data transformer under JupyterHub + JupyterLab, I managed to get it working under Altair 4.1 by manually configuring the urlpath option of the json data transformer:
alt.data_transformers.enable("json", urlpath="/user-redirect/files/")
(It's basically an updated version of the second snippet here, taking advantage of the fact that data transformers are curried now as shown here; thank you both @ellisonbg and @jakevdp for showing the way! The user-redirect part comes from here.)
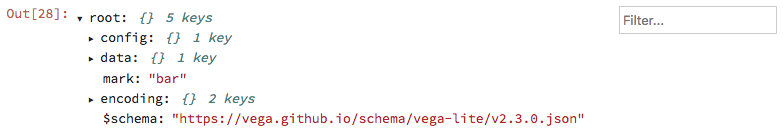
To troubleshoot, you should be able to do chart = alt.Chart(...).mark_whatever().to_dict() and then navigate to chart["data"]["url"] in your browser. If the data JSON doesn't load, then you've got the urlpath wrong.
It would be great if the json data transformer could figure out the urlpath prefix on its own, as needed, but I'm not sure this kind of introspection is available in the IPython kernel (possibly by design).
If that's not possible, maybe it would be a good idea to mention urlpath in the large datasets FAQ entry?
 dlukes
on 3 Apr 2020
dlukes
on 3 Apr 2020
I think I'm going to remove the JSON transformer recommendation (or put it much lower) because in general the assumption that the frontend can talk to the current working directory of Python's file system doesn't hold in general, and is subject to too many caveats like this to be broadly useful.
For charts built from large datasets, I would recommend the altair_data_server approach mentioned on that page.
jakevdp
on 3 Apr 2020
I would recommend the
altair_data_serverapproach mentioned on that page.
I tried that, but that generates a URL referencing a port on localhost, which also doesn't work as is (since the JupyterHub is running on a public server which doesn't listen for outside connections on random ports). Looking at the altair_data_server README now, it seems it can be made to work using data_server_proxied and jupyter-server-proxied, but it's not entirely hassle-free either.
So maybe it would be useful to add these caveats/pointers to the FAQ if altair_data_server is going to be the default recommendation? I understand that when all of this is correctly set up, it's probably a more robust option than navigating the intricacies of the file system, working directories etc., but it does require some tinkering.
dlukes
on 3 Apr 2020
FWIW, I'm getting a 404 with data_server_proxied and JupyterHub 1 + JupyterLab 2. Investigating a bit using .to_dict(), the generated URL is in the format ../proxy/18993/724d6426c5eb0a15708f1ea6286b0a8d.json, which looks like it should work (starting from https://jupyter.korpus.cz/user/lukes/lab) , and if I enter the full URL manually into the address bar, it does.
However, when testing in the console in the tab where I have JupyterLab open...
fetch("../proxy/18993/724d6426c5eb0a15708f1ea6286b0a8d.json").then(r => console.log(r))
... I get the 404:
Response { type: "basic", url: "https://jupyter.korpus.cz/user/lukes/18993/724d6426c5eb0a15708f1ea6286b0a8d.json", redirected: true, status: 404, ok: false, statusText: "Not Found", headers: Headers, body: ReadableStream, bodyUsed: false }
Judging by the url attribute on that Response object, the proxy path element somehow gets swallowed, not sure why. Strangely, if I remove the leading ../, everything works fine:
fetch("proxy/18993/724d6426c5eb0a15708f1ea6286b0a8d.json").then(r => console.log(r))
Response { type: "basic", url: "https://jupyter.korpus.cz/user/lukes/proxy/18993/724d6426c5eb0a15708f1ea6286b0a8d.json", redirected: false, status: 200, ok: true, statusText: "OK", headers: Headers, body: ReadableStream, bodyUsed: false }
Total stab in the dark -- maybe JupyterLab is doing something behind the scenes to make AJAX requests use a URL without the final /lab element as the root, and that's somehow interacting weirdly with ..? Should I report this somewhere else? Or does it rather smell like a misconfiguration of the server on my part?
dlukes
on 3 Apr 2020
maybe JupyterLab is doing something behind the scenes to make AJAX requests use a URL without the final /lab element as the root
Strike that, it occurs to me that a URL like jupyter.korpus.cz/user/lukes/lab is interpreted as being in the /user/lukes/ directory, not the /user/lukes/lab directory. There would probably have to be a trailing slash for the latter to be true.
I can't seem to find any authoritative reference on this, but try running the following in this page's console:
// window.location is https://github.com/altair-viz/altair/issues/611

// this fetches https://github.com/altair-viz/altair/issues/, not
// https://github.com/altair-viz/altair/issues/611
fetch(".").then(r => console.log(r))

// this fetches https://github.com/altair-viz/altair/
fetch("..").then(r => console.log(r))
In other words, JupyterLab probably isn't doing anything special there. It's a bug in altair_data_server, the data_server_proxied URL simply shouldn't start with ../, because it will be spliced in instead of /lab, not after it. I'm going to report this in the altair_data_server repo, along with additional details (I just realized that even if the leading ../ is removed, it still won't play nicely with JupyterLab workspaces).
dlukes
on 4 Apr 2020
Related issues
 bmcfee
·
3Comments
bmcfee
·
3Comments
 galloramiro
·
3Comments
galloramiro
·
3Comments
 firasm
·
3Comments
firasm
·
3Comments
 dzonimn
·
3Comments
dzonimn
·
3Comments
 zanarmstrong
·
4Comments
zanarmstrong
·
4Comments
Most helpful comment
+1 to documenting how to workaround these limits and including a link to the docs in the error message. I think that could go a long way to addressing newbie frustrations.