Altair: x-limits when domain specified
In this notebook I tried out Altair with a couple datasets and had some questions. All of these are labeled as "BUG or working as intended?" h2s in the notebook. (I realize the last entry is empty... that query took a long time to compute so I stopped there)
X-axis starts at zero when minimum value is much bigger
For this plot, the minimum x-axis data value is 1950 but the x-axis starts at 0. Is that the default? It seems like the limits of the input data should be the limits of the chart.
altair.Chart(subset).mark_line().encode(
    x='Year',
    y='Number of Papers'
)
"Buggy" image:

I was able to fix this with Scale but wanted to report anyway.
altair.Chart(subset).mark_line().encode(
    X('Year', scale=Scale(domain=(2000, 2017))),
    y='Number of Papers'
)
Fixed image:

x-scale applied in X() object but not viewed in chart
For this chart, I specified the Scale for the X() object but it wasn't applied! I still got the data from 1950 (not from 0 as in the first bug so that's interesting..)
from altair import LayeredChart

chart = LayeredChart(data, height=100, width=200)

x = X('Year', scale=Scale(domain=(2000, 2017)),
      axis=Axis(format='d'))
y = Y('Number of Papers', axis=Axis(ticks=5))

chart += Chart().mark_line().encode(x, y )
chart += Chart().mark_circle().encode(x, y)
chart
"Buggy" image:

I was able to fix it with:
from altair import LayeredChart

chart = LayeredChart(data, height=100, width=150)

x = X('Year', scale=Scale(domain=(2000, 2016)),
      axis=Axis(format='d'))
y = Y('Number of Papers', axis=Axis(ticks=5))

chart += Chart().mark_line().encode(x, y ).transform_data(filter='datum.Year >= 2000')
chart += Chart().mark_circle().encode(x, y).transform_data(filter='datum.Year >= 2000')
chart
Fixed image:

Can't handle quotes in axes names
This code references a valid column, but there's no output! If I copy the data with a column name that doesn't have quotes, then the plot works, so I think it's the quotation marks.
altair.Chart(singlecell).mark_line().encode(
    x='Year',
    y='Number of "single cell" papers'
)
 olgabot
All 6 comments
Thanks for these reports! A couple of responses:
1. X-axis starts at zero when minimum value is much bigger
I believe this is a deliberate design choice in Vega-Lite, because one of the most common sources of misleading plot design is cutting-off the zeropoint at some arbitrary value. You can also use Scale(zero=False) to turn this off, I believe.
2. x-scale applied in X() object but not viewed in chart
This is addressed in the documentation here: https://altair-viz.github.io/documentation/config.html#adjusting-axis-limits
By design Altair will never hide any of your data points unless you explicitly ask them to be filtered out.
3. Can't handle quotes in axes names
non-standard characters in column names cause issues in the JSON, but I believe Vega-Lite is addressing that in their new release. See also #161, #169, #284
 jakevdp
on 7 Apr 2017
jakevdp
on 7 Apr 2017
@jakevdp @olgabot do you think there are any actions for us on this one? Can we close?
 ellisonbg
on 19 Apr 2017
ellisonbg
on 19 Apr 2017
1. X-axis starts at zero when minimum value is much bigger
It's still a weird/unexpected behavior that the x-range always starts at zero. As a user, I'd expect the plot to auto-scale to the data I'd give it. If that's part of the Vega-Lite spec and not Altair, I'll take it up with them.
2. x-scale applied in X() object but not viewed in chart
Maybe this is something to address in the documentation, that you recommend filtering data only with transform_data and that Scale should only be used for plot orientation/zooming. Though what if you had ranges from 1-100 and you wanted to zoom in on 20-30. Wouldn't Scale do the zooming, but the rest of the data be shown? I guess I expected Scale to then pass to transform_data but it seems they're decoupled, because setting ylim/xlim in matplotlib cuts off the rest of the data too, but I think that's valid because the user explicitly defined. It just seems weird that you need to specify two things to zoom in on a part of the axis.
3. Can't handle quotes in axes names
Cool, glad it's getting addressed!
olgabot
on 24 Apr 2017
I think the action items for this are to improve the documentation about adjusting the plot limits.
ellisonbg
on 27 Sep 2017
To pile on here before I start a new issue. The scale documentation is not reproducible for me...
import altair as alt
data = alt.load_dataset('cars', url_only=True)

alt.Chart(data).mark_point().encode(
    alt.X('Acceleration:Q', scale=alt.Scale(domain=(5, 15))),
    y='Horsepower:Q'
)
The axis does not start at 5 as shown in the documentation.
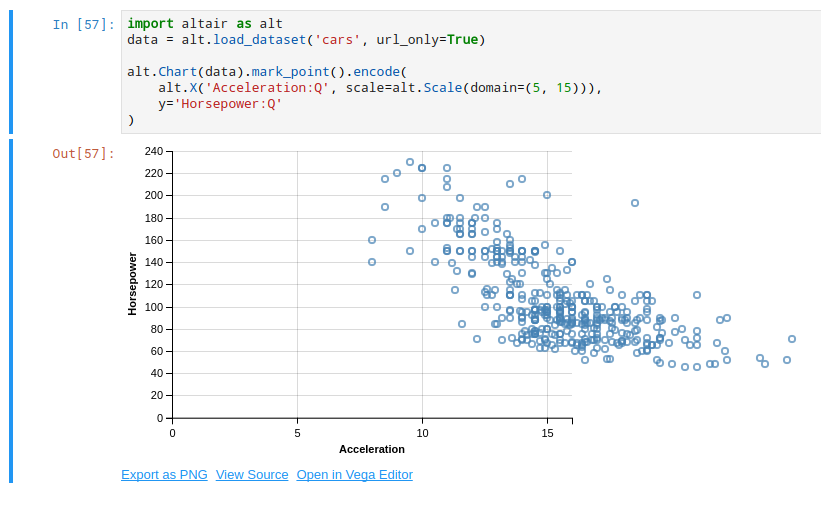
Let me know if this is not a good candidate for bundling with this issue and I'll start another one. I found I had to use @jakevdp 's additional parameter above, alt.Scale(..., zero=False) to get this example to work.
 jwhendy
on 19 Dec 2017
jwhendy
on 19 Dec 2017
This all refers to version 1, which is now obsolete. I'm going to close this issue.
Note that there is active discussion of scale defaults in vega-lite here: https://github.com/vega/vega-lite/issues/3562
jakevdp
on 27 Mar 2018
Related issues
jakevdp
·
48Comments
jakevdp
·
34Comments
 choldgraf
·
20Comments
choldgraf
·
20Comments
 hugo-pires
·
19Comments
jakevdp
·
23Comments
hugo-pires
·
19Comments
jakevdp
·
23Comments
Most helpful comment
Thanks for these reports! A couple of responses:
1. X-axis starts at zero when minimum value is much bigger
I believe this is a deliberate design choice in Vega-Lite, because one of the most common sources of misleading plot design is cutting-off the zeropoint at some arbitrary value. You can also use
Scale(zero=False)to turn this off, I believe.2. x-scale applied in X() object but not viewed in chart
This is addressed in the documentation here: https://altair-viz.github.io/documentation/config.html#adjusting-axis-limits
By design Altair will never hide any of your data points unless you explicitly ask them to be filtered out.
3. Can't handle quotes in axes names
non-standard characters in column names cause issues in the JSON, but I believe Vega-Lite is addressing that in their new release. See also #161, #169, #284