Wordpress-ios: Constant CPU usage after loading posts from a Post List NoResultsController
Steps to reproduce the behaviour
1) Load a blog that has posts by an author other than the logged in user. Your user should have no posts on the blog.
2) Load the "me" tab. Wait until the "You haven't published any posts yet" screen is visible. Then choose the authors picker, and choose "Everyone". The CPU will run at 100% indefinitely until you navigate upward from this screen (ie – if you choose a post and start editing, the CPU will continue to run at 100% because that view is still behind the editor).
3) To see this issue in action, you can activate the profiler or use the Debug Navigator tab in Xcode.
Potential Cause
In the profiler, it looks like WPAnimatedBox.playAnimation is being called constantly.
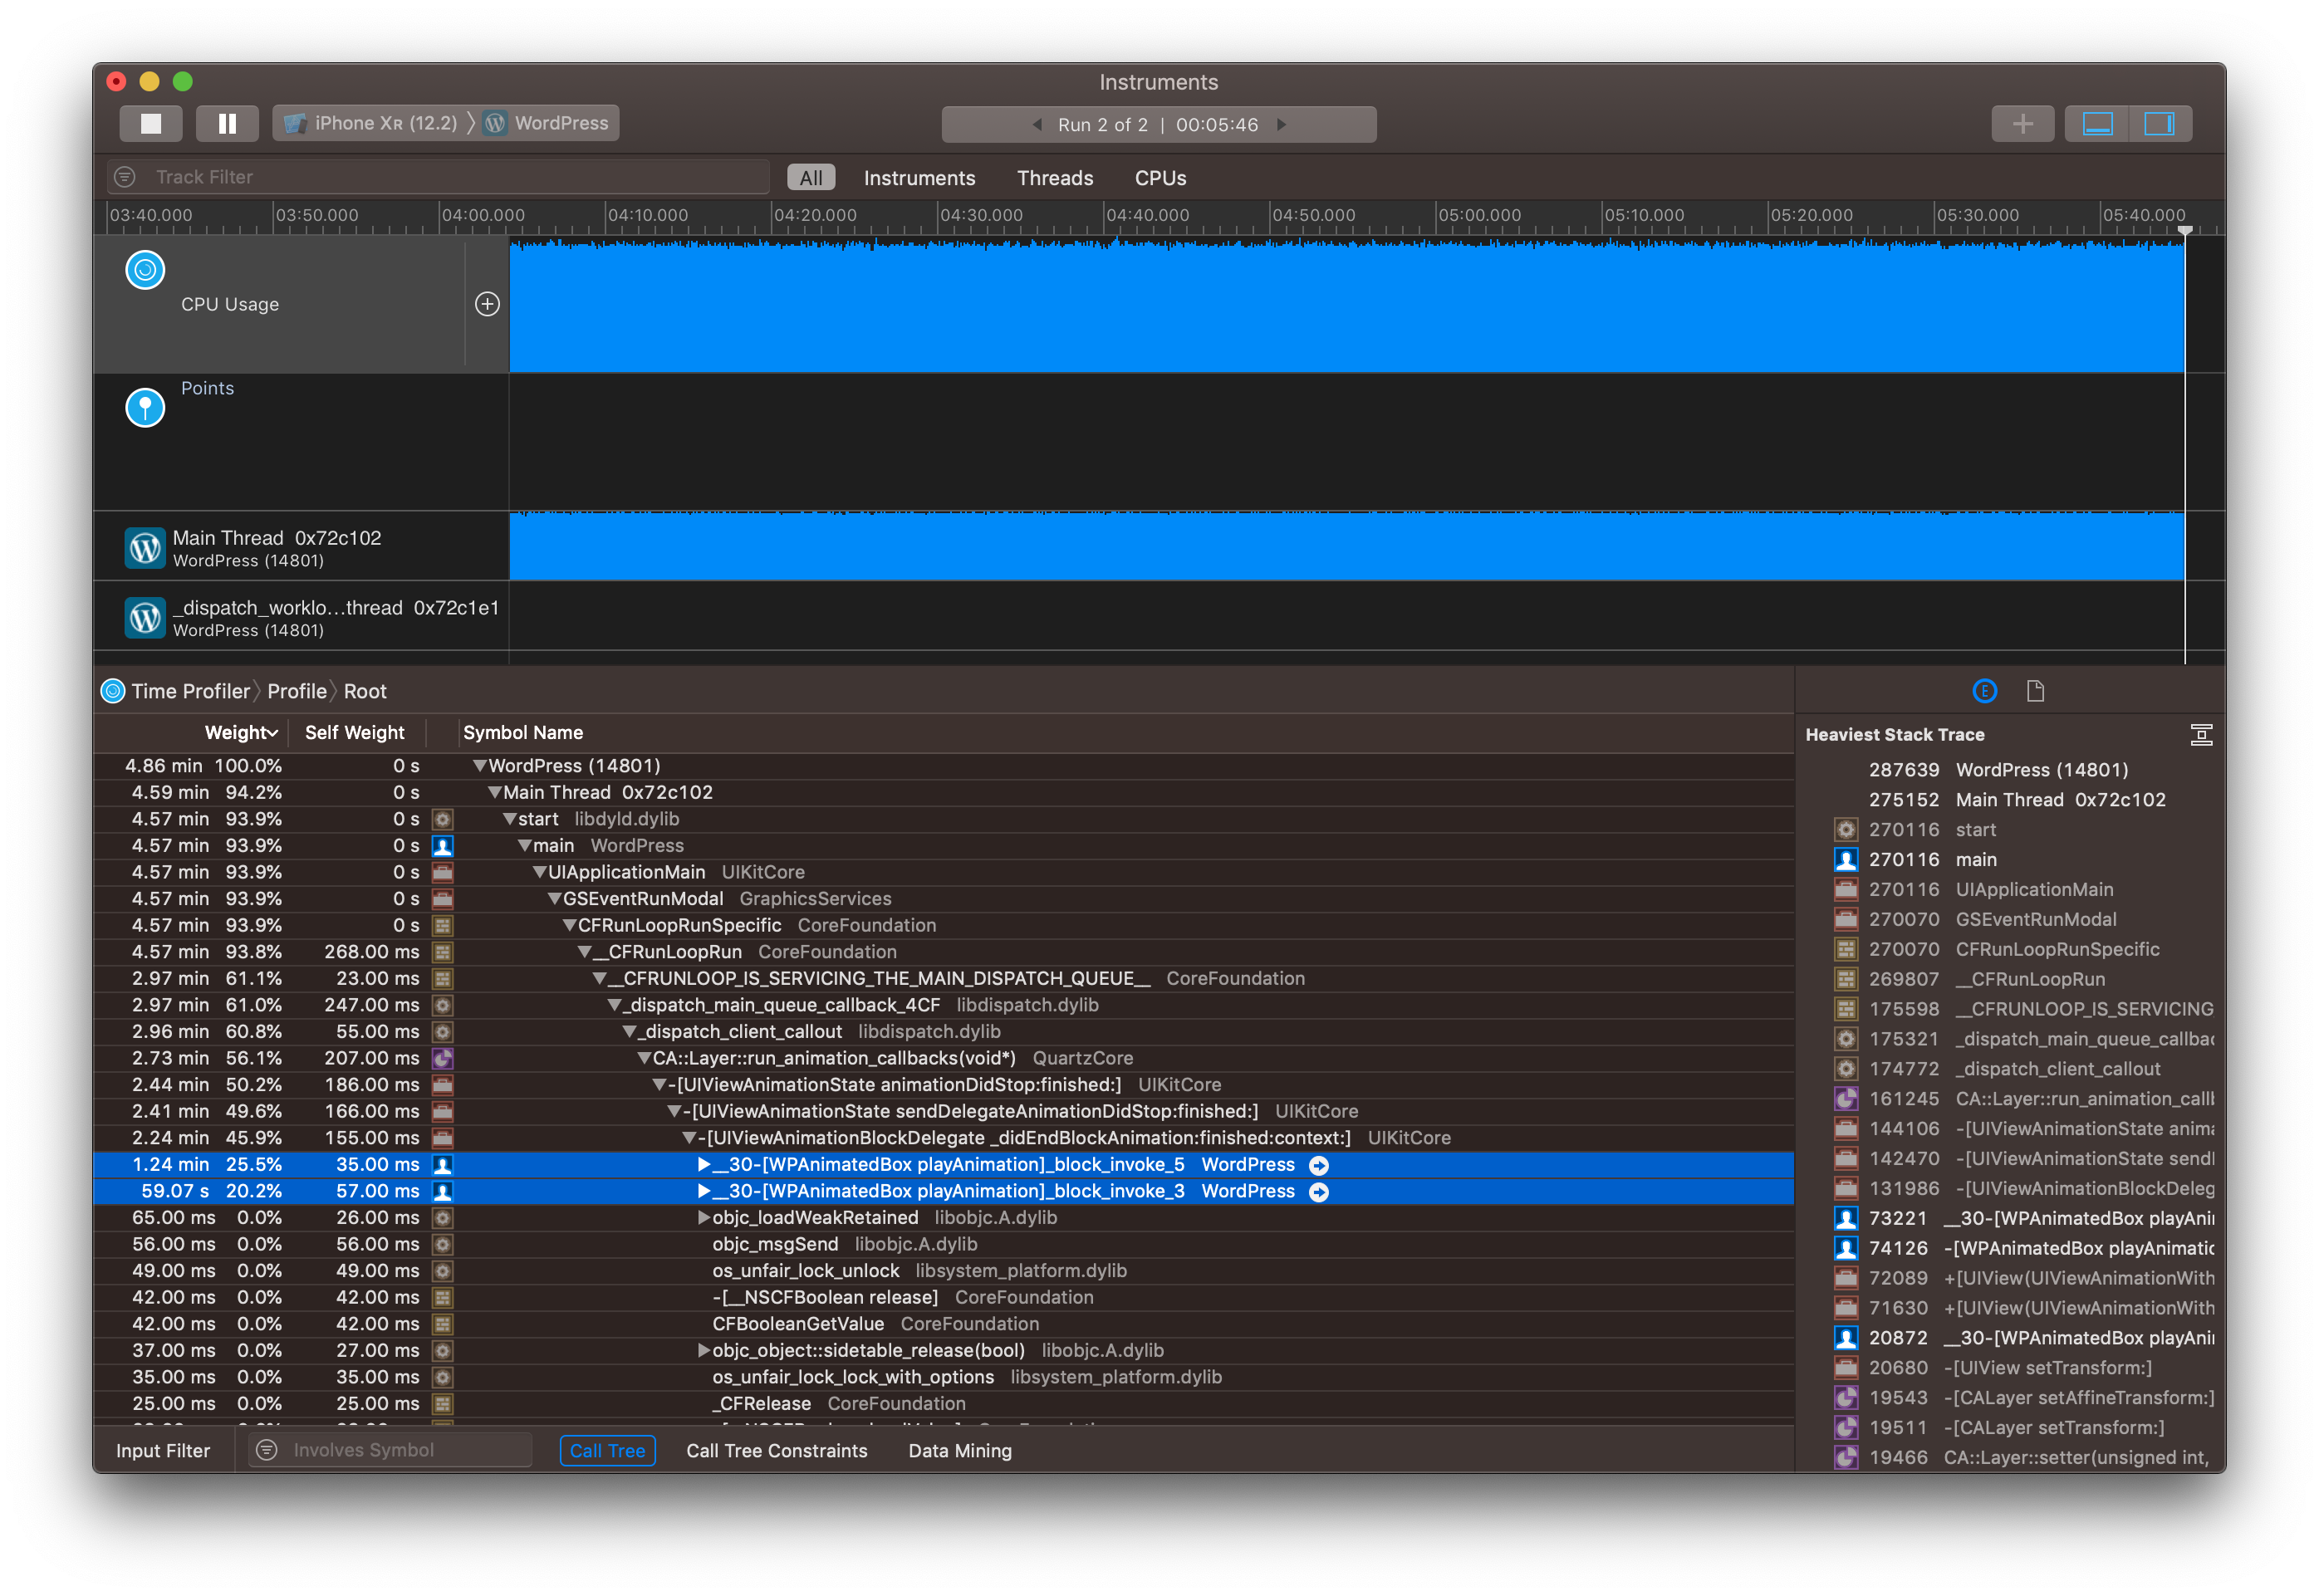
Tested on develop as of 2019-07-18 on the simulator.
 jkmassel
All 6 comments
Raising to high priority because this could potentially be an unpleasant drain on batteries everywhere and because it could be causing various difficult-to-reproduce crashes reported by users which are hard to trace back to anything specific in the code.
 designsimply
on 18 Jul 2019
designsimply
on 18 Jul 2019
 frosty
on 19 Jul 2019
frosty
on 19 Jul 2019
I was just testing this, but I don't see the issue on post list view controller. Since we merged @leandroalonso's recent redesign, we don't use animated box on the post list any more. I also ran through most of the other sections of the app that I could find that use animated box and couldn't recreate this issue. 🤔
frosty
on 19 Jul 2019
So this is a little bit WTF.
I can repro the issue on develop _if_ I'm running instruments. If I'm not, it doesn't happen.
Even more weirdly, I have other issues when running with instruments attached. I can't load my own posts on any blog (only the "Everyone" list, which includes my own). Also, I can't log in without the app crashing.
This is the same binary – doing build + run with Xcode doesn't cause it, but closing the app, opening Instruments, and launching the same app again by hitting "start recording" _does_ cause these issues.
I'm wondering if Instruments is enabling some kind of additional runtime protections that are causing issues? It's a bit of a stretch, but I _suspect_ the login crash _may_ be caused by a Core Data warnings that's emitted at login? I have no idea why the post list fetching wouldn't work – possibly Core Data merging from the main thread and something not being happy there? But then I don't know why the "Everyone" list would work – I'd expect those to be the same code?
I've Googled around for this a bit, but I'm not even sure what I'm searching for - I've never seen something like this.
jkmassel
on 19 Jul 2019
I think the most probable explanation here is that adding Instrument to the mixes changes timing of things enough to make some data races have different outcomes than "usually", and therefore causing stuff like the 100% CPU utilisation and Core Data weirdnes?
 jklausa
on 26 Jul 2019
jklausa
on 26 Jul 2019
I'm closing this because it's only related to using Instruments. Also, I was personally unable to recreate it :(
@jkmassel please reopen if you disagree.
 nheagy
on 29 Jul 2019
nheagy
on 29 Jul 2019
Related issues
 jleandroperez
·
3Comments
jleandroperez
·
3Comments
 rclations
·
3Comments
rclations
·
3Comments
 SiobhyB
·
3Comments
designsimply
·
3Comments
SiobhyB
·
3Comments
designsimply
·
3Comments
 ScoutHarris
·
3Comments
ScoutHarris
·
3Comments
Most helpful comment
I'm closing this because it's only related to using Instruments. Also, I was personally unable to recreate it :(
@jkmassel please reopen if you disagree.