Walletwasabi: Wasabi GUI memory usage is high
On Windows, Wasabi is consuming more than 1.5GB memory however, if we run it in daemon mode (without graphical interface) it consumes less than 400MB.
On Linux it doesn't consumes so much but after a dumping the heap we see that, Avalonia.Rendering.SceneGraph.VisualNode, Avalonia.PriorityLevel, Avalonia.PriorityValue, Avalonia.PriorityBindingEntry, System.Collections.Generic.LinkedListNode1[[Avalonia.PriorityBindingEntry, Avalonia.Base]], Avalonia.PriorityLevel+RemoveBindingDisposable
$  dotnet-dump collect --process-id <WASABI_PID>
$ dotnet-dump analyze <MINIDUMP_FILEPATH>
> dumpheap
00007fd255a1a6f8     7529       421624 Avalonia.Styling.TypeNameAndClassSelector+ClassObserver
00007fd255423be8     8790       421920 NBitcoin.Script
00007fd252ee3ac8    10912       436548 System.UInt16[]
00007fd255336c20    10916       436640 System.Net.IPAddress
00007fd255a1f4d0     7917       444920 System.IObserver`1[[System.Boolean, System.Private.CoreLib]][]
00007fd2542e1c20    12195       487800 Avalonia.Utilities.SingleOrQueue`1[[System.Object, System.Private.CoreLib]]
00007fd2527221c8     6724       524824 System.SByte[]
00007fd2533cdca0    17112       547584 System.Collections.Generic.List`1[[System.IDisposable, System.Private.CoreLib]]
00007fd2553420b8    12197       585456 NBitcoin.Protocol.NetworkAddress
00007fd252fe34e8     5939       617656 System.Reflection.RuntimeMethodInfo
00007fd2564069f8        4       655520 System.Int32[,]
00007fd2564c4690    11565       662904 Avalonia.Rendering.SceneGraph.IVisualNode[]
00007fd2542e20b8    21260       680320 Avalonia.Reactive.LightweightObservableBase`1+RemoveObserver[[System.Object, System.Private.CoreLib]]
00007fd2533cdb68    17064       682560 System.Reactive.Disposables.CompositeDisposable
00007fd255a1b170     7861       691768 Avalonia.Styling.ActivatedValue
00007fd2542c9c18    21671       693472 System.Collections.Generic.List`1[[System.IObserver`1[[System.Object, System.Private.CoreLib]], System.Private.CoreLib]]
00007fd256404bc0    10882       696448 NBitcoin.Protocol.AddressManager+AddressInfo
00007fd25274d470     5665       718260 System.Int32[]
00007fd2542ce4d8    19161       766440 System.Collections.Generic.LinkedList`1[[Avalonia.PriorityBindingEntry, Avalonia.Base]]
00007fd2542cbfe8    16058       770784 Avalonia.Utilities.SingleOrDictionary`2[[System.Int32, System.Private.CoreLib],[Avalonia.PriorityLevel, Avalonia.Base]]
00007fd252715510     6076       787160 System.Object[]
00007fd2541833c0    12323       788672 System.EventHandler`1[[Avalonia.Controls.ResourcesChangedEventArgs, Avalonia.Styling]]
00007fd251c9c798    32932       790368 System.Object
00007fd2542ced00    20618       824720 Avalonia.PriorityLevel+RemoveBindingDisposable
00007fd2540491a0    14280       913920 System.EventHandler`1[[Avalonia.AvaloniaPropertyChangedEventArgs, Avalonia.Base]]
00007fd2564adf18       79       916992 System.Collections.Generic.Dictionary`2+Entry[[Avalonia.VisualTree.IVisual, Avalonia.Visuals],[Avalonia.Rendering.SceneGraph.IVisualNode, Avalonia.Visuals]][]
00007fd252f34888    15857      1014848 System.Action
00007fd254180198    16284      1042176 System.Collections.Specialized.NotifyCollectionChangedEventHandler
00007fd2540479c0     9298      1049840 Avalonia.Utilities.AvaloniaPropertyValueStore`1+Entry[[System.Object, System.Private.CoreLib]][]
00007fd2533ce050    17252      1070816 System.IDisposable[]
00007fd2542cebd0    24506      1176288 System.Collections.Generic.LinkedListNode`1[[Avalonia.PriorityBindingEntry, Avalonia.Base]]
00007fd2542ca158    21672      1213600 System.IObserver`1[[System.Object, System.Private.CoreLib]][]
00007fd2542cbb10    19161      1226304 Avalonia.PriorityLevel
00007fd25429a140    16058      1284640 Avalonia.PriorityValue
00007fd2542cddd8    24506      1568384 Avalonia.PriorityBindingEntry
00007fd252720f90    32541      2390136 System.String
00007fd2527214c0    41686      2832482 System.Byte[]
00007fd2564abdb8    15496      4586816 Avalonia.Rendering.SceneGraph.VisualNode
00007fd255343ef8   129030      6193440 NBitcoin.uint256
00007fd2561892b0   122547      6862632 System.Collections.Generic.SortedSet`1+Node[[System.Collections.Generic.KeyValuePair`2[[System.Int32, System.Private.CoreLib],[NBitcoin.uint256, NBitcoin]], System.Private.CoreLib]]
 lontivero
All 13 comments
It'd be better to profile this on windows as profiling tools in linux is not in a good shape as it is now...
 jmacato
on 18 Nov 2019
jmacato
on 18 Nov 2019
@jmacato it's an important issue, we cannot have it being forgotten, so if your comment means you're giving up on this, then please say it explicitly and someone else takes it over.
 nopara73
on 18 Nov 2019
nopara73
on 18 Nov 2019
@nopara73 Sorry but I didnt mean to convey that I'm giving up on this one. I already have some ideas/tests to be done to determine the probable cause of this (Skia EGL or the hit-test allocs issue). I just meant that it'd be better for me to test this in Windows/Windows VM rather in my current environment
jmacato
on 18 Nov 2019
This result and the subsequent one would be done on a Windows 8.1 VM with Visual Studio 2019.
First Test: Wasabi Idle + Loading Empty Wallet
- Min. : 150 MB
- Max. : 345 MB
Second Test : Loading testnet wallet + opening coinjoin tab
- Min. : 400 MB
- Max. : 690 MB
jmacato
on 19 Nov 2019
Started CoinJoin on RegTest with 3 instances. No user interaction in this test!
Windows 10 x64 - master
In Power shell - dotnet run -c Release
After setup 14:00

Started CoinJoins
End of test 15:30

 molnard
on 19 Nov 2019
molnard
on 19 Nov 2019
@molnard I got a similar result here too..
jmacato
on 19 Nov 2019
It's the coinlist. I have about 100 coin in my wallet. I can open or close the coinjoin or the send tab and see how it goes from 500MB-ish to 1-1.5GB and back down when closing those tabs.
nopara73
on 19 Nov 2019
Using JetBrains dotMemory; I opened Wasabi and a testnet wallet, then opened CoinJoin tab.
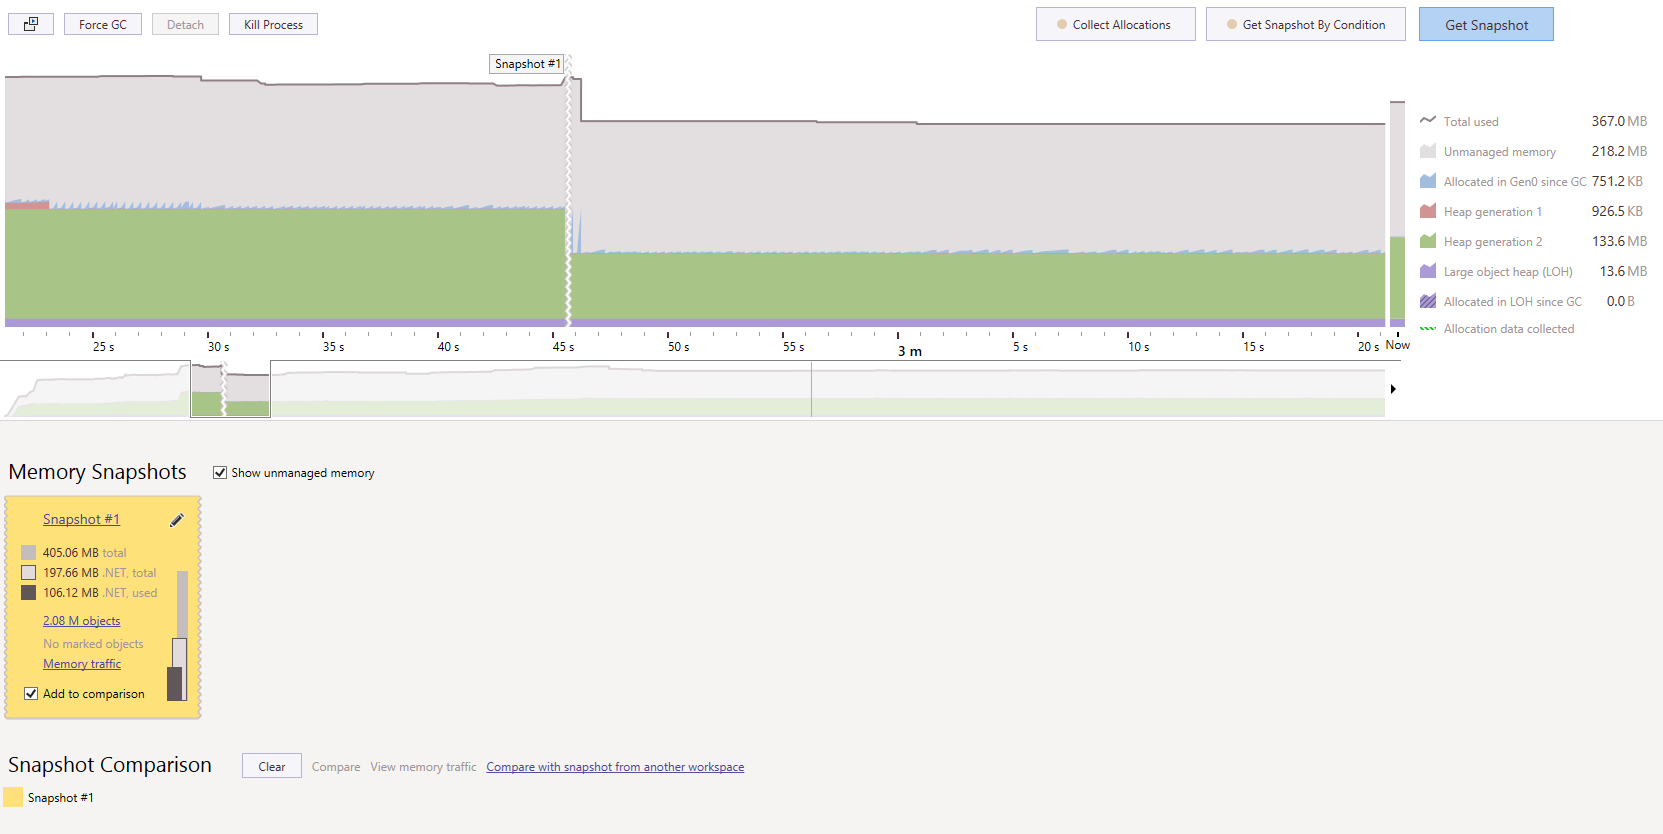
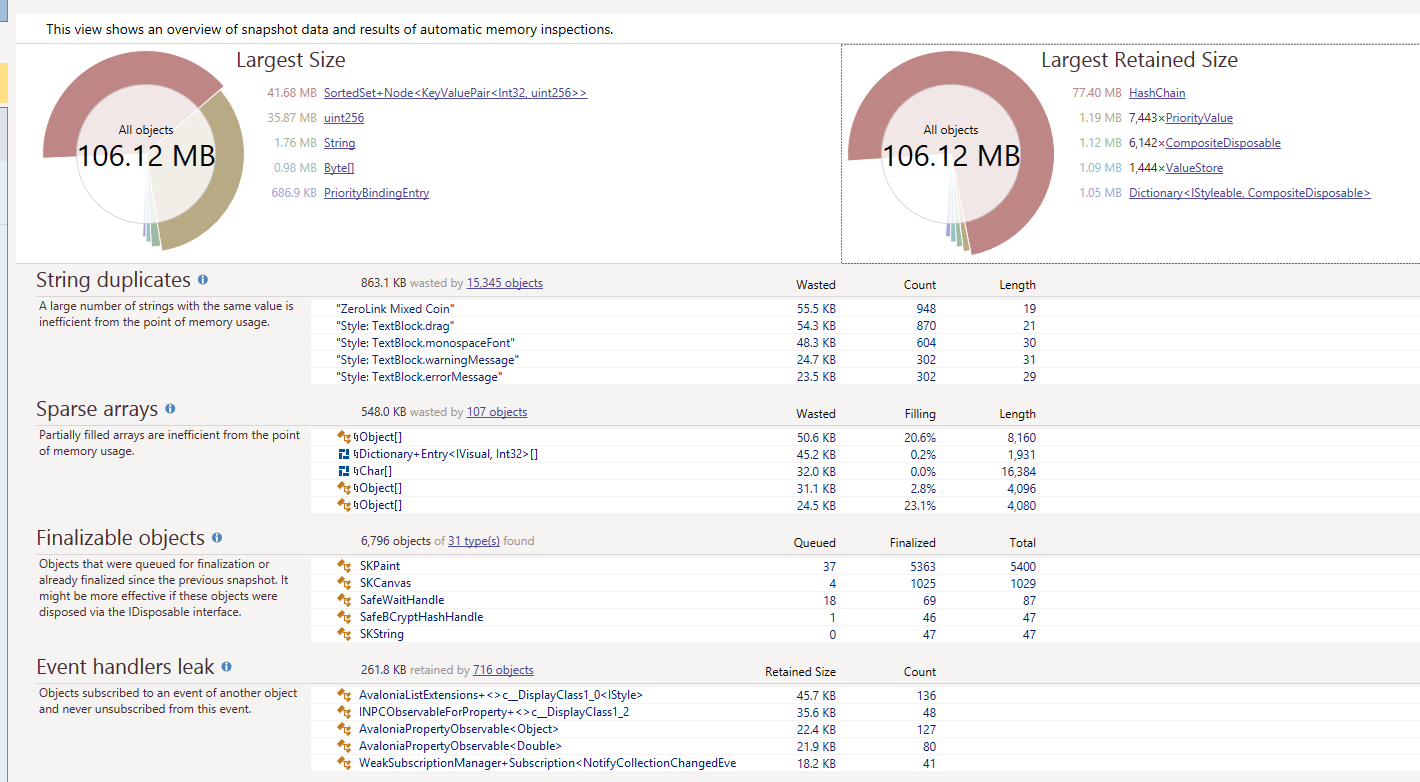
Basically, a significant chunk of memory is on unmanaged heap. I'll try to run Wasabi without EGL and see if it helps.
jmacato
on 19 Nov 2019
I agree, it cannot be on managed memory. In fact your results are identical to the ones I got:
00007fd2542cddd8    24506      1568384 Avalonia.PriorityBindingEntry
00007fd252720f90    32541      2390136 System.String
00007fd2527214c0    41686      2832482 System.Byte[]
00007fd2564abdb8    15496      4586816 Avalonia.Rendering.SceneGraph.VisualNode
00007fd255343ef8   129030      6193440 NBitcoin.uint256
00007fd2561892b0   122547      6862632 System.Collections.Generic.SortedSet`1+Node[[System.Collections.Generic.KeyValuePair`2[[System.Int32, System.Private.CoreLib],[NBitcoin.uint256, NBitcoin]], System.Private.CoreLib]]
This is not a lot of memory so, the problem has to be somewhere else.
lontivero
on 19 Nov 2019
@nopara73 @lontivero @molnard Please try disabling EGL by changing AllowEGLInitialization to false on Program.cs; I'm seeing significant memory usage change but i want to confirm on your side first. This setting only affects Windows btw. Here's the result of me disabling it w/ same scenario as I previously posted:
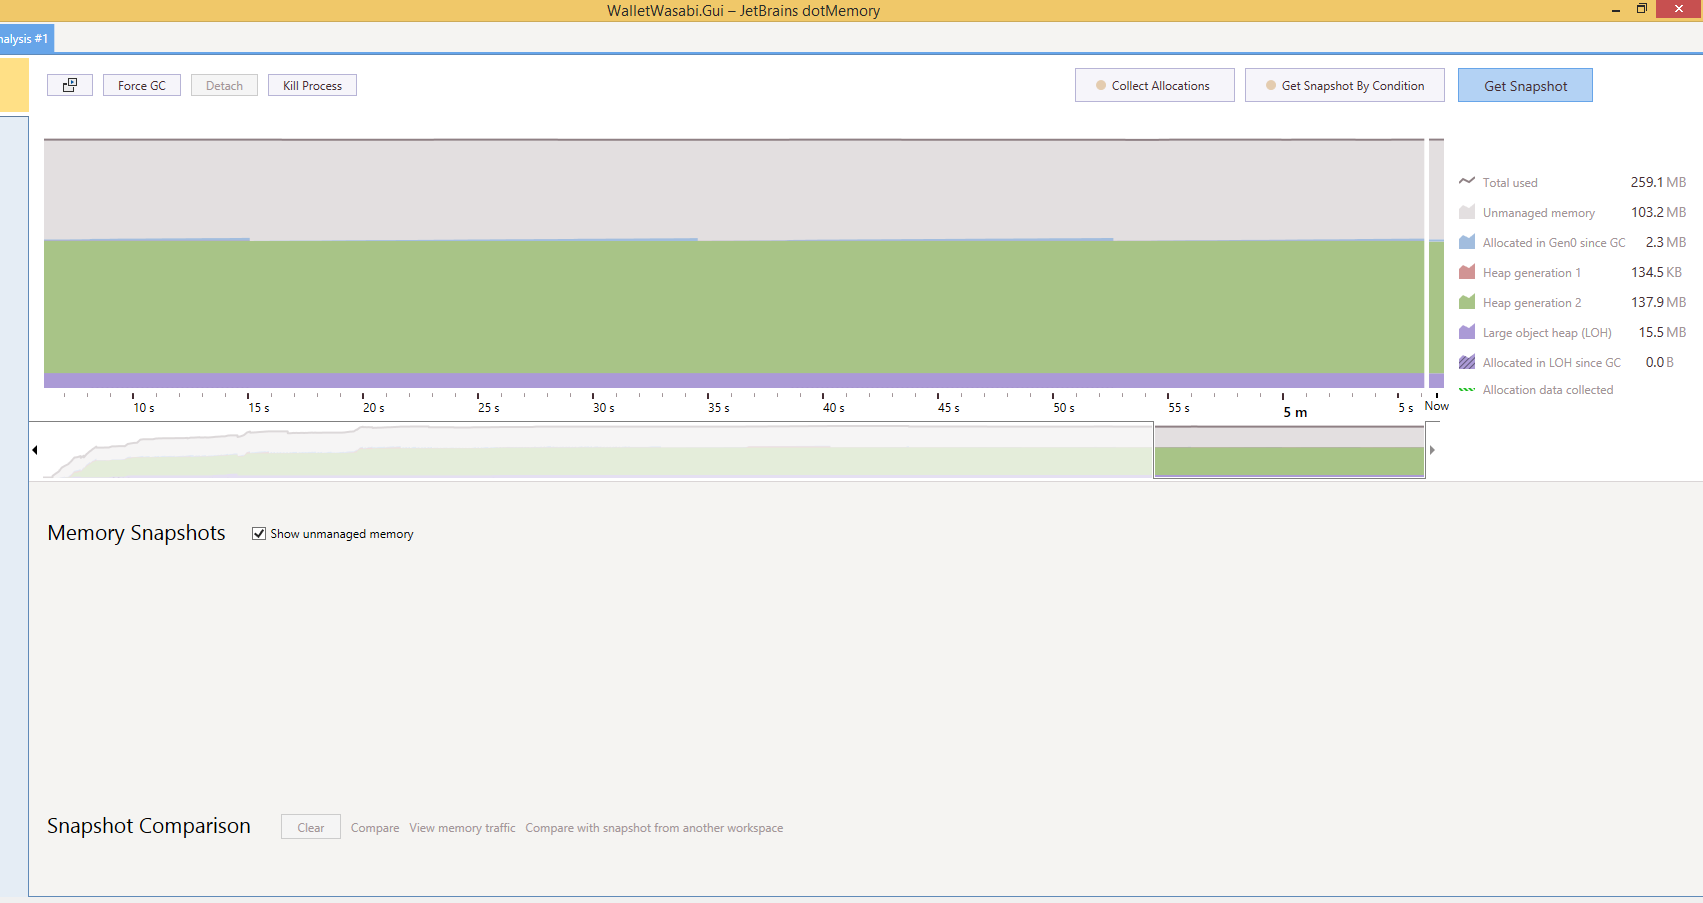
jmacato
on 19 Nov 2019
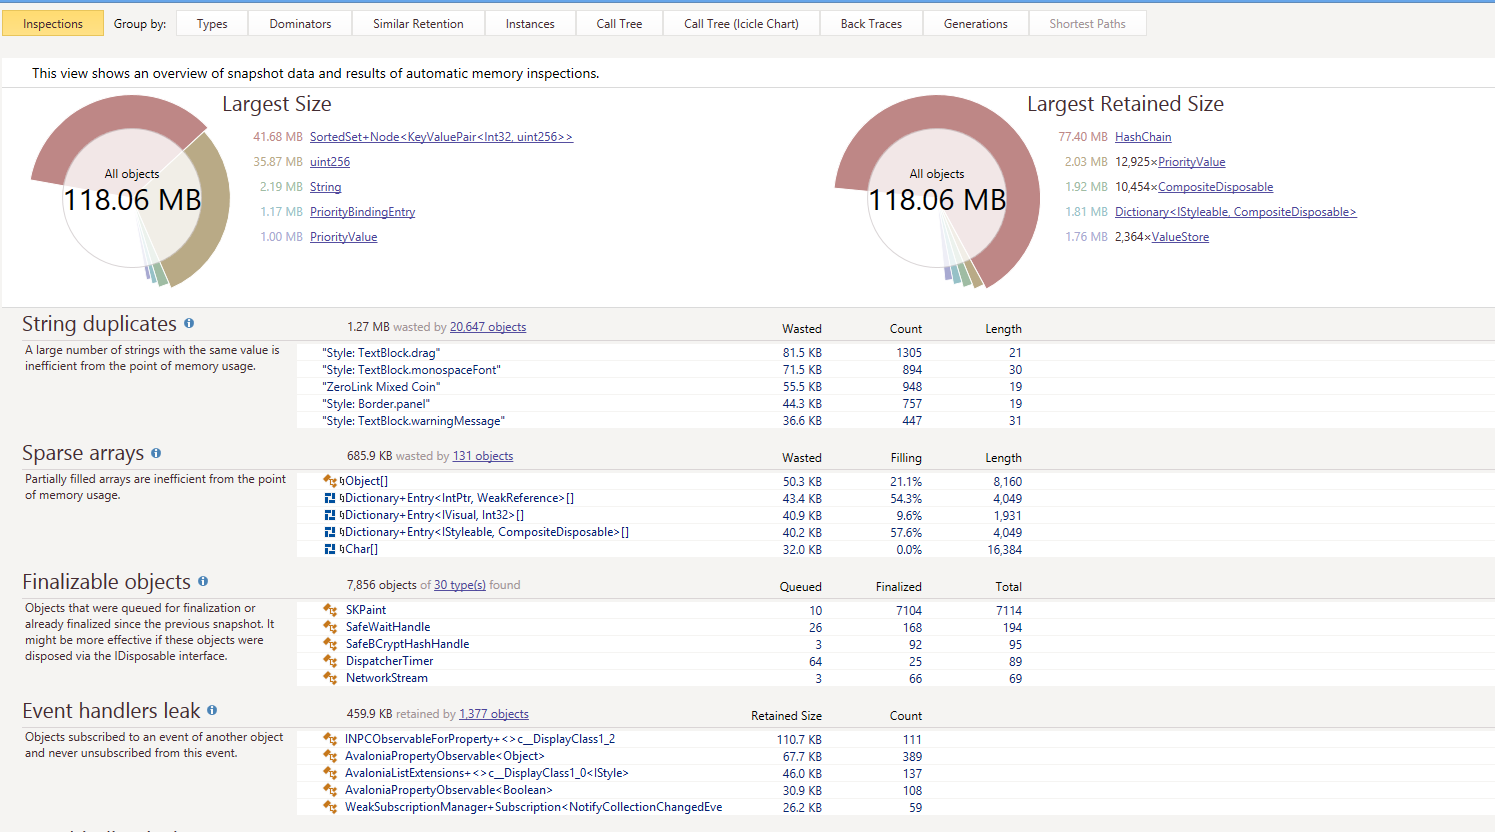
The amount of duplication that TextBlock.monospaceFont text has, in my opinion, indicates/corroborates @nopara73 's comment of CoinList being a culprit of the huge memory usage.
jmacato
on 19 Nov 2019
@jmacato has a branch here that helps with scroll speed and decreases memory usage.
 MaxHillebrand
on 27 Nov 2019
MaxHillebrand
on 27 Nov 2019
Solved by this: https://github.com/zkSNACKs/WalletWasabi/pull/3024
molnard
on 12 Feb 2020
Related issues
MaxHillebrand
·
3Comments
molnard
·
3Comments
 RiccardoMasutti
·
3Comments
RiccardoMasutti
·
3Comments
 kenny47
·
3Comments
kenny47
·
3Comments
 the-metalworker
·
3Comments
the-metalworker
·
3Comments