Vscode: File watcher resulting in high CPU use on Mac/Linux for large folders
We are using chokidar for file watching. Chokidar is known for performing bad over large folders (see https://github.com/paulmillr/chokidar/issues/410). To investigate:
- can we consume a newer version of chokidar with the scalability issue fixed
- can we change our watching strategy to only watch what we need instead of always watching root
- can we switch to another watching library that is more efficient
Workaround:
Find the large folders in your workspace and add them under the files.watcherExclude setting
 bpasero
All 100 comments
@bpasero i'll keep an eye on improving the scalability in chokidar to fit into the release. Let me know if you have a specific test repo (with large folders?) to check the performance.
 paulmillr
on 15 Mar 2016
paulmillr
on 15 Mar 2016
Some good ones are TypeScript (https://github.com/Microsoft/TypeScript) and of course the full Chromium workspace is probably the largest I know: https://chromium.googlesource.com/chromium/src.git
bpasero
on 15 Mar 2016
Just checked TypeScript, it consumes around 80% of one core for ~2 seconds and then it's back to 0%.
Cloning Chromium.
paulmillr
on 15 Mar 2016
Although when useFsEvents is false (non-default option on OSX), the CPU usage becomes terrible.
I'll investigate the new PR in chokidar too.
paulmillr
on 15 Mar 2016
is there some workarounds for now?
I'm using a macbook air with the latest version of vscode
 sibelius
on 11 May 2016
sibelius
on 11 May 2016
@sibeliusseraphini there is a way to exclude large folders from watching in settings. It has a downside though that file events are no longer detected in those folders (e.g. the explorer might not update properly for that folder).
bpasero
on 11 May 2016
is there a simple way of marking a folder as an excluded one? like in Webstom?
it should also be possible to invalidate the cache/file watching or restart it as well
sibelius
on 11 May 2016
Currently not. See http://code.visualstudio.com/updates/vMarch#_workbench and find Exclude files from watching
bpasero
on 11 May 2016
How does one determine if this slowness is bug #3998?
 rob9
on 2 Jun 2016
rob9
on 2 Jun 2016
There are some peculiar statements about file watchers in these github issues: I have used them extensively, they work, so I expect this here for Linux to be some JavaScript problem.
I installed version 1.1.1 likeso:
sudo dpkg -i vscode-amd64.deb
If I do:
sudo nano /usr/share/code/resources/app/node_modules/chokidar/lib/fsevents-handler.js
and modify line 7 to:
try { fsevents = require('fsevents'); } catch (error) {fs.writeFileSync('/tmp/y', 'Error: ' + error.stack)}
then relaunch Visual Studio Code
I get:
less /tmp/y
Error: Error: Cannot find module './build/Release/fse'
    at Function.Module._resolveFilename (module.js:339:15)
    at Function.Module._load (module.js:290:25)
    at Module.require (module.js:367:17)
    at require (internal/module.js:16:19)
    at Object.<anonymous> (/usr/share/code/resources/app/node_modules/fsevents/fsevents.js:9:14)
    at Module._compile (module.js:413:34)
    at Object.Module._extensions..js (module.js:422:10)
    at Module.load (module.js:357:32)
    at Function.Module._load (module.js:314:12)
    at Module.require (module.js:367:17)
So that's just the check for OS X, chokidar instead runs fs.watchFile which is correct.
What is the get-around, how does people immediately make it work in a way that is meaningful?
Apparently it's been around since November, 2015.
rob9
on 3 Jun 2016
This is a total buggy bug. I have it on two Linux laptops, all of a sudden one is no longer slow. I'll use that one :)
It seems like code in the troubled state does something extremely cpu intensive on every save. What peculiar activity is started by save and takes 80 seconds for a 7,000 geekbench core?
rob9
on 3 Jun 2016
@rob9 is it the same folder you open in both instances and in one it is slow and in the other not?
bpasero
on 3 Jun 2016
It's several babel projects on two machines. Some projects are the same.
A project that was initially slow, suddenly is fast and the problem is gone. It seems horrible task triggered by save keeps restarting until something changes, then things are good. In good state a save is less than 3 s of high cpu. On the computer that is now fast, I can't find a slow project anymore, so maybe it's once per installation. One machine was new install, other an upgrade to try to remedy the problem, both to 1.1.1 in the last days.
If I see it again I'll do some lsof and such to try to figure out what's happening.
rob9
on 3 Jun 2016
I'm not sure what this "file watcher" is, but all I know is using vscode with unity (in place of mono develop) results in a climbing cpu memory usage (electron helper) that becomes unbearable at a point. At that point, restarting vscode temporarily fixes the issue for me.
I'm assuming this bug is related to the issues I'm having.
What exactly does the file watcher do and is there a way to disable it?
Would disabling it be a bad idea?
 shaneparsons
on 22 Jun 2016
shaneparsons
on 22 Jun 2016
@shaneparsons the idea for this setting is to ignore watching folders for file changes that contain resources you do not work with (e.g. do not show in the explorer or search in). Taking out large folders from file watching will have a positive impact on performance.
bpasero
on 22 Jun 2016
@shaneparsons @bpasero This is also happening with me and we are using VSCode for Unity development. But what is strange is that I never noticed anything before the latest release 1.3, but now its making the editor completely unusable.
 hartbit
on 22 Jul 2016
hartbit
on 22 Jul 2016
@shaneparsons the idea for this setting is to ignore watching folders for file changes that contain resources you do not work with (e.g. do not show in the explorer or search in). Taking out large folders from file watching will have a positive impact on performance.
What's the difference between the files.exclude and the files.watcherExclude? Are paths listed in the exclude needed in the watcherExclude as well?
shaneparsons
on 22 Jul 2016
I had set the files.watcherExclude to exclude the roof folder of my program. But the CPU also use over 120%. The IntelliSense don't show until 10 or more seconds later. I'm using VSCode 1.3.1 for Unity3D.
 LeonsChun
on 1 Aug 2016
LeonsChun
on 1 Aug 2016
files.exclude and the files.watcherExclude are separate settings that do not share any logic.
bpasero
on 6 Aug 2016
It seems like watcherExclude patterns are handled differently than exclude patterns. For example if I have "tmp": true in my files.exclude object then the tmp folder does not appear in the explorer but if I add "tmp": true to my files.watcherExclude object then it does not exclude the tmp folder from being watched. Only if I change the pattern to "**/tmp": true is it excluded from being watched.
 jsturgis
on 30 Mar 2017
jsturgis
on 30 Mar 2017
Looking forward to a fix for the issue.
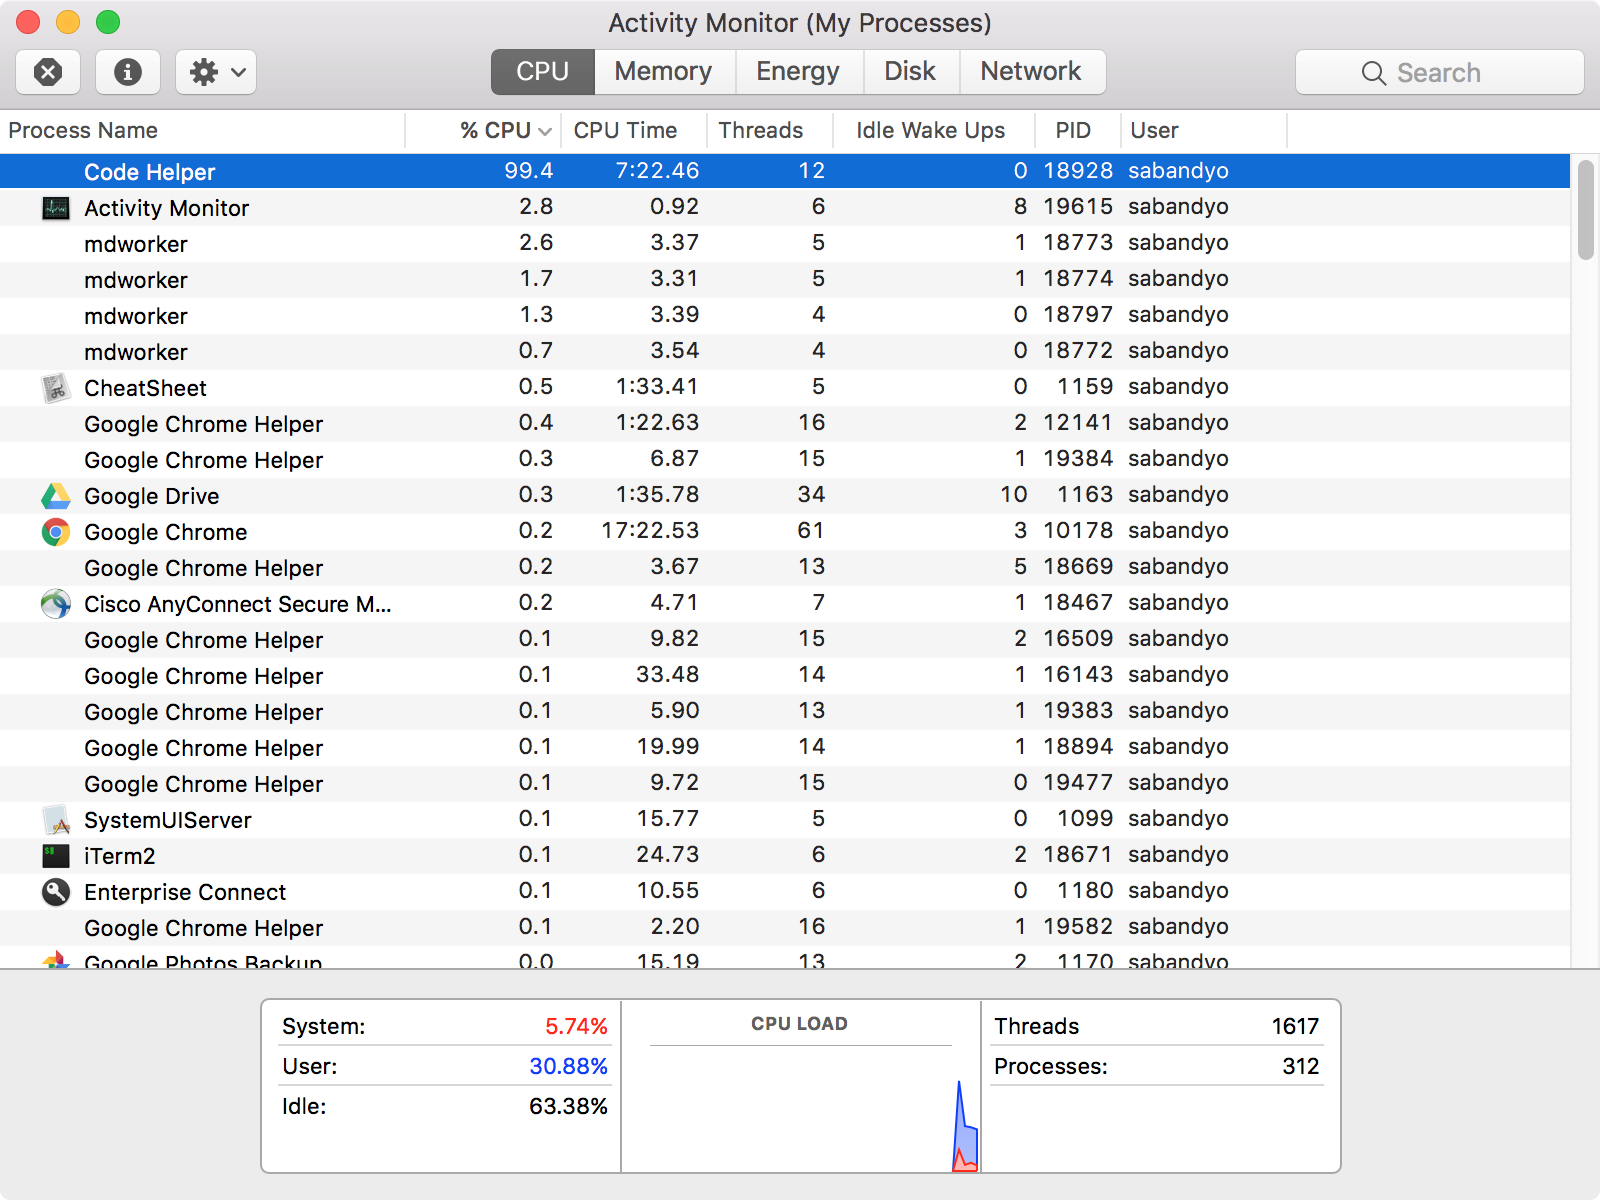
 sarbbottam
on 2 Sep 2017
sarbbottam
on 2 Sep 2017
@sarbbottam this could be any of our processes, please find out the full command args via ps aux | grep
bpasero
on 2 Sep 2017
@bpasero as shared earlier it is watcherService
USER               PID  %CPU %MEM      VSZ    RSS   TT  STAT STARTED      TIME COMMAND
sabandyo         21629 100.0  1.7  3443632 279484   ??  R    11:45PM   2:35.69 /Applications/Visual Studio Code.app/Contents/Frameworks/Code Helper.app/Contents/MacOS/Code Helper /Applications/Visual Studio Code.app/Contents/Resources/app/out/bootstrap --type=watcherService
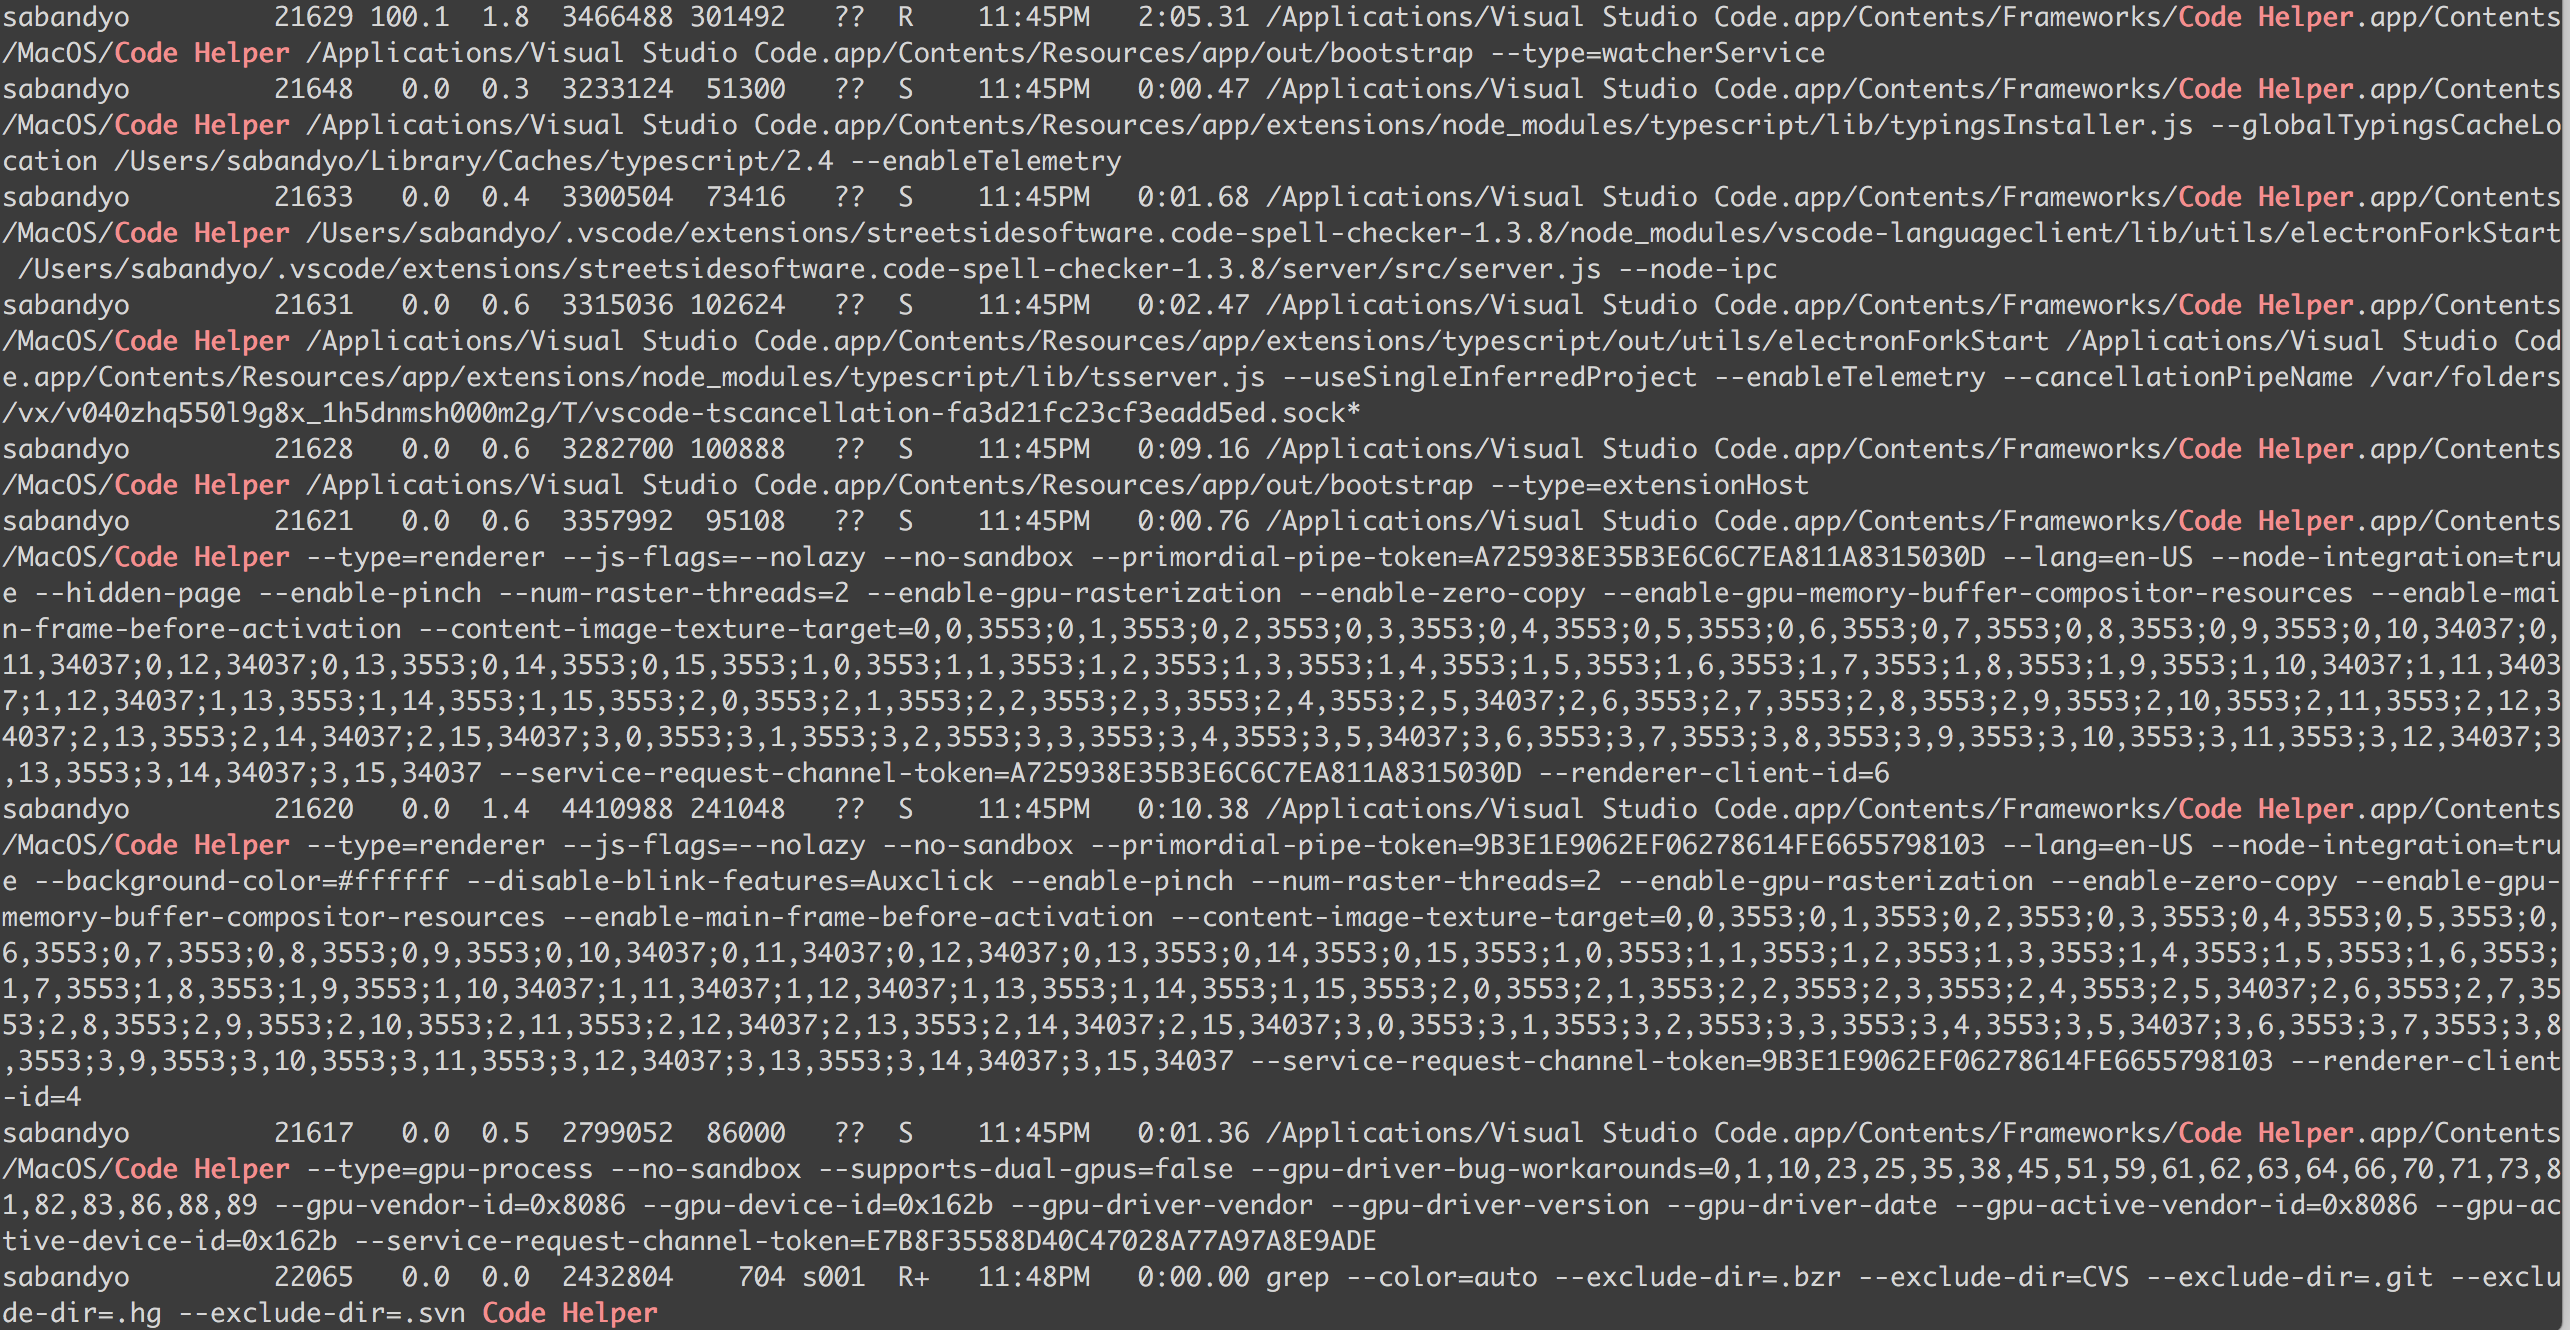
sarbbottam
on 2 Sep 2017
@sarbbottam as a workaround (for everyone here), you can configure "files.useExperimentalFileWatcher": true via settings to switch to our new watcher service.
bpasero
on 2 Sep 2017
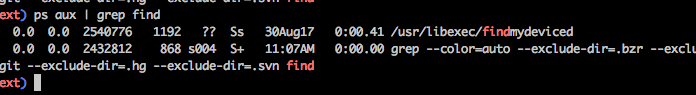
what about this (which appear only when i run vscode):
before I run vs code (total cpu used : 15%):
after i run vscode (and did some file/code searchs) -> total cpu used 50%:
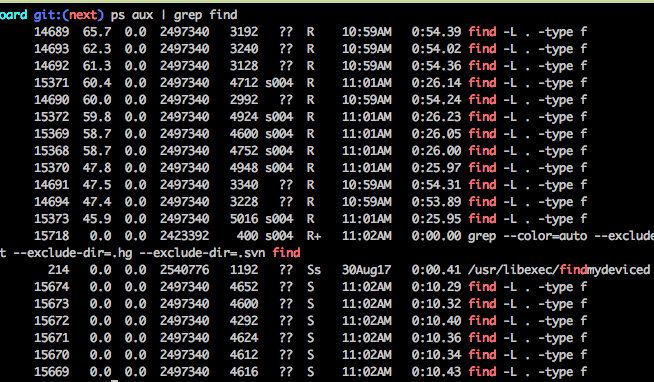
after I quit vscode (cmd+q) :
ps aux | grep find is the same when running vs code, but with total cpu used = 80%. And no way to go down but to kill -9 all find -L .type f processes
 ngouy
on 7 Sep 2017
ngouy
on 7 Sep 2017
The same (high cpu) happens on my Ubuntu 16.04 with "files.useExperimentalFileWatcher": true
First, I narrowed down a problem to single directory. In my case: $HOME/.wine. Then I found that there is a symbolic link to root directory inside wine directory.
Here is how you can reproduce the error:
$ mkdir loop
$ ln -s / loop/root
$ code loop
What is interesting - the problem seems to NOT occur when I create relative symbolic link. Let's consider link to parent dir using relative path (should be ok):
$ ln -s ../ link1
and link to parent dir using absolute path (this causes problem again):
$ ln -s $(pwd) link3
Let's create absolute link again, but for sub directory:
$ mkdir not-a-loop
$ mkdir subdir
$ ln -s $(pwd)/subdir link
As we can expect, for the above example vscode works correctly. For me, it looks like infinite loop :)
 p-romanski
on 20 Sep 2017
p-romanski
on 20 Sep 2017
Same boat as @ngouy even with "files.useExperimentalFileWatcher": true
My machine is loaded with 100's of find -L drops.
 timothysc
on 3 Oct 2017
timothysc
on 3 Oct 2017
What I found is "files.useExperimentalFileWatcher": true solves an initial problem of high CPU, but introduces a bug with symbolic link loop (see my comment above)
p-romanski
on 3 Oct 2017
Just chiming in here. The "Code Helper" process uses a constant 142% CPU on my Mac if I have my home folder (~) open in Explorer.
Setting "files.useExperimentalFileWatcher": true reduces CPU level to normal.
 Phillipus
on 10 Oct 2017
Phillipus
on 10 Oct 2017
@p-romanski can you file that link loop as a separate issue, we should forward it to the file watcher library we are using. Best with reproducible steps!
bpasero
on 11 Oct 2017
Chokidar is now disabled by default, unless "files.useExperimentalFileWatcher" is set to false (the default is true).
bpasero
on 26 Oct 2017
I'm having the same problems on Ubuntu 16.04 with 1.17.2. The /usr/share/code/resources/app/out/bootstrap --type=watcherService thread is consuming 100% CPU and ultimately crashes vscode due to OOM eventually. I've experimented with all permutations of "files.useExperimentalFileWatcher" true and false, and with the "files.watcherExclude" setting, all to no resolvement.
Unfortunately this is a critical bug for me and I cannot use vscode for this project, since it has a large (50Gb+) build output within it. I had to revert to other editors, which is unfortunate.
Is there something I can do to help out to debug or trace to identify the problem?
 sveinse
on 31 Oct 2017
sveinse
on 31 Oct 2017
@sveinse what if you configure this to disable the file watcher for the workspace:
"files.watcherExclude": {
  "**": true
}
I tried
    "files.useExperimentalFileWatcher": true,
    "files.watcherExclude": {
        "**": true
    }
Then that work if I set useExperimentalFileWatcher to false. If it is true, then it consumes 100% CPU. Likewise if I put anything else in stead of "**", specifically my build output directory, then this consumes 100% CPU regardless of the experimental flag set true or false.
sveinse
on 1 Nov 2017
@sveinse how about setting "files.useExperimentalFileWatcher": false and the files.watcherExclude only to that one large folder you have?
bpasero
on 1 Nov 2017
@bpasero, no that does not help. Setting something else than "**" in exlude, will result in 100% CPU regardless of the experimental flag.
sveinse
on 1 Nov 2017
@sveinse what did you try to as setting to exclude that large folder?
bpasero
on 1 Nov 2017
@bpasero
    "files.useExperimentalFileWatcher": false,
    "files.watcherExclude": {
        "yocto/build/**": true
    }
@sveinse I fear that path needs to either be absolute or it needs to start with a "**" too, e.g. **/yocto/build/**
bpasero
on 2 Nov 2017
That seems to work -- and I see that the help in the settings actually does mention the need for abs. path or "**" prefix in "files.watcherExclude", which I missed. I blindly assumed that "files.exclude" and "files.watcherExclude" used the same file pattern scheme. My bad.
With a proper "files.watcherExclude" pattern, I need to keep "files.useExperimentalFileWatcher" to false to prevent 100% CPU load. Setting it to true will load the CPU full even with proper exclude pattern.
@bpasero: This resolves "my" issue. There is an issue with the new filewatcher and exclude patterns as mentioned above, but you already know that. Since you reopened this issue based on my report, I vote for closing it again.
sveinse
on 3 Nov 2017
For me works only when
"files.useExperimentalFileWatcher": false,
    "files.watcherExclude": {
        "**/big_folder/**": true
    }
And only for one folder opened in VSCode - not a Workspace.
I have tried all the filter combinations to make it work in a Workspace mode. No result.
A workaround is not to use a Workspace and to add symlinks(ln -s) to the additional folders into the single opened folder.
 zhelnio
on 22 Nov 2017
zhelnio
on 22 Nov 2017
I also notice that the CPU/Memory usage is very high when in workspace mode. It even maxed out my 32gig Xeon octa-core with or without the above settings
 deepu105
on 6 Dec 2017
deepu105
on 6 Dec 2017
It would be nice if large folders didn't cause this issue. Why does vscode need to watch everything? Why not just watch the open files?
 Fusty
on 4 Jan 2018
Fusty
on 4 Jan 2018
I am flagging the issue here as it seems closely related. When VSCode cant find a module that you are requiring it will result it high CPU load instead of a graceful error message. In the screen shot I am requiring individual methods from the 'express-validator' library. Since VSCode cant find it, it seems to go into free-fall and repeatedly throws the same error message as can be seen from the developer view.
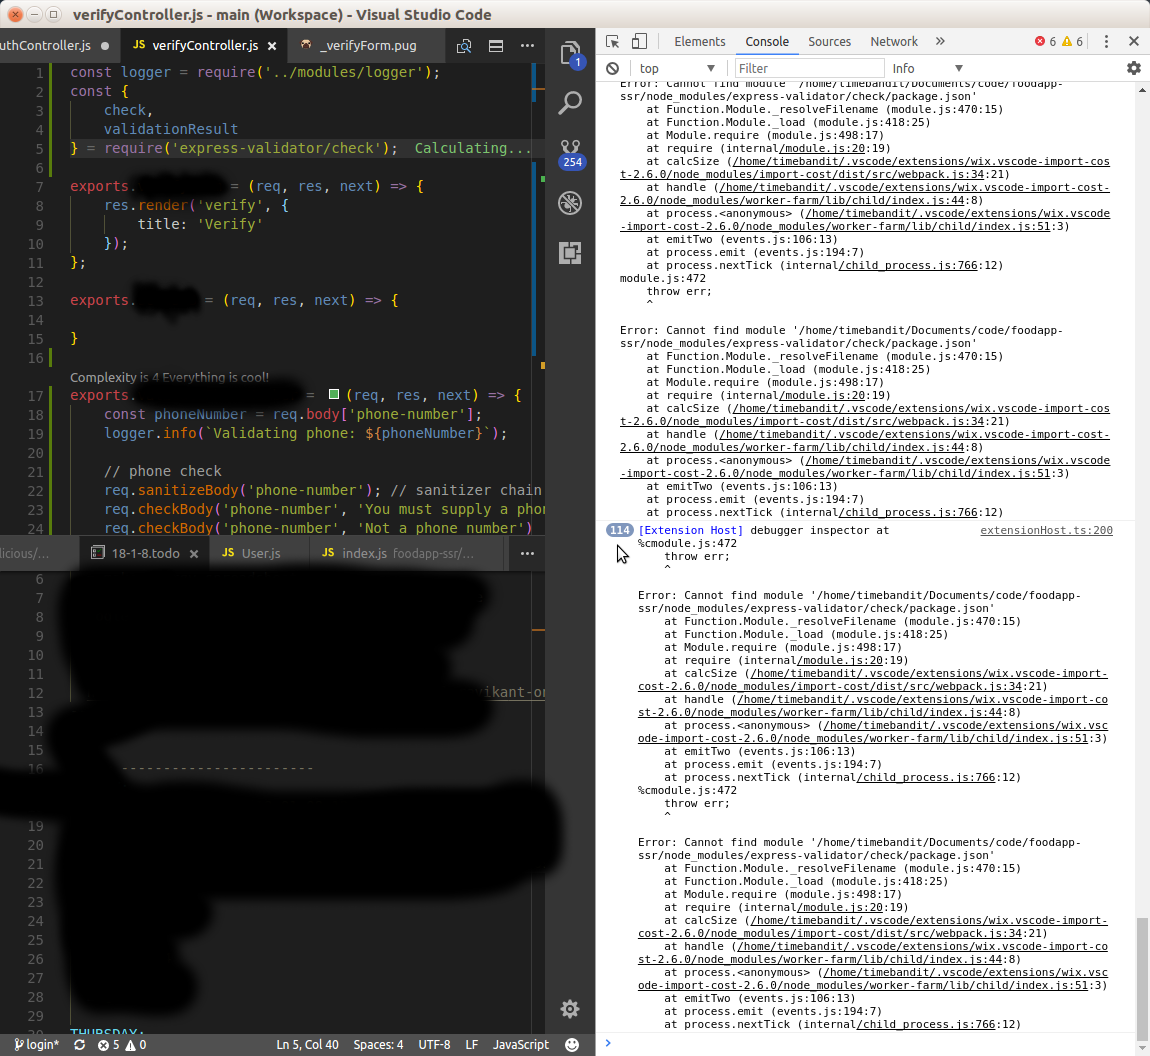
It took me a while to figure out what was going on and I considered going back to Sublime Text after two weeks. The editor should be giving a friendly warning not turning my work station into a fan heater :-)
My work around for now is to simply comment out the code and to restart VSCode.
 TimeBandit
on 9 Jan 2018
TimeBandit
on 9 Jan 2018
I'm raising this issue against the 'import-cost' extension, you can close it here if you wish but on principle I don't think that an extension should have the ability to paralyse the host app.
TimeBandit
on 9 Jan 2018
for me this worked for every environment so far:
"files.watcherExclude": {
  "**/**": true
}
 waldemar-p
on 14 Jan 2018
waldemar-p
on 14 Jan 2018
Issue is fixed in import-cost version 2.6.2, sorry for the trouble...
 shahata
on 17 Jan 2018
shahata
on 17 Jan 2018
Is there anyway to automatically apply gitignore files to files.watcherExclude ??
 adamcavendish
on 23 Feb 2018
adamcavendish
on 23 Feb 2018
I'm raising this issue against the 'import-cost' extension, you can close it here
I'm not using import-cost, yet I see constant 100% CPU core load on watcherService, even in safe mode.
 lolmaus
on 26 Feb 2018
lolmaus
on 26 Feb 2018
Wow, this issue has been open for two thirds of VSCode existence. I've just realized I'm running into it on my main project. This is a show stopper for me: my laptop only has two CPU cores. :unamused:
Top post says:
Workaround: Find the large folders in your workspace and add them under the
files.watcherExcludesetting
But how do I do that?! The only exclusion pattern that worked for me was "**", which is obviously unusable. I tried various other suggestions from this thread and none of them worked.
lolmaus
on 26 Feb 2018
Sorry, I've realized I have a huge tmp/ folder in my project. This helped:
    "files.watcherExclude": {
        "**/.git/objects/**": true,
        "**/node_modules/**": true,
        "**/tmp/**": true
    }
I'm not having any of these issues on Mac on the VSCode Insiders edition anymore (installed yesterday from .dmg).
(not sure if my CPU problems were related to the file watcher; I was going the Insiders (from sources) path so that I can debug it. ymmv.)
(edit: scrap that, there still are runaway CPU issues, I'm trying to find a way how to debug what's causing it)
 youurayy
on 15 Mar 2018
youurayy
on 15 Mar 2018
I am seeing quite constant high CPU usage with VSCode as well. The output of code --status for me is:
Version:          Code 1.22.2 (3aeede733d9a3098f7b4bdc1f66b63b0f48c1ef9, 2018-04-12T16:32:53.389Z)
OS Version:       Darwin x64 17.5.0
CPUs:             Intel(R) Core(TM) i7-7700K CPU @ 4.20GHz (8 x 4200)
Memory (System):  24.00GB (1.21GB free)
Load (avg):       4, 5, 8
VM:               0%
Screen Reader:    no
Process Argv:     /Applications/Visual Studio Code.app/Contents/MacOS/Electron -psn_0_40970

CPU %   Mem MB     PID  Process
    0      147     334  code main
    0       74     384     gpu-process
    0       98     449     shared-process
    0      319   20843     window (BUCK — apps)
    0       98   20844       extensionHost
  218      516   20845       watcherService

Workspace Stats:
|  Window (BUCK — apps)
|    Folder (apps): more than 20000 files
|      File types: java(7399) xml(6727) js(3190) kt(801) json(444) png(296)
|                  gradle(153) rb(57) class(29) sq(26)
|      Conf files: settings.json(1)
 shepting
on 3 May 2018
shepting
on 3 May 2018
Is there a way to see the logs from the watcherService to see if I could be ignoring any directories thrashing with changes?
shepting
on 3 May 2018
I'm seeing this problem too with VS Code 1.25.1 on macOS. I opened ~/ to edit my .bashrc and then left VS Code open. It started consuming lots of CPU.
I see that many people are experiencing this same problem and opening duplicate issues.
As a mitigating measure, would it help to somehow detect when the file watcher has been tasked with watching a directory that's too large, and then display a warning to the user? The warning could recommend a course of action and/or point to this issue.
 nchammas
on 29 Jul 2018
nchammas
on 29 Jul 2018
This issue sometimes happens to me when I return from sleep with VS Code open. Most of the time, this large project works totally fine, but then 30% of the time after I wake from sleep, the CPU is thrashing at 100%. Even if I close VSCode and/or kill Code Helper, it stays at 100% until I restart. I don't believe I've seen it happen outside of this scenario.
MacOS 10.12.6, VSCode 1.26.0
 bbugh
on 15 Aug 2018
bbugh
on 15 Aug 2018
@bbugh same problem!
MacOS 10.12.6, VSCode 1.26.1
 sashablazhko
on 28 Aug 2018
sashablazhko
on 28 Aug 2018
Same having this issue
VS Code: Version 1.27.2 (1.27.2)
macOS 10.13.6
 mdrideout
on 4 Oct 2018
mdrideout
on 4 Oct 2018
Same issue here.
Also I've posted another issue because File Watcher exclude seems not to work. (https://github.com/Microsoft/vscode/issues/61393)
Also I think the problem with File Watcher exclude is that it tries to scan all the files and folders (and after that initial scan it is not being watched). But my question is: Why it doesn't stop scanning when the root folder which the watcher should ignore is reached? I shall note, this is only the assumption (because after 30 minutes the CPU usage dropped down - I guess that it's the time needed for the scan) since there's no log for watcherService.
This should really be fixed, because a lot of people may have large directories. It's 2 years now.
 Honzys
on 22 Oct 2018
Honzys
on 22 Oct 2018
Same issue here.
Status:
$ code --status                                                                                               (py37)

Version:          Code 1.28.2 (7f3ce96ff4729c91352ae6def877e59c561f4850, 2018-10-17T00:18:43.347Z)
OS Version:       Darwin x64 17.7.0
CPUs:             Intel(R) Core(TM) i7-8559U CPU @ 2.70GHz (8 x 2700)
Memory (System):  16.00GB (0.23GB free)
Load (avg):       6, 7, 7
VM:               0%
Screen Reader:    no
Process Argv:     -psn_0_110619
GPU Status:       2d_canvas:                    enabled
                  checker_imaging:              disabled_off
                  flash_3d:                     enabled
                  flash_stage3d:                enabled
                  flash_stage3d_baseline:       enabled
                  gpu_compositing:              enabled
                  multiple_raster_threads:      enabled_on
                  native_gpu_memory_buffers:    enabled
                  rasterization:                enabled
                  video_decode:                 enabled
                  video_encode:                 enabled
                  webgl:                        enabled
                  webgl2:                       enabled

CPU %   Mem MB     PID  Process
   14       49     634  code main
    0       16     681     gpu-process
    0       16     731     window (region_data.py — planet4)
    0       16     833       extensionHost
    0       16    1006         /Users/klay6683/.vscode/extensions/ms-python.python-2018.9.1/languageServer.0.1.42/Microsoft.Python.LanguageServer
    0       16     836       watcherService
    0       33     776     shared-process
    0       33    1478     window (Welcome — planet4)
    0       16    1479       extensionHost
   99     2277    1480       watcherService
 michaelaye
on 23 Oct 2018
michaelaye
on 23 Oct 2018
"files.watcherExclude": {
        "**/.git/objects/**": true,
        "**/node_modules/**": true,
        "**/tmp/**": true
    }
@lolmaus
Fixed the problem for me, used to have around ~30% of CPU usage on my laptop, but ever since I added this to config vscode is not even noticeable, lightweight as a feather ;)
Although I've had this problem ever since 1.24 I believe, earlier had no such issues
 BobrImperator
on 19 Mar 2019
BobrImperator
on 19 Mar 2019
But that would disable git plugins, I guess?
michaelaye
on 19 Mar 2019
Took me ages to find this issue when I was troubleshooting this so thought I'd mention Terraform here to help others.
Most terraform repos use a .terraform working directory which can contain a large number of files. This was affected by this issue and confirmed resolved by adding:
"files.watcherExclude": {
    "**/.terraform/**": true
}
 dijitali
on 10 Apr 2019
dijitali
on 10 Apr 2019
@dijitali Thank you! I had the exact same problem with a terraform project.
 USSliberty
on 1 May 2019
USSliberty
on 1 May 2019
if have this in my config:
"files.watcherExclude": {
"**": true,
},
And watcherService is currently consuming:
4,8G virtual memory and 50% CPU..
Environment:
lastest vscode
manjaro linux KDE fully updated.
I'm leaving vscode real soon
 tpihl
on 14 May 2019
tpihl
on 14 May 2019
can go to vscode settings and found workspace and Files column and find the Watcher Exclude column and click Add Pattern button and choose the folder you don't want the vscode to watch
 DamengRandom
on 17 May 2019
DamengRandom
on 17 May 2019
fix known ??
 TheHunterDog
on 8 Jun 2019
TheHunterDog
on 8 Jun 2019
for me, @BobrImperator's suggestion of adding this text was the key:
"files.watcherExclude": {
        "**/.git/objects/**": true,
        "**/node_modules/**": true,
        "**/tmp/**": true
    }
I had already had the first 2 lines. The third line, excluding the tmp directory, immediately dropped the watcher to 49mb, down from almost 1700. Add it in your excludes. It's in the common settings menu for those unaware (cmd+comma).
 matt-potts
on 24 Jun 2019
matt-potts
on 24 Jun 2019
If someone is having a similar problem but with ripgrep instead, I had it fixed with this config
    "files.exclude": {
        "**/.git/objects/**": true,
        "**/.git/subtree-cache/**": true,
        "**/dist/**": true,
        "**/node_modules/**": true,
        "**/tmp/**": true
    },
    "files.watcherExclude": {
        "**/.git/objects/**": true,
        "**/.git/subtree-cache/**": true,
        "**/dist/**": true,
        "**/node_modules/**": true,
        "**/tmp/**": true
    },
    "search.exclude": {
        "**/node_modules/**": true,
        "**/bower_components": true,
        "**/dist/**": true,
        "**/tmp/**": true,
        "**/.git/objects/**": true,
        "**/.git/subtree-cache/**": true
    },
I didn't notice any problems while coding, the only thing, is that the node_modules for example is not in the tree view, so if you want to inspect it, you'll need to manually open another vscode instance in that directory, which for me happened to be a better way to inspect ember addons.
The ripgrep service would use 80% of CPU on startup and then after a quite a long moment, use 30% without really doing anything with vscode
BobrImperator
on 25 Jun 2019
@BobrImperator Thank you. What I'm not getting is that having "**/.git/** should take care of all of the directories under .git, due to how globs work, shouldn't it?
 balinterdi
on 26 Jun 2019
balinterdi
on 26 Jun 2019
You might be right, I'm not sure anymore why I have it configured this way :D
BobrImperator
on 26 Jun 2019
I currently have this setting:
  "files.watcherExclude": {
    "**/.git/objects/**": true,
    "**/.git/subtree-cache/**": true,
    "**/node_modules/**": true,
    "**/tmp/**": true
  },
but I'm still seeing ~90% of CPU use from lsof in Code.
 zebralight
on 3 Aug 2019
zebralight
on 3 Aug 2019
 messified
on 30 Oct 2019
messified
on 30 Oct 2019
Also on MacOS 10.14.6, MBP 2017. watcherService is relentless - it just won't stop, been consuming >50% CPU the whole working day at this point.
Given that MacOS users make up a good chunk of developer community...this is a dealbreaker.
 worldomonation
on 9 Nov 2019
worldomonation
on 9 Nov 2019
Any time I write files into a workspace directory, the bootstrap-fork --type=watcherService is pinned to 100% cpu for the entirety of the time. I often write nontrivially-sized files for testing, so this happens almost every day. If I'm running some code doing file writes, this issue essentially doubles the cpu utilization of the operation.
Something really needs to be done about this. There is no reason for VSCode to be notified of every single file modification done. It just needs to know "soon enough" that a file modification has happened. Those event notifications can be chunked by some reasonable interval like 500ms. The chunking interval could even be some sort of slow start increasing logistic S function with a cap of like 1 second. Basically, the watcherService should ignore rapid consecutive file modifications that occur within a given interval, and instead issue a single batch event after that interval.
I even tried disabling all extensions and the issue persists. It seems to be an issue with the core FileSystemWatcher, which is where the event firing deferring needs to be built in.
 theferrit32
on 28 Nov 2019
theferrit32
on 28 Nov 2019
There is an option to extend intervals. What is your operating system?
paulmillr
on 28 Nov 2019
@paulmillr that's good to hear, I'm on Linux. What do I need to change to make the watch interval longer?
theferrit32
on 30 Nov 2019
The interval option is named interval: 500 etc, see https://github.com/paulmillr/chokidar#api
paulmillr
on 4 Dec 2019
@zebralight It seems that watcher exclude rules stop working (at least on linux) on workspaces with more than one root folder added to the list (left workspace panel). So if you have .git or node_modules sub-directories in a multi-folder workspace that might be the reason why cpu goes high.
See how to verify using strace: https://github.com/microsoft/vscode/issues/59679#issuecomment-555054743
For now I use this workaround to run vscode with 0 watches, until watcher exclude is fixed:
#!/bin/bash
#skipping inotify_add_watch syscall, without caller noticing (return 0)
(strace -f -e inject=inotify_add_watch:retval=0 -etrace=inotify_add_watch /path/to/code 2>&1) > /dev/null
 ghuser
on 4 Dec 2019
ghuser
on 4 Dec 2019
This is a * joke.
Not sure what you're referring to exactly but this type of post and language does not help solve the issue.
 jgbradley1
on 9 Jan 2020
jgbradley1
on 9 Jan 2020
Aparently this solve to me:
https://github.com/microsoft/TypeScript/issues/22702#issuecomment-398871461
Disable this option
typescript.disableAutomaticTypeAcquisition
 douglasduartetb
on 26 Jan 2020
douglasduartetb
on 26 Jan 2020
I have an ArchLinux VM with 2vCPU and 4GB RAM.
I'm using VSCode 1.42.1.
In this version VSCode has good default values for files.watcherExclude and search.exclude (using files.exclude too).
While idle with VSCode running it's consuming ~4-8% of CPU and 1.20/3.8 GB RAM.
My workdir is 251MB (including node_modules, .git, etc.) and 31MB without node_modules and .git.
But the default settings are not enought, when I launch a search, the whole VM is freezing and it even make the host partially freezing some part of the host UI.
In my version defaults are (for the watcher):
"files.watcherExclude": {
  "**/.git/objects/**": true,
  "**/.git/subtree-cache/**": true,
  "**/node_modules/**": true
}
Which seems nice.
But for the search exclude defaults are as follow + inherits from files.exclude
"search.exclude": {
  "**/node_modules": true,
  "**/bower_components": true,
  "**/*.code-search": true
}
But it doesn't feel right to me. Why only excluding "**/node_modules and not "**/node_modules/** like in files.watcherExclude? Does it change something? Why not excluding bower_components from the watcher too? Why not using **/.git/** in the watcher?
Globally another problem of the exclude option is that the path must specified absolutely (from the FS root as I understand it) and can't from the root of the workdir. Why is this a problem? Because you can't specify something like **/build/**, you probably want to exclude /build/** from the root of many workdirs as it's useless to watch for it or search into it, for many projects it will be in the .gitignore anyway, but a build folder may resides in a path you want to watch so the prefix **/ will be problematic. If the excludes was working from the the root of the workdir instead of the root of the FS it would be possible and easy to use /build/**.
PS: I often use VScode on my host but tend to use neovim in Virtual Machines because VSCode is a resource vacuum in virtual environment. To me it feels the same with all Electron-based app.
 noraj
on 17 Mar 2020
noraj
on 17 Mar 2020
Excluding **/node_modules should not allow any sniffing inside any node_modules folder as they are being ignored?
michaelaye
on 17 Mar 2020
It seems crazy that this is a persistent issue and not solved. It makes VS Code unusable to me. Is there still not a workaround? Is this something that happens to a certain subset of macs?
 joshcho
on 16 Apr 2020
joshcho
on 16 Apr 2020
@joshcho if it’s happening on mac for you, could you provide any additional info? Types of projects this happen on, dir structure
paulmillr
on 16 Apr 2020
maybe if this helps others, this is my files.exclude setting on my Macs and I'm having a good life with vscode:
    "files.exclude": {
        "**/__pycache__": true,
        "**/.cache": true,
        "**/.eggs": true,
        "**/.ipynb_checkpoints": true,
        "**/.mypy_cache": true,
        "**/.pytest_cache": true,
        "**/*.egg-info": true,
        "**/*.feather": true,
        "**/*.parquet*": true,
        "**/*.pyc": true,
        "**/*.zip": true
    },
It's good now, I downloaded the insiders edition and it seems I have had the entire home directory watched for the previous edition D:
joshcho
on 16 Apr 2020
but i do think these settings should be default, as nobody wants to edit binary files or caches in VSCode.
michaelaye
on 16 Apr 2020
OKOK I'm downloading the insider version, code_helper nice job, thanks.
 nyngwang
on 16 Apr 2020
nyngwang
on 16 Apr 2020
I will just mention that I’m NOT running insider on the Mac and still am problem free with above settings.
michaelaye
on 16 Apr 2020
but i do think these settings should be default, as nobody wants to edit binary files or caches in VSCode.
The issue is that the defaults are already goods but freezing are still happenings.
noraj
on 17 Apr 2020
Having same issue. I was starting code in ~. Imagine what happened with CPU usage ...
Can you throttle file watcher? No one really wants code to take down whole system.
 j-mroz
on 12 Aug 2020
j-mroz
on 12 Aug 2020
@douglasduartetb solution worked for me.
 Rafael-Ramblas
on 25 Aug 2020
Rafael-Ramblas
on 25 Aug 2020
I'm trying to understand why VS Code is scanning all my directories, over and over and over again. This polling behavior is just noise on my machine. I want it to stop. How do I disable this?
 leidegre
on 1 Sep 2020
leidegre
on 1 Sep 2020
In my case, this issue was due to switching branches locally so I could pull master to do a rebase. Restarting VS Code fixes the issue immediately for me. Kinda sucky solution, but it works.
 markhicken
on 2 Sep 2020
markhicken
on 2 Sep 2020
This command provides subfolders' filecount fast.
find . -type f | cut -d"/" -f2 | uniq -c
 nuKs
on 19 Sep 2020
nuKs
on 19 Sep 2020
[..] I want it to stop. How do I disable this?
@leidegre Use this workaround
ghuser
on 21 Sep 2020
[..] I want it to stop. How do I disable this?
@leidegre Use this workaround
Thanks for the tip. Unfortunately I'm mostly on Windows.
leidegre
on 29 Sep 2020
[..] I want it to stop. How do I disable this?
@leidegre Use this workaround
Thanks for the tip. Unfortunately I'm mostly on Windows.
Try this one https://github.com/microsoft/vscode/issues/3998#issuecomment-341004916
nuKs
on 30 Sep 2020
Related issues
 chrisdias
·
3Comments
chrisdias
·
3Comments
 v-pavanp
·
3Comments
v-pavanp
·
3Comments
 omidgolparvar
·
3Comments
omidgolparvar
·
3Comments
 vsccarl
·
3Comments
vsccarl
·
3Comments
 mrkiley
·
3Comments
mrkiley
·
3Comments
Most helpful comment
It seems crazy that this is a persistent issue and not solved. It makes VS Code unusable to me. Is there still not a workaround? Is this something that happens to a certain subset of macs?