Vscode-react-native: [Feature] Network inspect
🚀 Feature request
Network Inspect
What scenarios will this solve?
Check the back-end API call,
Displaying the call status on the mobile device will overwrite the operation screen
Implementation plan
- [x] Implement the server side of the Network inspector
- [x] Implement communication with devices and emulators
- [x] Implement communication with Android devices
- [x] Implement communication with Android emulators
- [x] Implement communication with iOS devices
- [x] Implement communication with iOS simulators
- [x] Implement displaying of network requests data
- [x] Add tests for the Network inspector
- [x] Add documentation for the Network inspector
 Gsonovb
All 13 comments
Hi @Gsonovb and thanks for your feedback. What do you mean by:
Displaying the call status on the mobile device will overwrite the operation screen
Also could you please add more context on what exact features do you want to see in extension and how do you want to use them? What backend API calls do you want to check and how? This information will be very helpful for us.
 JiglioNero
on 1 Oct 2020
JiglioNero
on 1 Oct 2020
In my case,
Help friends maintain the program,
They use firebase,
But I want to use it in China,
So we use the forwarding service (replacing the URL of the firebase package),
Sometimes there are problems with the request service, you need to check whether the forwarding service is normal.
I can't access the back-end source code and forwarding server. I can only record the request information through the tool and send it to them for testing.
Gsonovb
on 2 Oct 2020
@Gsonovb This extension is for debugging the React Native application source code. If I understand you correctly you want to debug the source code remotely on other machine? If it so: you need to modify address and port arguments in your Attach to packager scenario. But otherwise I think that this is not the thing that might be done with the React Native Tools extension.
 SounD120
on 2 Oct 2020
SounD120
on 2 Oct 2020
@SounD120 I believe what @Gsonovb wants is to be able to see what network requests are being done by the React Native application and the contents of the responses, similar to the Network tab in the Chrome Developer Tools.
Am I right?
 molant
on 2 Oct 2020
molant
on 2 Oct 2020
@molant Yes,
React can view the request in the web tag in chrome developer tools, but react native runs on the device and cannot be viewed on the computer.
Gsonovb
on 4 Oct 2020
@Gsonovb Got it. We'll consider adding this feature in order of priorities.
SounD120
on 5 Oct 2020
We have investigated ways to display network requests data in the extension and found out the following three ways to do it:
In output channel in VS Code. In this case, all the messages are printed in their full size. The screenshot below is just a draft, which doesn't contain all the information about the requests.

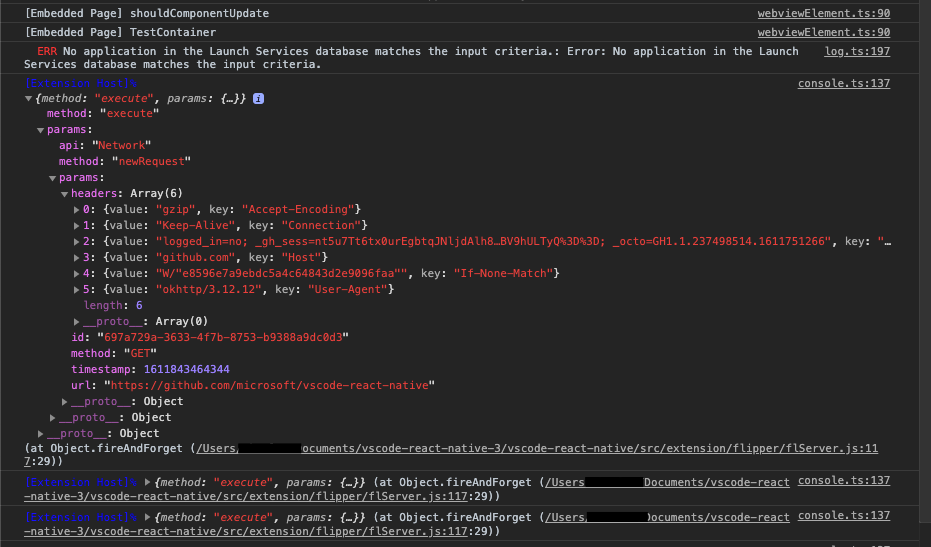
In VS Code DevTools console. In the console we can open and hide properties, this allows to show information in more readable form. However, in this case our network inspector outputs will mix with some other VS Code messages. Below there is an example of printing raw request data. If this way is chosen to implement displaying of network requests data, we will process that data to show only useful information properly.
In VS Code Webview. We could create a web client for our Network inspector backend and run it inside the VS Code webview. We made up prototypes of UI of our Network inspector. We suppose that the Network inspector page should be opened at the second editor column in VS Code, so users could see the application code and requests data at the same time. Below there are prototypes of UI of the inspector.
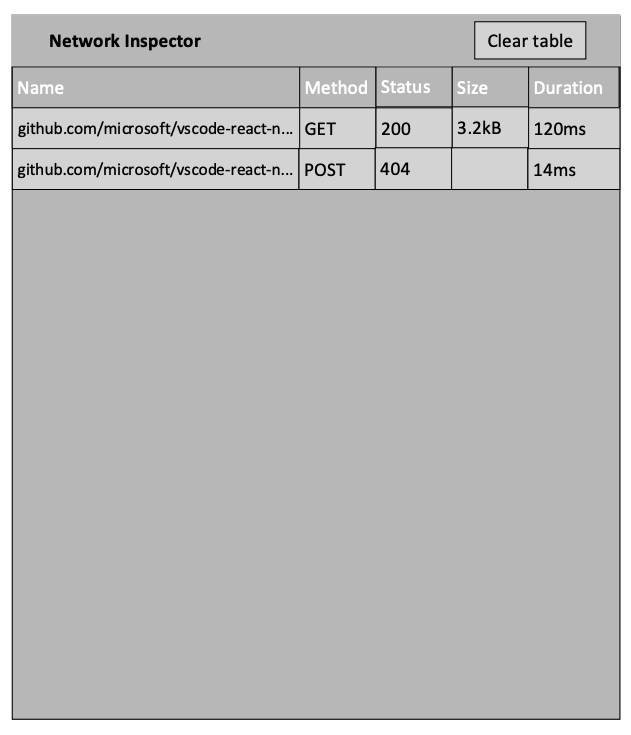
This is a prototype of the main page of the inspector. It contains a list with requests. Requests rows are clickable. If a user click on a row, details data of the request will be shown below the row.
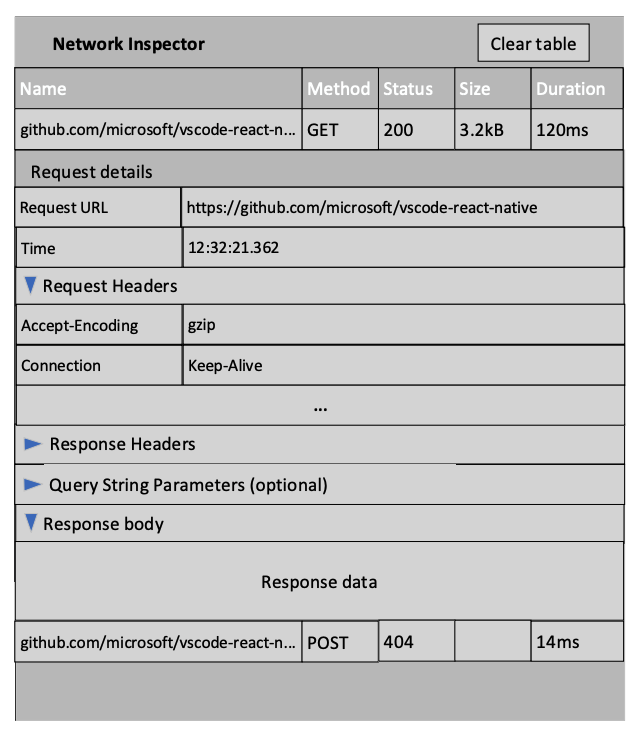
Details data of the request contains general request data, request and response headers, response body and, optionally, query strings parameters. Request header, response headers, response body and query strings parameters are extensible, this allows to show only needed information.
We'd like to discuss which way of displaying network requests data is more preferable to be implemented. Below there is a survey in which you can select the way you consider is the best.
We will be glad to see your feedback about Network inspector UI.
 RedMickey
on 29 Jan 2021
RedMickey
on 29 Jan 2021
I like to be in VSCode Webview.
Just like the developer tools in the Chromium browser, multiple resources are loaded on a page, but there may be only one or two errors (HTTP 40X, 50X)
Gsonovb
on 1 Feb 2021
output channel in VS Code and VS Code DevTools console both looks good and practical
 gorhom
on 1 Feb 2021
gorhom
on 1 Feb 2021
Looks good but Flipper already has this https://fbflipper.com/docs/features/react-native/.
DevTools console looks like a best option as you really only want this when debugging.
 matijagrcic
on 1 Feb 2021
matijagrcic
on 1 Feb 2021
Hi guys and thanks for your feedback.
@matijagrcic, with respect to Flipper Network inspector, the idea of our Network inspector is to work in a tab in VS Code, so It wouldn't be necessary to open Flipper application while debugging a React Native app in VS Code. It could be more convenient to use one development tool for this purpose instead of switching between the two applications.
RedMickey
on 2 Feb 2021
Hi everyone,
in the first version of the Network inspector, we decided to implement displaying of network requests data in VSCode DevTools console, and now we are working on it.
We've implemented a preview version of possible displaying of network requests data in the console. In the screenshots below you can see how it looks now:
Light DevTools console theme
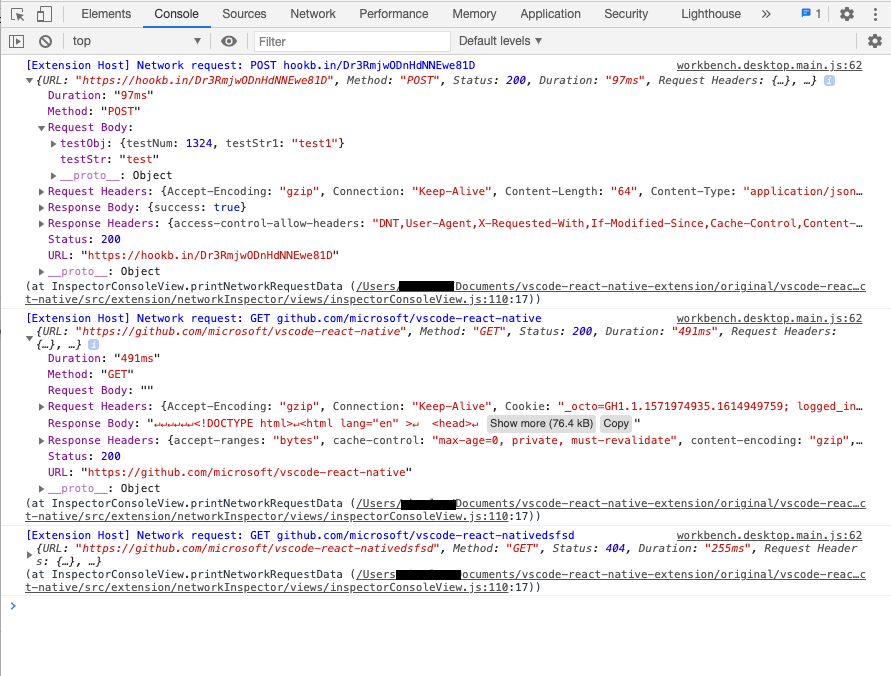
Dark DevTools console theme

We'd like to discuss the current appearance of requests data in the console. It could be that we should make some changes to the data structure or change the logs colors to more appropriate ones. We will be grateful for your advice and suggestions.
CC @EricCornelson, @molant Could you please also look at this?
RedMickey
on 23 Mar 2021
Hi everyone, we have implemented the Network inspector feature. It will be available in the next release.
RedMickey
on 6 May 2021
Related issues
 kralcifer-ms
·
4Comments
kralcifer-ms
·
4Comments
 andreyleonardo
·
3Comments
andreyleonardo
·
3Comments
 Jacky9425
·
4Comments
SounD120
·
4Comments
molant
·
3Comments
Jacky9425
·
4Comments
SounD120
·
4Comments
molant
·
3Comments
Most helpful comment
We have investigated ways to display network requests data in the extension and found out the following three ways to do it:
In output channel in VS Code. In this case, all the messages are printed in their full size. The screenshot below is just a draft, which doesn't contain all the information about the requests.

In VS Code DevTools console. In the console we can open and hide properties, this allows to show information in more readable form. However, in this case our network inspector outputs will mix with some other VS Code messages. Below there is an example of printing raw request data. If this way is chosen to implement displaying of network requests data, we will process that data to show only useful information properly.

In VS Code Webview. We could create a web client for our Network inspector backend and run it inside the VS Code webview. We made up prototypes of UI of our Network inspector. We suppose that the Network inspector page should be opened at the second editor column in VS Code, so users could see the application code and requests data at the same time. Below there are prototypes of UI of the inspector.


This is a prototype of the main page of the inspector. It contains a list with requests. Requests rows are clickable. If a user click on a row, details data of the request will be shown below the row.
Details data of the request contains general request data, request and response headers, response body and, optionally, query strings parameters. Request header, response headers, response body and query strings parameters are extensible, this allows to show only needed information.
We'd like to discuss which way of displaying network requests data is more preferable to be implemented. Below there is a survey in which you can select the way you consider is the best.
We will be glad to see your feedback about Network inspector UI.