Vscode-react-native: Could not debug [Object object]
Actual Behavior
- Install VS Code and react native tools
- Open a project used on another computer
- install react native cli globally
- launch expo manually using expo r
- try to debug
Expected Behavior
- the debugger starts, prints the qr code, after which I connect 2.
Software versions
- React-Native VS Code extension version:
0.14.2 - VSCode version:
Version: 1.41.1 - OS platform and version:
Mac OS Catalina 10.15.3 - NodeJS version:
12 - React Native version:
react-native-cli: 2.0.1
react-native: 0.61.4 - Expo SDK version (include if relevant):
Outputs (Include if relevant)
- Output of the Debug Console (View -> Toggle Debug Console):
OS: darwin x64
Adapter node: v12.4.0 x64
vscode-chrome-debug-core: 6.8.8
Could not debug. [object Object]
- Output of the React-Native output channel (View -> Toggle Output -> Select React-Native in ListBox):
[Info] Making sure your project uses the correct dependencies for Expo. This may take a while...

Checking if this is Expo app......
[Info] Starting Packager

.warn The following packages use deprecated "rnpm" config that will stop working from next release:
  - lottie-react-native: https://github.com/airbnb/lottie-react-native#readme
  - react-native-video: https://npmjs.com/package/react-native-video
Please notify their maintainers about it. You can find more details at https://github.com/react-native-community/cli/blob/master/docs/configuration.md#migration-guide.
┌──────────────────────────────────────────────────────────────────────────────┐
│                                                                              │
│  Running Metro Bundler on port 8081.                                         │
│                                                                              │
│  Keep Metro running while developing on any JS projects. Feel free to        │
│  close this tab and run your own Metro instance if you prefer.               │
│                                                                              │
│  https://github.com/facebook/react-native                                    │
│                                                                              │
└──────────────────────────────────────────────────────────────────────────────┘

Looking for JS files in
   /Users/superandrew/code/tutelart-rn

.[Info] Packager started.

[Info] Prewarming bundle cache. This may take a while ...

[Info] Building and running application.

.Loading dependency graph, done.
...................................
No issue with doctor-config-json-not-readNo issue with doctor-config-json-not-readNo issue with doctor-watchman-versionNo issue with doctor-watchman-versionNo issue with doctor-problem-checking-watchman-versionNo issue with doctor-problem-checking-watchman-versionNo issue with doctor-both-app-and-exp-jsonNo issue with doctor-both-app-and-exp-jsonNo issue with doctor-unversionedNo issue with doctor-unversionedNo issue with doctor-versions-endpoint-failedNo issue with doctor-versions-endpoint-failedNo issue with doctor-invalid-sdk-versionNo issue with doctor-invalid-sdk-versionNo issue with doctor-schema-validationNo issue with doctor-schema-validationNo issue with doctor-validate-asset-fieldsNo issue with doctor-validate-asset-fieldsNo issue with doctor-schema-validation-exceptionNo issue with doctor-schema-validation-exceptionNo issue with doctor-node-modules-missingNo issue with doctor-node-modules-missingNo issue with doctor-react-native-not-installedNo issue with doctor-react-native-not-installed[Error] Error

[Info] Making sure your project uses the correct dependencies for Expo. This may take a while...

Checking if this is Expo app......
[Info] Packager is already running.

[Info] Prewarming bundle cache. This may take a while ...

[Info] Building and running application.

No issue with doctor-config-json-not-readNo issue with doctor-config-json-not-readNo issue with doctor-config-json-not-readNo issue with doctor-watchman-versionNo issue with doctor-watchman-versionNo issue with doctor-watchman-versionNo issue with doctor-problem-checking-watchman-versionNo issue with doctor-problem-checking-watchman-versionNo issue with doctor-problem-checking-watchman-versionNo issue with doctor-both-app-and-exp-jsonNo issue with doctor-both-app-and-exp-jsonNo issue with doctor-both-app-and-exp-jsonNo issue with doctor-unversionedNo issue with doctor-unversionedNo issue with doctor-unversionedNo issue with doctor-versions-endpoint-failedNo issue with doctor-versions-endpoint-failedNo issue with doctor-versions-endpoint-failedNo issue with doctor-invalid-sdk-versionNo issue with doctor-invalid-sdk-versionNo issue with doctor-invalid-sdk-versionNo issue with doctor-schema-validationNo issue with doctor-schema-validationNo issue with doctor-schema-validationNo issue with doctor-validate-asset-fieldsNo issue with doctor-validate-asset-fieldsNo issue with doctor-validate-asset-fieldsNo issue with doctor-schema-validation-exceptionNo issue with doctor-schema-validation-exceptionNo issue with doctor-schema-validation-exceptionNo issue with doctor-node-modules-missingNo issue with doctor-node-modules-missingNo issue with doctor-node-modules-missingNo issue with doctor-react-native-not-installedNo issue with doctor-react-native-not-installedNo issue with doctor-react-native-not-installed[Error] Error
- Output of the Developer Tools console (Help -> Toggle Developer Tools -> Select Console tab):
lifecycle.ts:130 Error: Trying to add a disposable to a DisposableStore that has already been disposed of. The added object will be leaked!
    at l.add (lifecycle.ts:130)
    at D._register (lifecycle.ts:159)
    at D._getOrCreateWorker (editorWorkerServiceImpl.ts:397)
    at D._getProxy (editorWorkerServiceImpl.ts:411)
    at D._withSyncedResources (editorWorkerServiceImpl.ts:426)
    at D.computeLinks (editorWorkerServiceImpl.ts:451)
    at editorWorkerServiceImpl.ts:69
    at async Promise.all (/private/var/folders/gt/m4bh7qbd29jgb4xf3c9wtqs80000gn/T/AppTranslocation/5AF4E4B4-2735-454A-9B08-592206639268/d/Visual%20Studio%20Code.app/Contents/Resources/app/out/vs/code/electron-browser/workbench/index 0)
add @ lifecycle.ts:130
_register @ lifecycle.ts:159
_getOrCreateWorker @ editorWorkerServiceImpl.ts:397
_getProxy @ editorWorkerServiceImpl.ts:411
_withSyncedResources @ editorWorkerServiceImpl.ts:426
computeLinks @ editorWorkerServiceImpl.ts:451
(anonymous) @ editorWorkerServiceImpl.ts:69
Promise.then (async)
provideLinks @ editorWorkerServiceImpl.ts:69
(anonymous) @ getLinks.ts:136
g @ getLinks.ts:135
(anonymous) @ links.ts:205
a @ async.ts:23
beginCompute @ links.ts:205
onModelChanged @ links.ts:177
(anonymous) @ links.ts:161
fire @ event.ts:581
setModel @ codeEditorWidget.ts:430
setInput @ textResourceEditor.ts:74
async function (async)
setInput @ textResourceEditor.ts:58
setInput @ outputPanel.ts:122
doShowChannel @ outputServices.ts:219
onDidPanelOpen @ outputServices.ts:162
(anonymous) @ outputServices.ts:96
fire @ event.ts:583
(anonymous) @ event.ts:56
fire @ event.ts:581
doOpenComposite @ compositePart.ts:154
openComposite @ compositePart.ts:111
openPanel @ panelPart.ts:233
showChannel @ outputServices.ts:130
$reveal @ mainThreadOutputService.ts:82
_doInvokeHandler @ rpcProtocol.ts:398
_invokeHandler @ rpcProtocol.ts:383
_receiveRequest @ rpcProtocol.ts:299
_receiveOneMessage @ rpcProtocol.ts:226
(anonymous) @ rpcProtocol.ts:101
fire @ event.ts:581
fire @ ipc.net.ts:453
_receiveMessage @ ipc.net.ts:733
(anonymous) @ ipc.net.ts:592
fire @ event.ts:581
acceptChunk @ ipc.net.ts:239
(anonymous) @ ipc.net.ts:200
t @ ipc.net.ts:28
emit @ events.js:200
addChunk @ _stream_readable.js:294
readableAddChunk @ _stream_readable.js:275
Readable.push @ _stream_readable.js:210
onStreamRead @ internal/stream_base_commons.js:166
lifecycle.ts:130 Error: Trying to add a disposable to a DisposableStore that has already been disposed of. The added object will be leaked!
    at l.add (lifecycle.ts:130)
    at D._register (lifecycle.ts:159)
    at D._getOrCreateModelManager (editorWorkerServiceImpl.ts:420)
    at editorWorkerServiceImpl.ts:427
add @ lifecycle.ts:130
_register @ lifecycle.ts:159
_getOrCreateModelManager @ editorWorkerServiceImpl.ts:420
(anonymous) @ editorWorkerServiceImpl.ts:427
Promise.then (async)
_withSyncedResources @ editorWorkerServiceImpl.ts:426
computeLinks @ editorWorkerServiceImpl.ts:451
(anonymous) @ editorWorkerServiceImpl.ts:69
Promise.then (async)
provideLinks @ editorWorkerServiceImpl.ts:69
(anonymous) @ getLinks.ts:136
g @ getLinks.ts:135
(anonymous) @ links.ts:205
a @ async.ts:23
beginCompute @ links.ts:205
onModelChanged @ links.ts:177
(anonymous) @ links.ts:161
fire @ event.ts:581
setModel @ codeEditorWidget.ts:430
setInput @ textResourceEditor.ts:74
async function (async)
setInput @ textResourceEditor.ts:58
setInput @ outputPanel.ts:122
doShowChannel @ outputServices.ts:219
onDidPanelOpen @ outputServices.ts:162
(anonymous) @ outputServices.ts:96
fire @ event.ts:583
(anonymous) @ event.ts:56
fire @ event.ts:581
doOpenComposite @ compositePart.ts:154
openComposite @ compositePart.ts:111
openPanel @ panelPart.ts:233
showChannel @ outputServices.ts:130
$reveal @ mainThreadOutputService.ts:82
_doInvokeHandler @ rpcProtocol.ts:398
_invokeHandler @ rpcProtocol.ts:383
_receiveRequest @ rpcProtocol.ts:299
_receiveOneMessage @ rpcProtocol.ts:226
(anonymous) @ rpcProtocol.ts:101
fire @ event.ts:581
fire @ ipc.net.ts:453
_receiveMessage @ ipc.net.ts:733
(anonymous) @ ipc.net.ts:592
fire @ event.ts:581
acceptChunk @ ipc.net.ts:239
(anonymous) @ ipc.net.ts:200
t @ ipc.net.ts:28
emit @ events.js:200
addChunk @ _stream_readable.js:294
readableAddChunk @ _stream_readable.js:275
Readable.push @ _stream_readable.js:210
onStreamRead @ internal/stream_base_commons.js:166
2console.ts:137 [Extension Host] (node:5006) [DEP0005] DeprecationWarning: Buffer() is deprecated due to security and usability issues. Please use the Buffer.alloc(), Buffer.allocUnsafe(), or Buffer.from() methods instead.
t.log @ console.ts:137
$logExtensionHostMessage @ mainThreadConsole.ts:39
_doInvokeHandler @ rpcProtocol.ts:398
_invokeHandler @ rpcProtocol.ts:383
_receiveRequest @ rpcProtocol.ts:299
_receiveOneMessage @ rpcProtocol.ts:226
(anonymous) @ rpcProtocol.ts:101
fire @ event.ts:581
fire @ ipc.net.ts:453
_receiveMessage @ ipc.net.ts:733
(anonymous) @ ipc.net.ts:592
fire @ event.ts:581
acceptChunk @ ipc.net.ts:239
(anonymous) @ ipc.net.ts:200
t @ ipc.net.ts:28
emit @ events.js:200
addChunk @ _stream_readable.js:294
readableAddChunk @ _stream_readable.js:275
Readable.push @ _stream_readable.js:210
onStreamRead @ internal/stream_base_commons.js:166
Tried multiple restarts and whatsoever but I have no clues. Ideas?
 superandrew
All 77 comments
I should add that the "attach to packager" debugger works, it is just the "debug with exponent" that gives this unclear error.
superandrew
on 23 Mar 2020
Hi @superandrew and thanks for reaching us. It seems that you had started an expo app manually and then tried to start the same app again using the extension's debugging scenario. It isn't required to start an expo app manually, if you are using Debug in Exponent scenario. Please follow the expo debugging documentation to debug expo applications.
 RedMickey
on 23 Mar 2020
RedMickey
on 23 Mar 2020
Hi, @RedMickey thank you, I actually know that and I usually start with Debug in exponent. The problem is, and the reason why I reported this issue, is that on a new computer, following the documentation, I have this weird Could not debug [Object object] error.
superandrew
on 23 Mar 2020
oh, and if it useful, the step which doesn't work, is step 5
https://github.com/microsoft/vscode-react-native/blob/master/doc/expo.md#debugging-expo-applications
I see no QR code as it happens when it works.
superandrew
on 23 Mar 2020
Hi @superandrew . Which platform (iOS or Android, emulator/simulator or a device) did you try to debug, also did you use expoHostType debug scenario argument? I tried to run through the repro steps that you described on a freshly created app and faced no problems. Have you tried to run Expo debugging on a freshly created app, does this behavior reproduce there? Also, I am not sure that running expo r and Debug in Exponent debug scenario simultaneously is a good idea. That can lead to errors because both of these options run ngrok tunnel and in this case there could be conflicts.
 SounD120
on 23 Mar 2020
SounD120
on 23 Mar 2020
Hi @SounD120 sorry I didn't explain well. On step 4 I didn't mean that I launch expo manually while debugging. Instead I was saying that I checked that expo is working correctly.
Now, I tried a new app with expo init and then add the Debug in Exponent configuration, but I have this error:
```OS: darwin x64
Adapter node: v12.4.0 x64
vscode-chrome-debug-core: 6.8.8
Could not debug. Couldn't find react-native package in node_modules. Please, run "npm install" inside your project to install it. (error code 606)
when I do I have this error (very weird but I assume it is not relevant, anyway)
git:(master) ✗ npm install react-native
npm ERR! code E401
npm ERR! 401 UNAUTHORIZED - GET https://github.com/expo/react-native/archive/sdk-36.0.0.tar.gz
```
I always debugged in this vs code workspace, and also other members of my team normally debug in this workspace in vs code.
This is a new computer (coronavirus setup :D ) so it might be some missing system level package?
Those console errors mean anything to you? I'm puzzled. Oh and last question. Is by any chance Java needed on the machine?
superandrew
on 24 Mar 2020
I was just able to test a new generated app:
OS: darwin x64
Adapter node: v12.4.0 x64
vscode-chrome-debug-core: 6.8.8
Could not debug. [object Object]
Node version maybe? anything useful I could take a look at?
superandrew
on 24 Mar 2020
This happens exactly when the Could not debug. [object Object] error prints. Here and on the other project

superandrew
on 24 Mar 2020
@superandrew The error:
npm ERR! 401 UNAUTHORIZED - GET https://github.com/expo/react-native/archive/sdk-36.0.0.tar.gz
may be connected with always-auth option in npmrc file, this is possible if npm has been connected to a private registry. And this can be the reason of this behavior, because npm cannot install the required packages, and this causes errors inside the extension. Could you please check if npm is configured correctly, reinstall the packages and let us know if this helped?
SounD120
on 24 Mar 2020
@SounD120 good catch. I hadn't a .npmrc file. I copied it from the other computer (//registry.npmjs.org/:_authToken=<a token>, and now it seems I have no residual problems on npm. I tried uninstalling react-native-tools, reloading, and reinstlling it again.
Same problem, that starts way before the packaging has finished loading. It prints:
OS: darwin x64
Adapter node: v12.4.0 x64
vscode-chrome-debug-core: 6.8.8
and, after a few seconds,
Could not debug. [object Object]
superandrew
on 24 Mar 2020
Is there a way to "reset" react native tools, so that it asks again for expo credentials etc?
superandrew
on 24 Mar 2020
@superandrew Actually there is no way to "reset" the extension. But you can do something like that with expo-cli. You can call expo logout command to logout from Expo, after that extension will ask you for credentials like you run it for the first time. Also in this case it could be useful to reinstall the extension:
- remove the extension
- exit VS Code via
Quitbutton in the dock - open VS Code
- install the extension again
This will initiate reinstallation of @expo/xdl package on the extension side, also it can be useful to reinstall expo-cli using the following commands:
npm uninstall -g expo-cli
npm install -g expo-cli
After that you can try to run Debug in Exponent debug scenario on your app. Could you please try the instruction above and let us know if it worked for you?
SounD120
on 25 Mar 2020
Thanks @SounD120 . I tried all your steps. Unfortunately I didn't seem to find any improvement. One thing I noticed is that the error pops out even if expo cli is not installed. But if it is installed, and logget out, it asks for user and password, and then, after a while, the error pops.
Also, to be noticed, the error pops out exactly when in console this error pops:
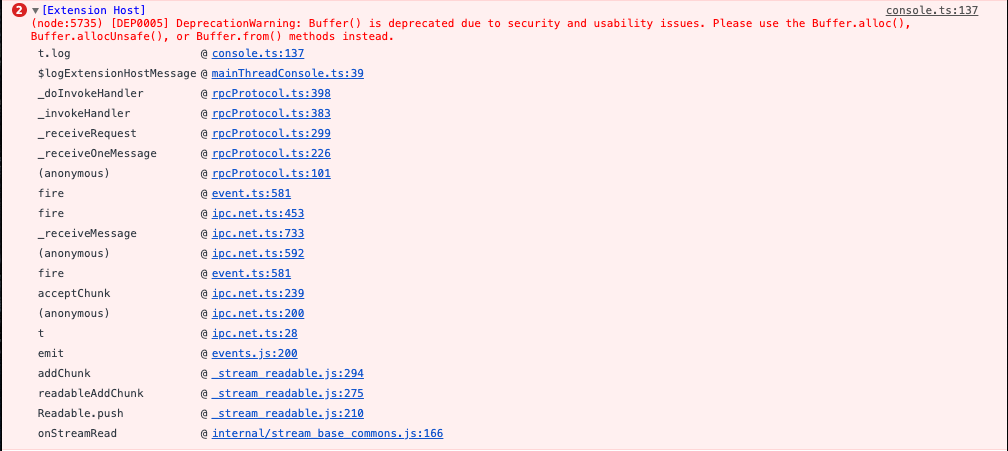
[Extension Host]
(node:5735) [DEP0005] DeprecationWarning: Buffer() is deprecated due to security and usability issues. Please use the Buffer.alloc(), Buffer.allocUnsafe(), or Buffer.from() methods instead.
t.log @ console.ts:137
$logExtensionHostMessage @ mainThreadConsole.ts:39
_doInvokeHandler @ rpcProtocol.ts:398
_invokeHandler @ rpcProtocol.ts:383
_receiveRequest @ rpcProtocol.ts:299
_receiveOneMessage @ rpcProtocol.ts:226
(anonymous) @ rpcProtocol.ts:101
fire @ event.ts:581
fire @ ipc.net.ts:453
_receiveMessage @ ipc.net.ts:733
(anonymous) @ ipc.net.ts:592
fire @ event.ts:581
acceptChunk @ ipc.net.ts:239
(anonymous) @ ipc.net.ts:200
t @ ipc.net.ts:28
emit @ events.js:200
addChunk @ _stream_readable.js:294
readableAddChunk @ _stream_readable.js:275
Readable.push @ _stream_readable.js:210
onStreamRead @ internal/stream_base_commons.js:166
superandrew
on 26 Mar 2020
tried a full vs code reinstall.. I guess it is a machine condition, some missing package, any help on how to debug this would be helpful. I remind you that the "attach to packager" works as expected, and debugs.
superandrew
on 26 Mar 2020
@superandrew It could be useful to enable the following options:
- Add
"trace": "verbose"to yourDebug in Exponentdebug configuration. This will enable extended logging for debugger process (Debug Console). - Create
.vscode/settings.json(near withlaunch.json) file and add these lines to it:
{
    "react-native-tools.logLevel": "Trace"
}
This will enable extended debug logs for the extension(React Native output channel, React Native: Run exponent channel).
Could you please try to enable extended logging and send us outputs of Debug in Exponent scenario in verbose logging mode?
SounD120
on 26 Mar 2020
sure!
OS: darwin x64
Adapter node: v12.8.1 x64
vscode-chrome-debug-core: 6.8.8
From client: initialize({"clientID":"vscode","clientName":"Visual Studio Code","adapterID":"reactnative","pathFormat":"path","linesStartAt1":true,"columnsStartAt1":true,"supportsVariableType":true,"supportsVariablePaging":true,"supportsRunInTerminalRequest":true,"locale":"en-gb"})
To client: {"seq":0,"type":"response","request_seq":1,"command":"initialize","success":true,"body":{"exceptionBreakpointFilters":[{"label":"All Exceptions","filter":"all","default":false},{"label":"Uncaught Exceptions","filter":"uncaught","default":false}],"supportsConfigurationDoneRequest":true,"supportsSetVariable":true,"supportsConditionalBreakpoints":true,"supportsCompletionsRequest":true,"supportsHitConditionalBreakpoints":true,"supportsRestartFrame":true,"supportsExceptionInfoRequest":true,"supportsDelayedStackTraceLoading":true,"supportsValueFormattingOptions":true,"supportsEvaluateForHovers":true,"supportsLoadedSourcesRequest":true,"supportsBreakpointLocationsRequest":false,"supportsLogPoints":true,"supportsTerminateRequest":true}}
/Users/superandrew/code/tutelart-rn/.vscode/settings.json file doesn't exist or its content is incorrect. This file will be ignored.
Handle launch request: {
  "name": "Debug in Exponent",
  "cwd": "/Users/superandrew/code/tutelart-rn",
  "type": "reactnative",
  "request": "launch",
  "platform": "exponent",
  "trace": "verbose",
  "__sessionId": "f47cf3f4-fa08-467a-925e-3bad4f1f1a5c",
  "sourceMaps": true
}
Could not debug. [object Object]
To client: {"seq":0,"type":"event","event":"terminated"}
From client: disconnect({"restart":false})
To client: {"seq":0,"type":"event","event":"output","body":{"category":"telemetry","output":"FullSessionStatistics/SourceMaps/Overrides","data":{"aspNetClientAppFallbackCount":0}}}
To client: {"seq":0,"type":"response","request_seq":3,"command":"disconnect","success":true}
To client: {"seq":0,"type":"event","event":"output","body":{"category":"telemetry","output":"debugStopped","data":{"reason":"Got disconnect request"}}}
@superandrew Thanks. React Native and React Native: Run exponent channels logs will be useful too.
This error means that something went wrong with processing your settings.json file, make sure that there is no such error to be sure that extended logging has been enabled for the extension:
/Users/superandrew/code/tutelart-rn/.vscode/settings.json file doesn't exist or its content is incorrect. This file will be ignored.
Reload VS Code just before running the debug scenario with verbose logs.
SounD120
on 26 Mar 2020

it seems there is an error on the format, but the file is definitely there.
superandrew
on 26 Mar 2020
@superandrew It seems that the error message that is rendered should be corrected for that case, because that message is about react-native-tools.projectRoot setting only. Please check if you have [Debug] messages in your output logs. If it so, then logging works as expected.
SounD120
on 26 Mar 2020
I'm really sorry, but I didn't understand what you are suggesting.
superandrew
on 26 Mar 2020
I tried adding the projectRoot settings, but it seems that "Trace" isn't an expected value, it expects an enum.
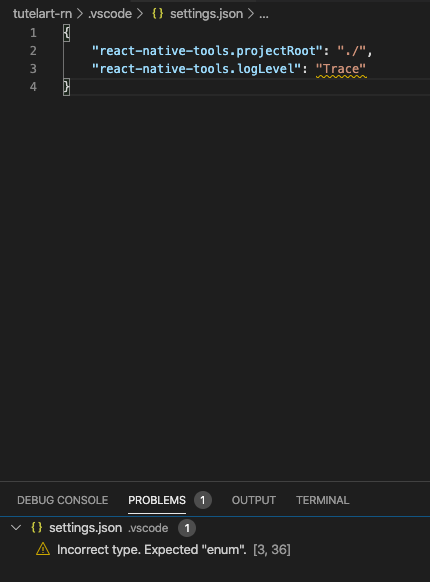
superandrew
on 26 Mar 2020
however, it works
OS: darwin x64
Adapter node: v12.8.1 x64
vscode-chrome-debug-core: 6.8.8
From client: initialize({"clientID":"vscode","clientName":"Visual Studio Code","adapterID":"reactnative","pathFormat":"path","linesStartAt1":true,"columnsStartAt1":true,"supportsVariableType":true,"supportsVariablePaging":true,"supportsRunInTerminalRequest":true,"locale":"en-gb"})
To client: {"seq":0,"type":"response","request_seq":1,"command":"initialize","success":true,"body":{"exceptionBreakpointFilters":[{"label":"All Exceptions","filter":"all","default":false},{"label":"Uncaught Exceptions","filter":"uncaught","default":false}],"supportsConfigurationDoneRequest":true,"supportsSetVariable":true,"supportsConditionalBreakpoints":true,"supportsCompletionsRequest":true,"supportsHitConditionalBreakpoints":true,"supportsRestartFrame":true,"supportsExceptionInfoRequest":true,"supportsDelayedStackTraceLoading":true,"supportsValueFormattingOptions":true,"supportsEvaluateForHovers":true,"supportsLoadedSourcesRequest":true,"supportsBreakpointLocationsRequest":false,"supportsLogPoints":true,"supportsTerminateRequest":true}}
Handle launch request: {
  "name": "Debug in Exponent",
  "cwd": "/Users/superandrew/code/tutelart-rn",
  "type": "reactnative",
  "request": "launch",
  "platform": "exponent",
  "trace": "verbose",
  "__sessionId": "7d1b0773-e56b-4ab4-8e40-fc36172a6f65",
  "sourceMaps": true
}
Could not debug. [object Object]
To client: {"seq":0,"type":"event","event":"terminated"}
From client: disconnect({"restart":false})
To client: {"seq":0,"type":"event","event":"output","body":{"category":"telemetry","output":"FullSessionStatistics/SourceMaps/Overrides","data":{"aspNetClientAppFallbackCount":0}}}
To client: {"seq":0,"type":"response","request_seq":3,"command":"disconnect","success":true}
To client: {"seq":0,"type":"event","event":"output","body":{"category":"telemetry","output":"debugStopped","data":{"reason":"Got disconnect request"}}}
but I have no other useful info
superandrew
on 26 Mar 2020
@superandrew Sorry, maybe I wasn't enough clear to you. I am asking to send us outputs from the output channels React Native and React Native: Run exponent. You can find them using these steps in VS Code UI: Toggle View -> Toggle Output -> Select React Native and React Native: Run exponent in ListBox.
SounD120
on 26 Mar 2020
ok, now I got it.
React native: Run Exponent
[Info] Starting React Native Packager.

[Info] Attaching to running React Native packager
React native:
[Info] Making sure your project uses the correct dependencies for Expo. This may take a while...

Checking if this is Expo app......
[Info] Starting Packager

warn The following packages use deprecated "rnpm" config that will stop working from next release:
  - lottie-react-native: https://github.com/airbnb/lottie-react-native#readme
  - react-native-video: https://npmjs.com/package/react-native-video
Please notify their maintainers about it. You can find more details at https://github.com/react-native-community/cli/blob/master/docs/configuration.md#migration-guide.
┌──────────────────────────────────────────────────────────────────────────────┐
│                                                                              │
│  Running Metro Bundler on port 8081.                                         │
│                                                                              │
│  Keep Metro running while developing on any JS projects. Feel free to        │
│  close this tab and run your own Metro instance if you prefer.               │
│                                                                              │
│  https://github.com/facebook/react-native                                    │
│                                                                              │
└──────────────────────────────────────────────────────────────────────────────┘

Looking for JS files in
   /Users/superandrew/code/tutelart-rn

[Info] Packager started.

[Info] Prewarming bundle cache. This may take a while ...

[Info] Building and running application.

No issue with doctor-config-json-not-readNo issue with doctor-config-json-not-readNo issue with doctor-watchman-versionNo issue with doctor-watchman-versionNo issue with doctor-problem-checking-watchman-versionNo issue with doctor-problem-checking-watchman-versionNo issue with doctor-both-app-and-exp-jsonNo issue with doctor-both-app-and-exp-jsonNo issue with doctor-unversionedNo issue with doctor-unversionedNo issue with doctor-versions-endpoint-failedNo issue with doctor-versions-endpoint-failedNo issue with doctor-invalid-sdk-versionNo issue with doctor-invalid-sdk-versionNo issue with doctor-schema-validationNo issue with doctor-schema-validationNo issue with doctor-validate-asset-fieldsNo issue with doctor-validate-asset-fieldsNo issue with doctor-schema-validation-exceptionNo issue with doctor-schema-validation-exceptionNo issue with doctor-node-modules-missingNo issue with doctor-node-modules-missingNo issue with doctor-react-native-not-installedNo issue with doctor-react-native-not-installed[Error] Error

Loading dependency graph, done.
[Info] Making sure your project uses the correct dependencies for Expo. This may take a while...

Checking if this is Expo app......
[Info] Packager is already running.

[Info] Prewarming bundle cache. This may take a while ...

[Info] Building and running application.

No issue with doctor-config-json-not-readNo issue with doctor-config-json-not-readNo issue with doctor-config-json-not-readNo issue with doctor-watchman-versionNo issue with doctor-watchman-versionNo issue with doctor-watchman-versionNo issue with doctor-problem-checking-watchman-versionNo issue with doctor-problem-checking-watchman-versionNo issue with doctor-problem-checking-watchman-versionNo issue with doctor-both-app-and-exp-jsonNo issue with doctor-both-app-and-exp-jsonNo issue with doctor-both-app-and-exp-jsonNo issue with doctor-unversionedNo issue with doctor-unversionedNo issue with doctor-unversionedNo issue with doctor-versions-endpoint-failedNo issue with doctor-versions-endpoint-failedNo issue with doctor-versions-endpoint-failedNo issue with doctor-invalid-sdk-versionNo issue with doctor-invalid-sdk-versionNo issue with doctor-invalid-sdk-versionNo issue with doctor-schema-validationNo issue with doctor-schema-validationNo issue with doctor-schema-validationNo issue with doctor-validate-asset-fieldsNo issue with doctor-validate-asset-fieldsNo issue with doctor-validate-asset-fieldsNo issue with doctor-schema-validation-exceptionNo issue with doctor-schema-validation-exceptionNo issue with doctor-schema-validation-exceptionNo issue with doctor-node-modules-missingNo issue with doctor-node-modules-missingNo issue with doctor-node-modules-missingNo issue with doctor-react-native-not-installedNo issue with doctor-react-native-not-installedNo issue with doctor-react-native-not-installed[Error] Error
Hope it helps
superandrew
on 26 Mar 2020
@SounD120 is there anything else useful I could provide you, or tests I could run?
superandrew
on 27 Mar 2020
@superandrew I think one thing can help. It seems that something wrong runs out through the logging output and that's why the only thing we can see is [object Object]. I think it can be useful to see what's the object it is, you can find the exact place in the extension code and add JSON.stringify function for the this output. To do this you can do the following:
- Open the
~/.vscode/extensions/msjsdiag.vscode-react-native-0.14.2/src/debugger/nodeDebugWrapper.jsfile in the installed React Native Tools extension - Find the
bailOut function(it should be on line 218) and wrap message variable in it withJSON.stringifylike this:
vscode_chrome_debug_core_1.logger.error(localize(4, null, JSON.stringify(message, null, 2)));
- Reload VS Code
With this fix all the JS objects that goes through the logger should be translated into JSON strings so they should be printable. Could you please try to do this and send us and outputs with this fix?
SounD120
on 27 Mar 2020
thanks.
here's the output. Not what I expected. An empty object. Maybe I could do this a little higher in the stack?
OS: darwin x64
Adapter node: v12.8.1 x64
vscode-chrome-debug-core: 6.8.8
From client: initialize({"clientID":"vscode","clientName":"Visual Studio Code","adapterID":"reactnative","pathFormat":"path","linesStartAt1":true,"columnsStartAt1":true,"supportsVariableType":true,"supportsVariablePaging":true,"supportsRunInTerminalRequest":true,"locale":"en-gb"})
To client: {"seq":0,"type":"response","request_seq":1,"command":"initialize","success":true,"body":{"exceptionBreakpointFilters":[{"label":"All Exceptions","filter":"all","default":false},{"label":"Uncaught Exceptions","filter":"uncaught","default":false}],"supportsConfigurationDoneRequest":true,"supportsSetVariable":true,"supportsConditionalBreakpoints":true,"supportsCompletionsRequest":true,"supportsHitConditionalBreakpoints":true,"supportsRestartFrame":true,"supportsExceptionInfoRequest":true,"supportsDelayedStackTraceLoading":true,"supportsValueFormattingOptions":true,"supportsEvaluateForHovers":true,"supportsLoadedSourcesRequest":true,"supportsBreakpointLocationsRequest":false,"supportsLogPoints":true,"supportsTerminateRequest":true}}
Handle launch request: {
  "name": "Debug in Exponent",
  "cwd": "/Users/superandrew/code/tutelart-rn",
  "type": "reactnative",
  "request": "launch",
  "platform": "exponent",
  "trace": "verbose",
  "__sessionId": "215ec8e4-963c-4e03-bec4-9ce76d3e6138",
  "sourceMaps": true
}
Could not debug. {}
To client: {"seq":0,"type":"event","event":"terminated"}
From client: disconnect({"restart":false})
To client: {"seq":0,"type":"event","event":"output","body":{"category":"telemetry","output":"FullSessionStatistics/SourceMaps/Overrides","data":{"aspNetClientAppFallbackCount":0}}}
To client: {"seq":0,"type":"response","request_seq":3,"command":"disconnect","success":true}
To client: {"seq":0,"type":"event","event":"output","body":{"category":"telemetry","output":"debugStopped","data":{"reason":"Got disconnect request"}}}
@superandrew It is definitely makes sense to try to place it higher in the stack. For example here. We can also try to print error object
SounD120
on 27 Mar 2020
I am absolutely lost on why with this:
 .catch(error => {return this.bailOut({"error":"my error"})});
                });
            });
        }
        /**
         * Logs error to user and finishes the debugging process.
         */
        bailOut(message) {
            vscode_chrome_debug_core_1.logger.error(localize(4, null, JSON.stringify(message)));
            this.sendEvent(new vscode_debugadapter_1.TerminatedEvent());
        }
it still prints {} after reloading. I am sure the file is being modified because if there are errors I get a timeout. Where can I just print something'? tried console.log but to no avail.
superandrew
on 27 Mar 2020
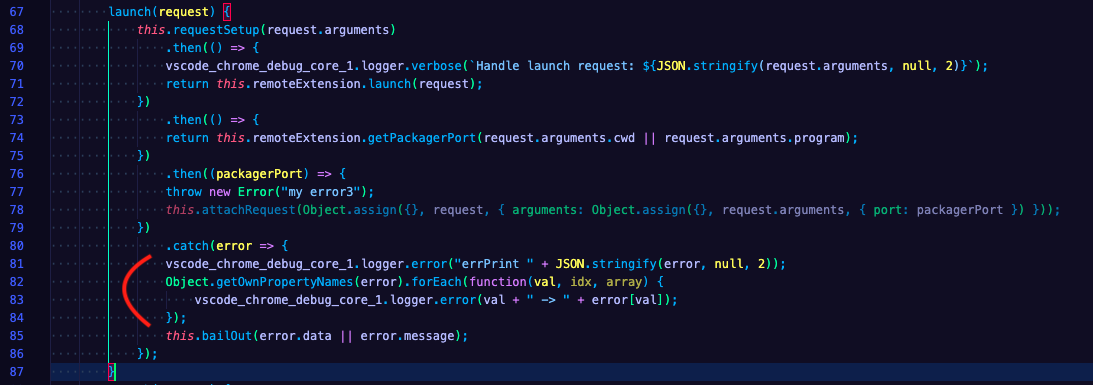
@superandrew, in this case, unfortunately, the best way to found out the problem is debugging. Could you please add the code below here and here?
vscode_chrome_debug_core_1.logger.error("errPrint " + JSON.stringify(error, null, 2));
Object.getOwnPropertyNames(error).forEach(function(val, idx, array) {
     vscode_chrome_debug_core_1.logger.error(val + " -> " + error[val]);
});
After adding of the code above, you should get something like this:
Also, please, add the following code here:
vscode_chrome_debug_core_1.logger.error("errPrint " + JSON.stringify(message, null, 2));
Object.getOwnPropertyNames(message).forEach(function(val, idx, array) {
    vscode_chrome_debug_core_1.logger.error(val + " -> " + message[val]);
 });
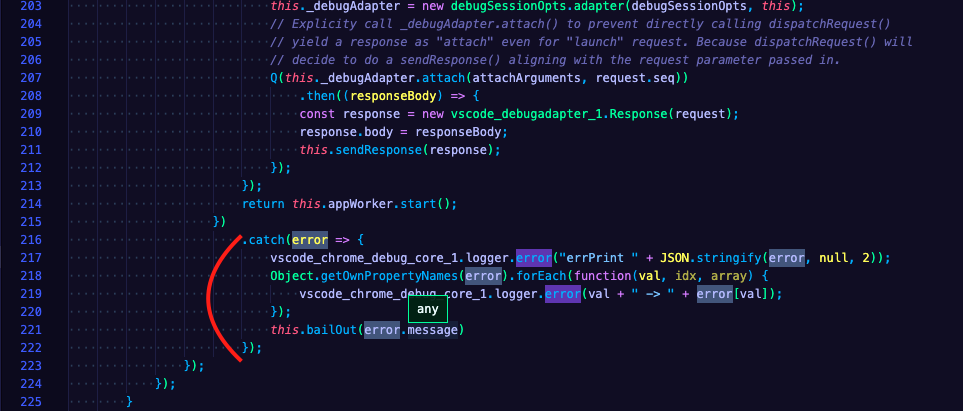
After the change bailOut function should look something like this:
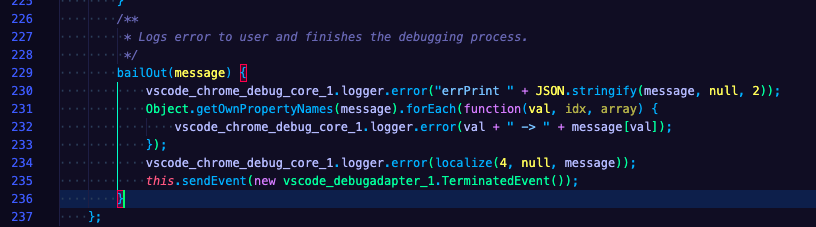
Could you please do these changes, run Expo debugging again and send us outputs from the output channel React Native?
RedMickey
on 30 Mar 2020
Here's the output. Unfortunately there is something system level and this output doesn't seem to provide much more info.
OS: darwin x64
Adapter node: v12.8.1 x64
vscode-chrome-debug-core: 6.8.8
From client: initialize({"clientID":"vscode","clientName":"Visual Studio Code","adapterID":"reactnative","pathFormat":"path","linesStartAt1":true,"columnsStartAt1":true,"supportsVariableType":true,"supportsVariablePaging":true,"supportsRunInTerminalRequest":true,"locale":"en-gb"})
To client: {"seq":0,"type":"response","request_seq":1,"command":"initialize","success":true,"body":{"exceptionBreakpointFilters":[{"label":"All Exceptions","filter":"all","default":false},{"label":"Uncaught Exceptions","filter":"uncaught","default":false}],"supportsConfigurationDoneRequest":true,"supportsSetVariable":true,"supportsConditionalBreakpoints":true,"supportsCompletionsRequest":true,"supportsHitConditionalBreakpoints":true,"supportsRestartFrame":true,"supportsExceptionInfoRequest":true,"supportsDelayedStackTraceLoading":true,"supportsValueFormattingOptions":true,"supportsEvaluateForHovers":true,"supportsLoadedSourcesRequest":true,"supportsBreakpointLocationsRequest":false,"supportsLogPoints":true,"supportsTerminateRequest":true}}
Handle launch request: {
  "name": "Debug in Exponent",
  "cwd": "/Users/superandrew/code/tutelart-rn",
  "type": "reactnative",
  "request": "launch",
  "platform": "exponent",
  "trace": "verbose",
  "__sessionId": "8ac4e15d-1868-4e6e-b95c-6a7e7e1957f3",
  "sourceMaps": true
}
errPrint {
  "_code": -32603,
  "_data": {}
}
stack -> Error: InternalError: Internal Error when calling 'Extension.launch'
    at Client.processMessage (/Users/superandrew/.vscode/extensions/msjsdiag.vscode-react-native-0.14.2/node_modules/noice-json-rpc/lib/noice-json-rpc.js:66:36)
    at WebSocket.<anonymous> (/Users/superandrew/.vscode/extensions/msjsdiag.vscode-react-native-0.14.2/node_modules/noice-json-rpc/lib/noice-json-rpc.js:42:48)
    at WebSocket.emit (events.js:203:13)
    at Receiver._receiver.onmessage (/Users/superandrew/.vscode/extensions/msjsdiag.vscode-react-native-0.14.2/node_modules/ws/lib/WebSocket.js:141:47)
    at Receiver.dataMessage (/Users/superandrew/.vscode/extensions/msjsdiag.vscode-react-native-0.14.2/node_modules/ws/lib/Receiver.js:389:14)
    at Receiver.getData (/Users/superandrew/.vscode/extensions/msjsdiag.vscode-react-native-0.14.2/node_modules/ws/lib/Receiver.js:330:12)
    at Receiver.startLoop (/Users/superandrew/.vscode/extensions/msjsdiag.vscode-react-native-0.14.2/node_modules/ws/lib/Receiver.js:165:16)
    at Receiver.add (/Users/superandrew/.vscode/extensions/msjsdiag.vscode-react-native-0.14.2/node_modules/ws/lib/Receiver.js:139:10)
    at Socket.<anonymous> (/Users/superandrew/.vscode/extensions/msjsdiag.vscode-react-native-0.14.2/node_modules/ws/lib/WebSocket.js:138:22)
    at Socket.emit (events.js:203:13)
message -> InternalError: Internal Error when calling 'Extension.launch'
_code -> -32603
_data -> [object Object]
Could not debug. {}
errPrint {}
To client: {"seq":0,"type":"event","event":"terminated"}
From client: disconnect({"restart":false})
To client: {"seq":0,"type":"event","event":"output","body":{"category":"telemetry","output":"FullSessionStatistics/SourceMaps/Overrides","data":{"aspNetClientAppFallbackCount":0}}}
To client: {"seq":0,"type":"response","request_seq":3,"command":"disconnect","success":true}
To client: {"seq":0,"type":"event","event":"output","body":{"category":"telemetry","output":"debugStopped","data":{"reason":"Got disconnect request"}}}
I must add, in case you didnt' notice it before, that "attach to packager" works
OS: darwin x64
Adapter node: v12.8.1 x64
vscode-chrome-debug-core: 6.8.8
Starting debugger app worker.
Established a connection with the Proxy (Packager) to the React Native application
@superandrew Could you please also try to disable or uninstall all the extensions except React Native Tools and try to run debugging? Maybe something from your environment is conflicting with the React Native debugger launch sequence?
SounD120
on 30 Mar 2020
I have no other extensions. It is a clean mac. I just installed JRE just to be sure but I hardly have conflicting things, more likely some missing dependency.
Don't mean to insist but this error pops in console exactly at the same time with the error of could not debug.
[Extension Host] (node:6485) [DEP0005] DeprecationWarning: Buffer() is deprecated due to security and usability issues. Please use the Buffer.alloc(), Buffer.allocUnsafe(), or Buffer.from() methods instead.
This could be not related to the error, but showing this error causes another exception maybe? I am using nvm with default node version 16.8, is that ok? Should I change something at VS Code level?
superandrew
on 30 Mar 2020
Does this help?
ERR No application in the Launch Services database matches the input criteria.: Error: No application in the Launch Services database matches the input criteria.
superandrew
on 31 Mar 2020
@superandrew, this case is fairly uncommon and we haven't faced such a problem yet. Unfortunately, it could take a bit more time to solve this issue, because it's really hard to reproduce this problem on our side.
The thrown error is connected to RPC connection, that is used to provide communication between extension and debugger sides of React Native Tools. For some reason Extension.launch request isn't processed correctly, I suppose that you'll get the same error if you try to debug a plain React Native project without Expo.
It can be that the problem is in usage of nvm. Could you please try to remove it and install common Node.js v12.16.1? Could you please also update VS Code to the latest version?
After that try to debug plain RN app and Expo app:
- Create plain RN app
npx react-native init AwesomeProject - Launch debug scenario
Debug AndroidorDebug iOS
If a plain RN application is debugged without problems, then try to debug new Expo application:
- Create an Expo application
expo init my-new-project - Launch debug scenario
Debug in Exponent
Please let us know about your results.
RedMickey
on 31 Mar 2020
Ok, the first part of the experiment was installing plain node (13 something) and the first thing that puzzled me was:
why? Adapter node: *v12.8.1* x64 -> how can I change that? there is no nvm installed nor node 12.8.1 to my knowledge
OS: darwin x64
Adapter node: v12.8.1 x64
vscode-chrome-debug-core: 6.8.8
errPrint {
  "_code": -32603,
  "_data": "Error while executing command '/Users/superandrew/Desktop/dc/AwesomeProject/node_modules/.bin/react-native run-ios --simulator --no-packager --verbose': Error while executing command '/Users/superandrew/Desktop/dc/AwesomeProject/node_modules/.bin/react-native run-ios --simulator --no-packager --verbose' (error code 101)"
}
stack -> Error: InternalError: Internal Error when calling 'Extension.launch'
    at Client.processMessage (/Users/superandrew/.vscode/extensions/msjsdiag.vscode-react-native-0.14.2/node_modules/noice-json-rpc/lib/noice-json-rpc.js:66:36)
    at WebSocket.<anonymous> (/Users/superandrew/.vscode/extensions/msjsdiag.vscode-react-native-0.14.2/node_modules/noice-json-rpc/lib/noice-json-rpc.js:42:48)
    at WebSocket.emit (events.js:203:13)
    at Receiver._receiver.onmessage (/Users/superandrew/.vscode/extensions/msjsdiag.vscode-react-native-0.14.2/node_modules/ws/lib/WebSocket.js:141:47)
    at Receiver.dataMessage (/Users/superandrew/.vscode/extensions/msjsdiag.vscode-react-native-0.14.2/node_modules/ws/lib/Receiver.js:389:14)
    at Receiver.getData (/Users/superandrew/.vscode/extensions/msjsdiag.vscode-react-native-0.14.2/node_modules/ws/lib/Receiver.js:330:12)
    at Receiver.startLoop (/Users/superandrew/.vscode/extensions/msjsdiag.vscode-react-native-0.14.2/node_modules/ws/lib/Receiver.js:165:16)
    at Receiver.add (/Users/superandrew/.vscode/extensions/msjsdiag.vscode-react-native-0.14.2/node_modules/ws/lib/Receiver.js:139:10)
    at Socket.<anonymous> (/Users/superandrew/.vscode/extensions/msjsdiag.vscode-react-native-0.14.2/node_modules/ws/lib/WebSocket.js:138:22)
    at Socket.emit (events.js:203:13)
message -> InternalError: Internal Error when calling 'Extension.launch'
_code -> -32603
_data -> Error while executing command '/Users/superandrew/Desktop/dc/AwesomeProject/node_modules/.bin/react-native run-ios --simulator --no-packager --verbose': Error while executing command '/Users/superandrew/Desktop/dc/AwesomeProject/node_modules/.bin/react-native run-ios --simulator --no-packager --verbose' (error code 101)
Could not debug. "Error while executing command '/Users/superandrew/Desktop/dc/AwesomeProject/node_modules/.bin/react-native run-ios --simulator --no-packager --verbose': Error while executing command '/Users/superandrew/Desktop/dc/AwesomeProject/node_modules/.bin/react-native run-ios --simulator --no-packager --verbose' (error code 101)"
errPrint "Error while executing command '/Users/superandrew/Desktop/dc/AwesomeProject/node_modules/.bin/react-native run-ios --simulator --no-packager --verbose': Error while executing command '/Users/superandrew/Desktop/dc/AwesomeProject/node_modules/.bin/react-native run-ios --simulator --no-packager --verbose' (error code 101)"
in the end with no nvm I was able to launch the debugger with react native. But not in expo (expo-cli installed globally, watchman through brew).
I suspect I am still using node v.12.8.1
```OS: darwin x64
Adapter node: v12.8.1 x64
vscode-chrome-debug-core: 6.8.8
Could not debug. [object Object]
but..
➜ my-new-project git:(master) ✗ node --version
v13.11.0
```
superandrew
on 31 Mar 2020
@superandrew Adapter node here is the version of Node.js which is built in VS Code, it means that the debugger process works on Node.js 12.8.1 provided by VS Code. But the debuggerWorker.js process(from which we communicate with the application) is working on the Node.js version installed on your PC.
For example if you have Node.js 12.16.1 your debuggerWorker.js will work on Node.js 12.16.1, but the extension code that is responsible for the debugger session will work on 12.8.1. That's why you see the difference in here.
If I understood correctly Debug Android and Debug iOS scenarios worked without problems, but the issue with Expo persists?
SounD120
on 1 Apr 2020
yes, that is exact. I had no errors debugging react native. I wasn't able to set a breakpoint to be honest and watch the debugger stop, but when I told the debugger to start the app launched in the simulator and there were no errors on the debug console.
superandrew
on 1 Apr 2020
@superandrew, we were able to reproduce an error similar to your case and found out probable place in the code where the error can be thrown.
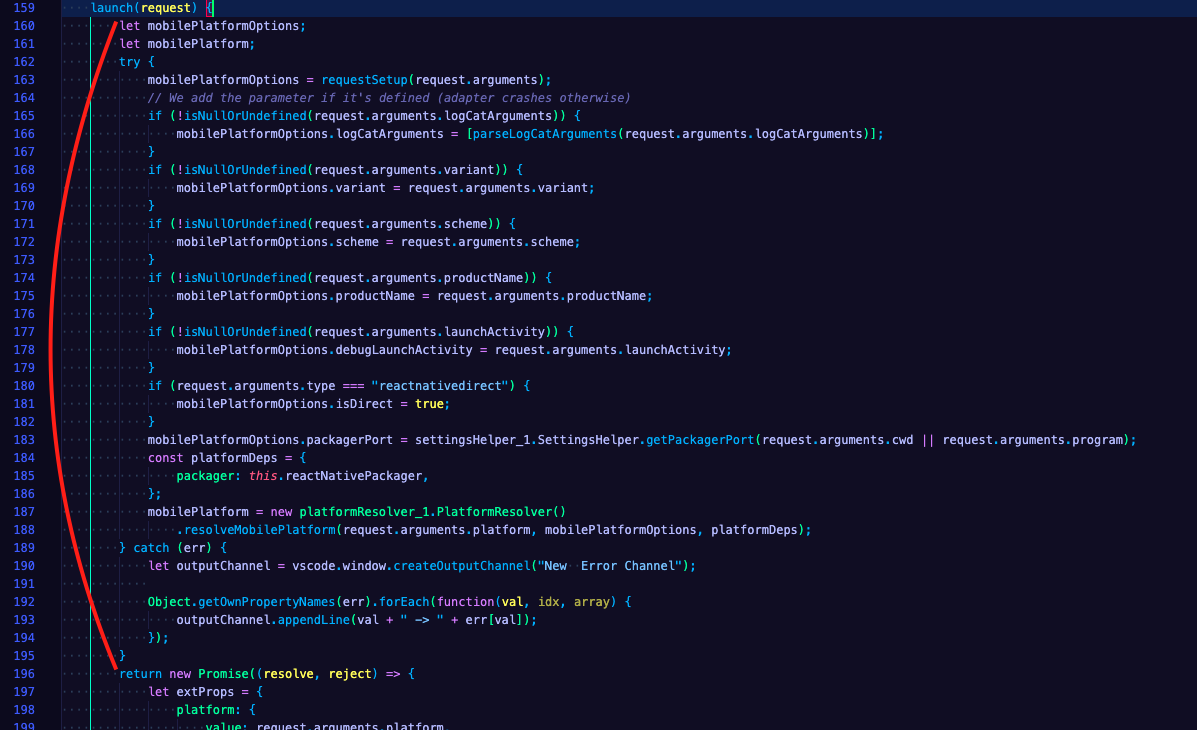
Could you please modify launch function the same way as below, run Expo debugging again and send us outputs from new output channel called New Error Channel?
        let mobilePlatformOptions;
        let mobilePlatform;
        try {
            mobilePlatformOptions = requestSetup(request.arguments);
            // We add the parameter if it's defined (adapter crashes otherwise)
            if (!isNullOrUndefined(request.arguments.logCatArguments)) {
                mobilePlatformOptions.logCatArguments = [parseLogCatArguments(request.arguments.logCatArguments)];
            }
            if (!isNullOrUndefined(request.arguments.variant)) {
                mobilePlatformOptions.variant = request.arguments.variant;
            }
            if (!isNullOrUndefined(request.arguments.scheme)) {
                mobilePlatformOptions.scheme = request.arguments.scheme;
            }
            if (!isNullOrUndefined(request.arguments.productName)) {
                mobilePlatformOptions.productName = request.arguments.productName;
            }
            if (!isNullOrUndefined(request.arguments.launchActivity)) {
                mobilePlatformOptions.debugLaunchActivity = request.arguments.launchActivity;
            }
            if (request.arguments.type === "reactnativedirect") {
                mobilePlatformOptions.isDirect = true;
            }
            mobilePlatformOptions.packagerPort = settingsHelper_1.SettingsHelper.getPackagerPort(request.arguments.cwd || request.arguments.program);
            const platformDeps = {
                packager: this.reactNativePackager,
            };
            mobilePlatform = new platformResolver_1.PlatformResolver()
                .resolveMobilePlatform(request.arguments.platform, mobilePlatformOptions, platformDeps);
        } catch (err) {
            let outputChannel = vscode.window.createOutputChannel("New  Error Channel");

            Object.getOwnPropertyNames(err).forEach(function(val, idx, array) {
                outputChannel.appendLine(val + " -> " + err[val]);
            });
        }
After the change launch function should look something like this:
Could you please also send us your debug configurations from launch.json file?
RedMickey
on 1 Apr 2020
I'm afraid that after the change there is no "New Error Channel".. perhaps the error wasn't catched or I did something wrong.
My launch.json
{

  "version": "0.2.0",
  "configurations": [
    {
      "name": "Attach to packager",
      "cwd": "${workspaceFolder}",
      "type": "reactnative",
      "request": "attach"
    },

    {
      "name": "Debug in Exponent",
      "cwd": "${workspaceFolder}",
      "type": "reactnative",
      "request": "launch",
      "platform": "exponent",
      "trace": "verbose"
    }
  ]
}
I am sure that the code is executed because if I put some random string and reload the extension I have another error.
superandrew
on 1 Apr 2020
I noticed that If I put
let outputChannel = vscode.window.createOutputChannel("New Output Channel"); on the first line of launch it still doesn't get executed (or better the channel doesn't get created).
Could that mean that the error is before launch?
superandrew
on 2 Apr 2020
small update:
I was able to create a new output channel on the first line of launch. However no channel is created when the new channel creation is in the catch.
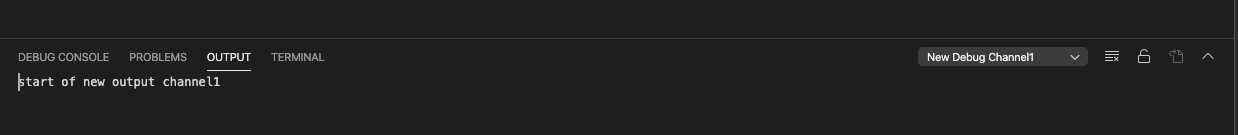
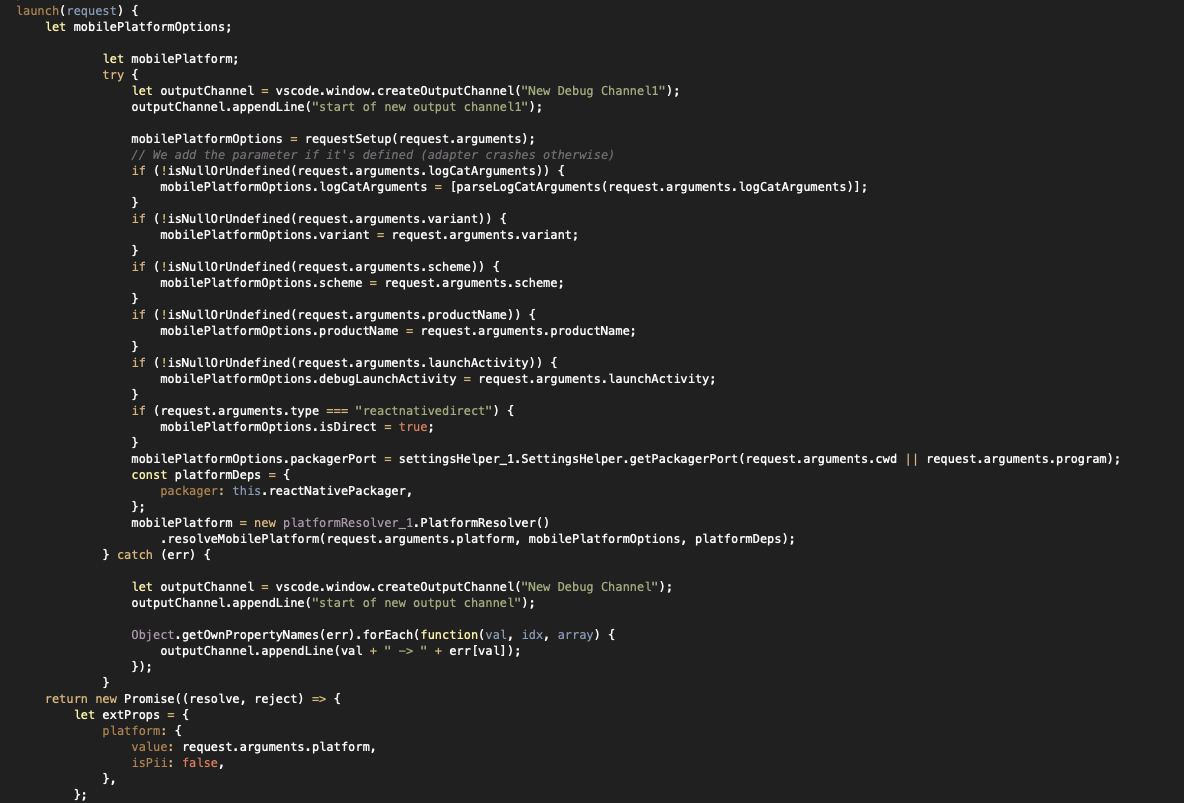
superandrew
on 2 Apr 2020
so from what I see it seems the catch isn't executed, is it?
superandrew
on 2 Apr 2020
@superandrew, thanks a lot for your effort. Yes, it seems that the error occurs further in the code. We continue to dig it out.
RedMickey
on 2 Apr 2020
I don't know the internals, but from what I read on this stack:
stack -> Error: InternalError: Internal Error when calling 'Extension.launch'
    at Client.processMessage (/Users/superandrew/.vscode/extensions/msjsdiag.vscode-react-native-0.14.2/node_modules/noice-json-rpc/lib/noice-json-rpc.js:66:36)
    at WebSocket.<anonymous> (/Users/superandrew/.vscode/extensions/msjsdiag.vscode-react-native-0.14.2/node_modules/noice-json-rpc/lib/noice-json-rpc.js:42:48)
    at WebSocket.emit (events.js:203:13)
    at Receiver._receiver.onmessage (/Users/superandrew/.vscode/extensions/msjsdiag.vscode-react-native-0.14.2/node_modules/ws/lib/WebSocket.js:141:47)
    at Receiver.dataMessage (/Users/superandrew/.vscode/extensions/msjsdiag.vscode-react-native-0.14.2/node_modules/ws/lib/Receiver.js:389:14)
    at Receiver.getData (/Users/superandrew/.vscode/extensions/msjsdiag.vscode-react-native-0.14.2/node_modules/ws/lib/Receiver.js:330:12)
    at Receiver.startLoop (/Users/superandrew/.vscode/extensions/msjsdiag.vscode-react-native-0.14.2/node_modules/ws/lib/Receiver.js:165:16)
    at Receiver.add (/Users/superandrew/.vscode/extensions/msjsdiag.vscode-react-native-0.14.2/node_modules/ws/lib/Receiver.js:139:10)
    at Socket.<anonymous> (/Users/superandrew/.vscode/extensions/msjsdiag.vscode-react-native-0.14.2/node_modules/ws/lib/WebSocket.js:138:22)
    at Socket.emit (events.js:203:13)
message -> InternalError: Internal Error when calling 'Extension.launch'
It seems to be a problem related to websocket (connecting? a message received with unexpected payload?). Is there anything I could check given that this is a Mac Pro with Catalina and an initial setup? Any package that I am missing? Any package I should check? Just as an example, a possible "little snitch" denying connections (which I don't have here).
superandrew
on 2 Apr 2020
@superandrew Yes, it seems that something is breaking when the extension tries to exchange messages from Extension to Debugger or vice versa on the Websocket level, but it also could be that the Extension received a malformed message from the Debugger. Do you use any VPNs for your internet connection, or some custom network configurations that, by your opinion, can affect this?
SounD120
on 3 Apr 2020
@SounD120 as this is a very clean Mac I suspected that that could be a missing dependency instead of some conflict. I sometimes use Proxyman as a proxy to debug, which I use in my laptop as well, and no, I have no VPNs in place.
As an "extreme" measure, how difficult would it be to debug this extension so that I could read and provide some step by step info?
superandrew
on 3 Apr 2020
@superandrew We have this described in our documentation for contributors. To do that you need to clone the repository, install Gulp, run npm ci, and then run Launch Extension + Debug Debugger scenario. That will allow you to debug the extension working in one VS Code instance from the another VS Code instance.
The extension is divided into the extension context(folders src/common, src/extension) and the debugger context (src/debugger). These contexts are connected using the RPC Websocket connection and are debugged independently.
Make sure to add debugServer: 4712 to your launch scenario if you want to debug Debugger Context, that will ask the Extension Host debugger to connect to the Debugger Context of the extension (if the Debug Debugger scenario has been launched before), otherwise the breakpoints placed in the debugger context will not work.
Let us know if this was helpful for you. Feel free to ask any questions if you face difficulties during debugging.
SounD120
on 3 Apr 2020
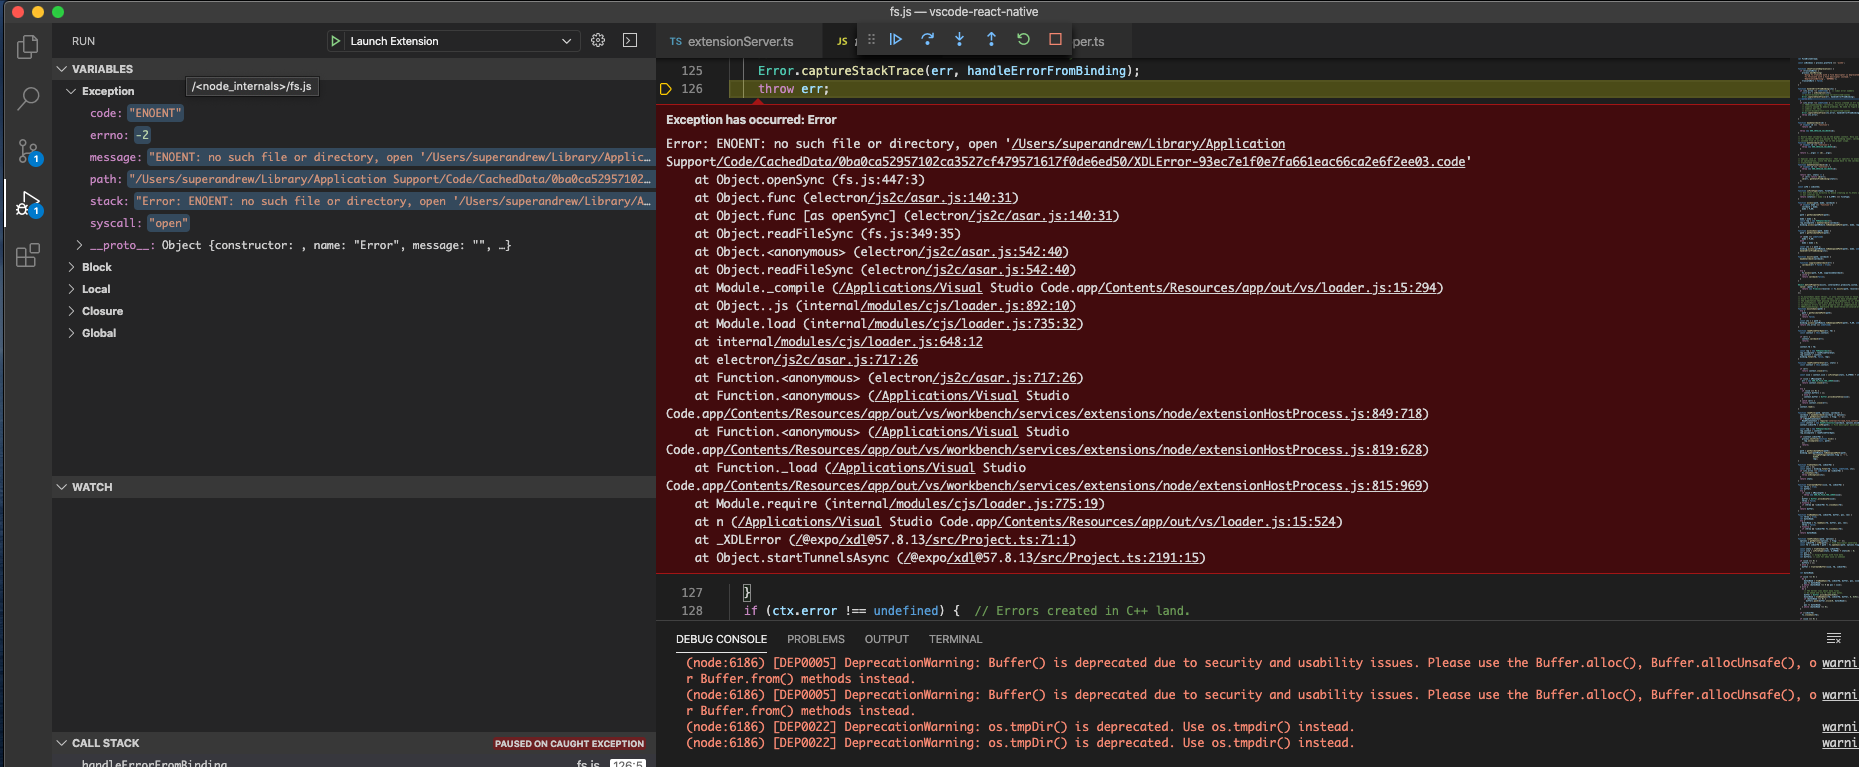
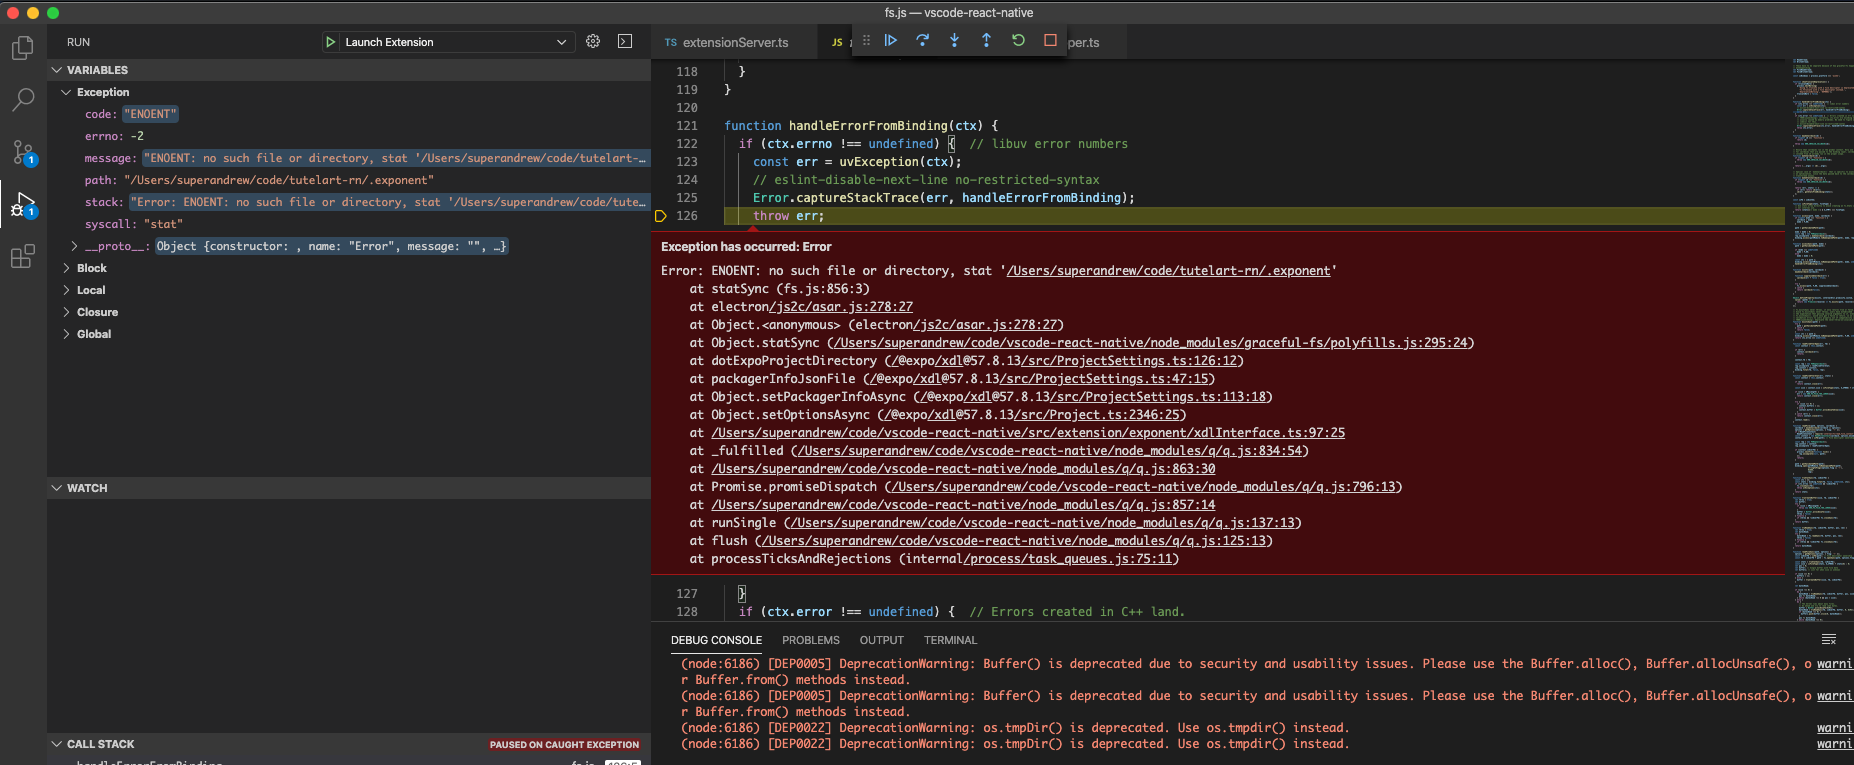
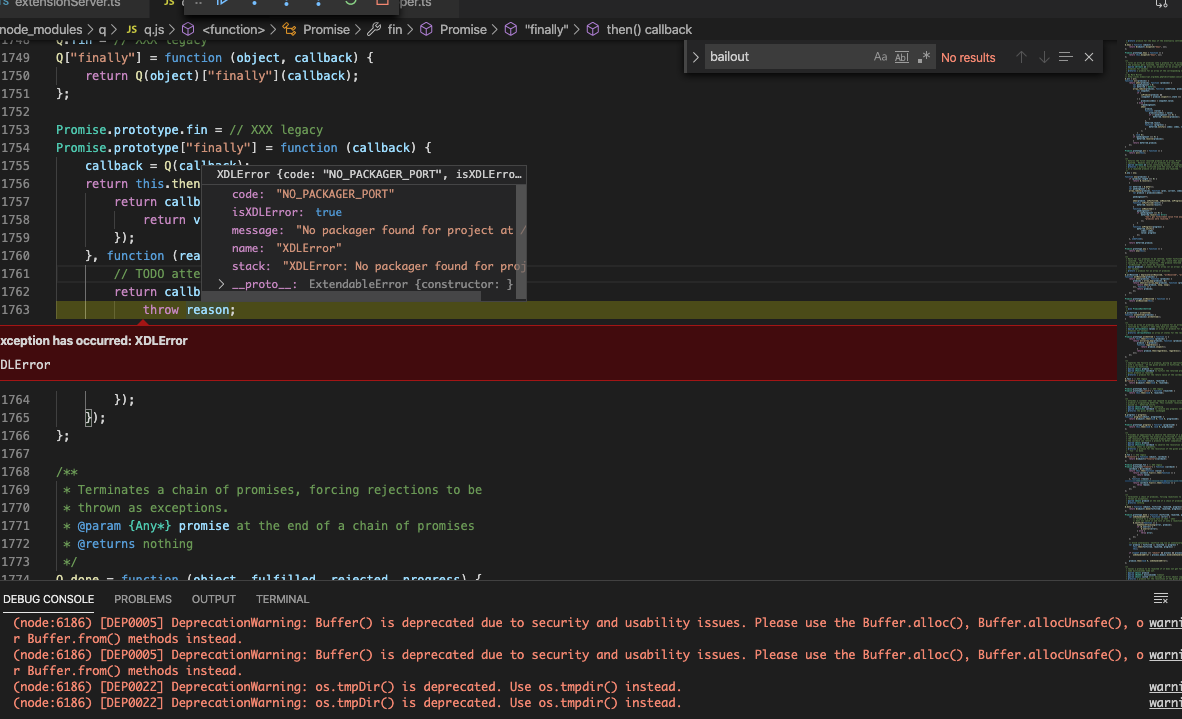
after a couple of debugging sessions, I found many errors thrown for missing folders or files (but I guess they are normal. And the last error is:
XDLError {code: "NO_PACKAGER_PORT", isXDLError: true, message: "No packager found for project at /Users/superandre…", name: "XDLError", stack: "XDLError: No packager found for project at /Users/…"}
code:"NO_PACKAGER_PORT"
isXDLError:true
message:"No packager found for project at /Users/superandrew/code/tutelart-rn."
name:"XDLError"
stack:"XDLError: No packager found for project at /Users/superandrew/code/tutelart-rn.
    at Object.startTunnelsAsync (/@expo/[email protected]/src/Project.ts:2191:11)"
__proto__:ExtendableError {constructor: }
superandrew
on 4 Apr 2020
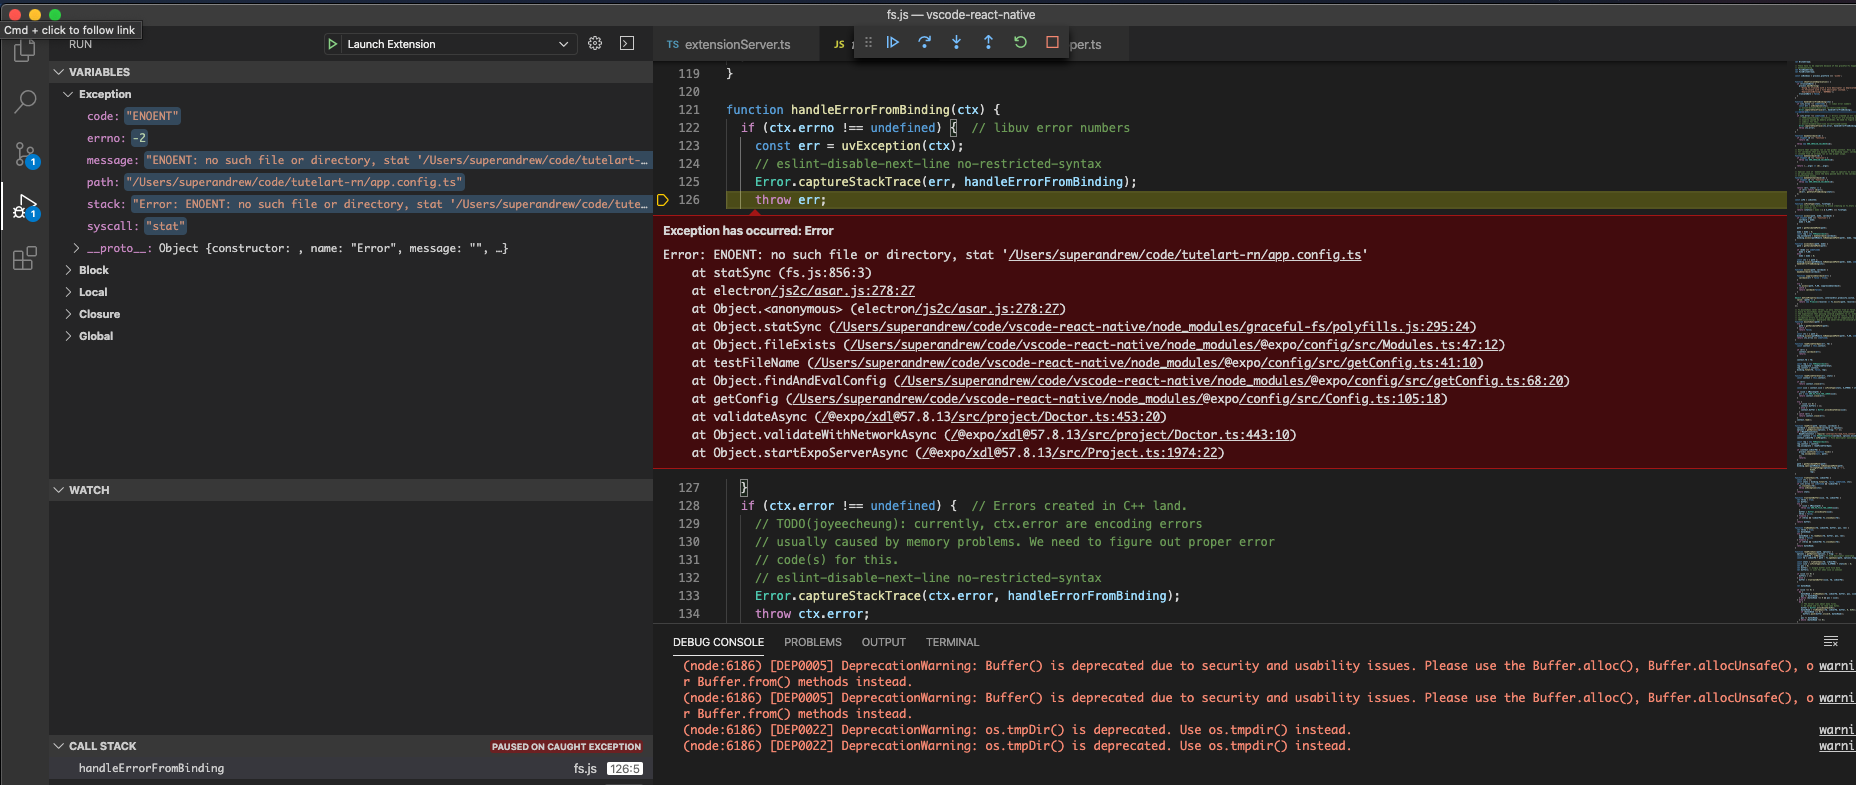
the debugger crashes here
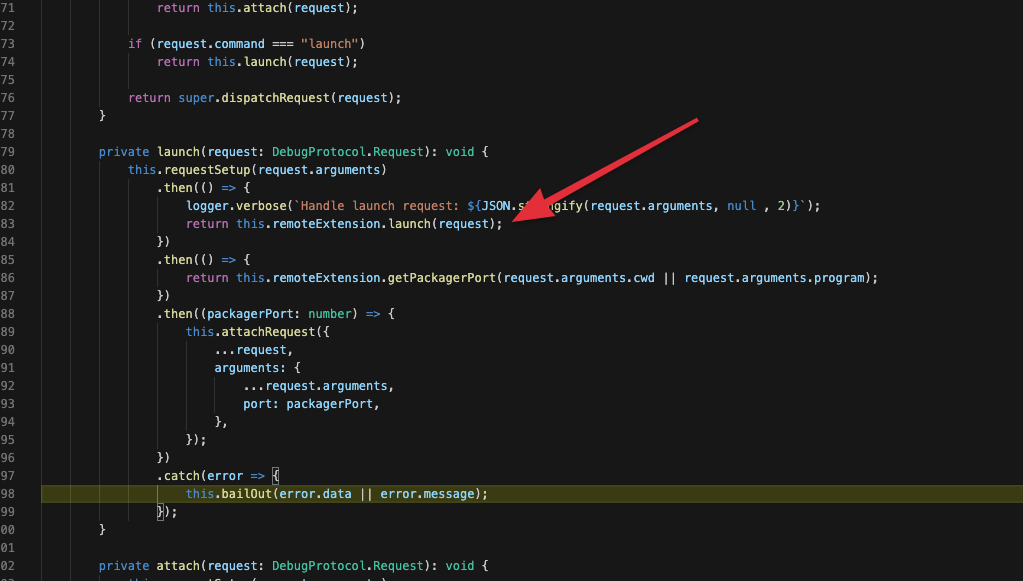
As you probably already imagined.
Let me know if I could be of help. Of course if you like I'm available for remote session with my debugger if you think that could help.
superandrew
on 4 Apr 2020
in the end it seems that the error is a message received through ws and processed in processMessage which says "internal error" and nothing more than we discovered earlier.
this error: https://github.com/nojvek/noice-json-rpc/blob/65af3869d7782ae9f01bde2fb6895db815e22eb0/src/json-rpc2.ts#L82
superandrew
on 4 Apr 2020
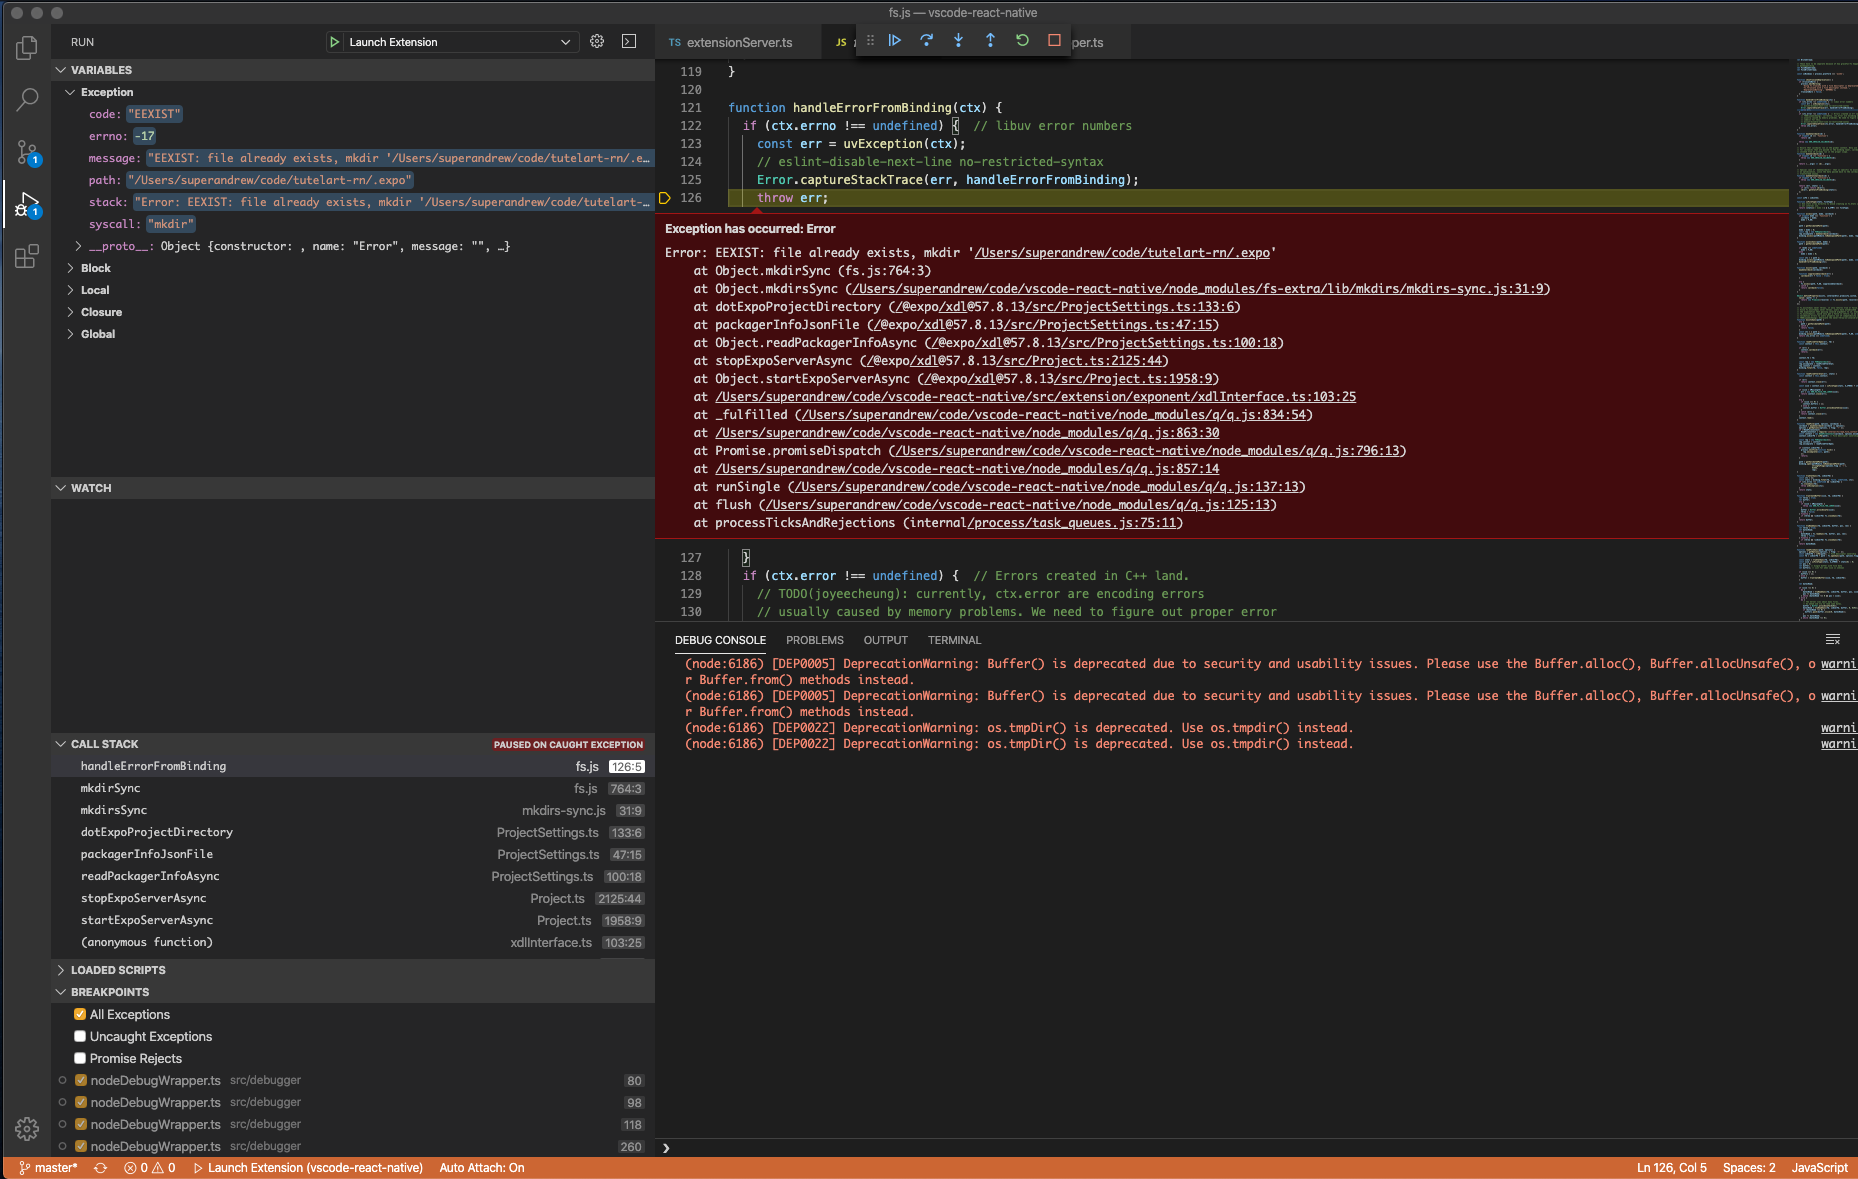
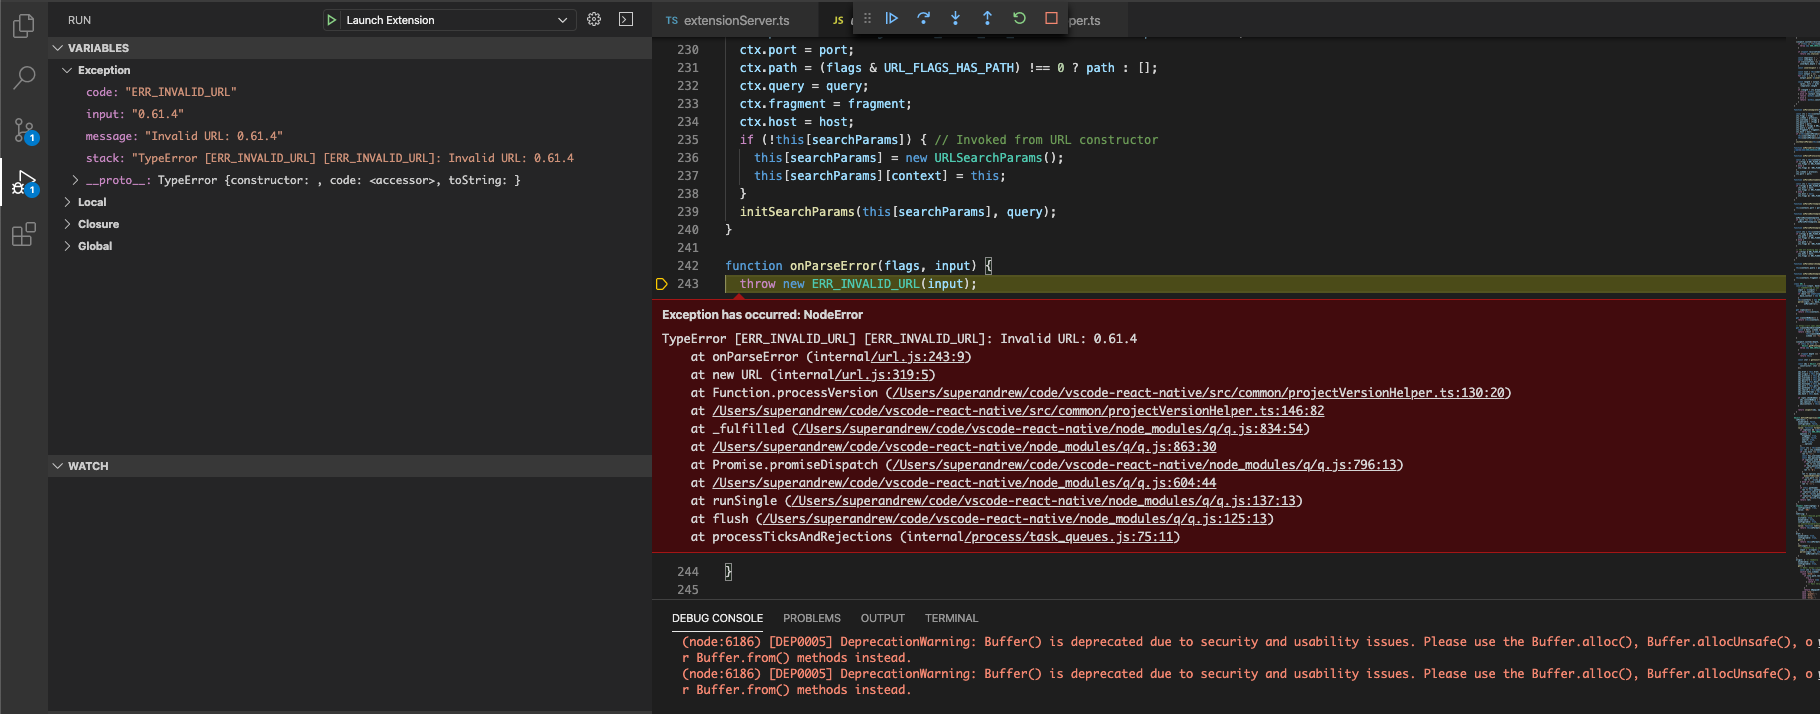
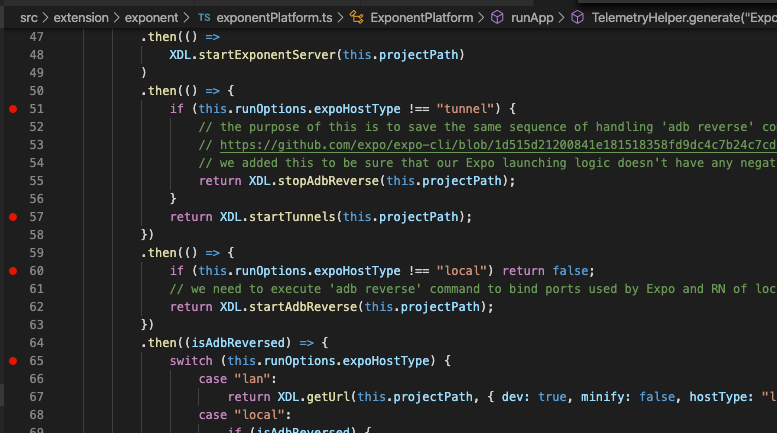
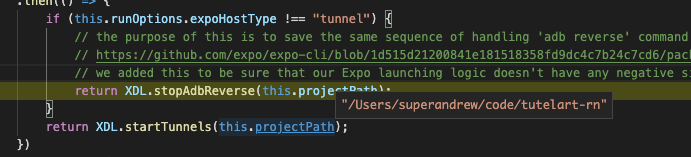
after further digging, the main error seems to be located/related to return XDL.startTunnels(this.projectPath); on line 57-ish of exponentPlatform.ts
After failure, it returns this:
Error
message:""
stack:"Error
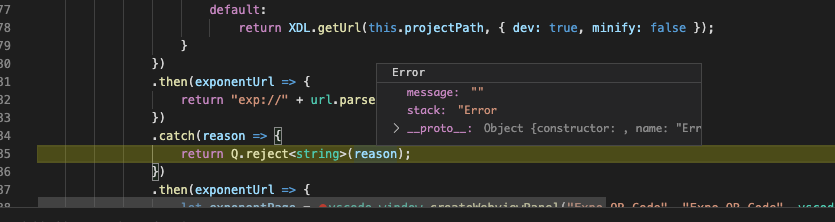
At this point I don't think I am going to be able to dig further w/out your help.
Thanks!
superandrew
on 4 Apr 2020
@superandrew, thanks for your investigation, it seems that there could be some issue with Expo tunnel feature. In the extension we use startTunnelsAsync function from @expo/xdl package to create a tunnel. But the extension allows to debug an Expo app without using a tunnel. You can use expoHostType (see in React Native debug configuration properties) parameter in launch configurations to specify host type.
Could you please try to do the following:
- Reboot your machine (just in case)
In
Debug in Exponentconfiguration addexpoHostTypeparameter:"expoHostType": "lan"So the extension will use your LAN to deploy and install an application.
For Android devices you can specify
localvalue to install and debug an Expo app via USB connection"expoHostType": "local"- Start debugging
Please let us know about your results.
RedMickey
on 6 Apr 2020
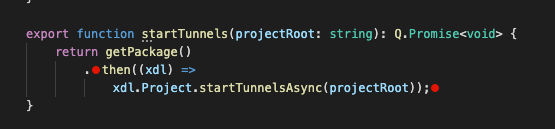
Hi @superandrew . In addition to @RedMickey 's post, it seems that the exact error is https://github.com/expo/expo-cli/blob/master/packages/xdl/src/Project.ts#L2191.
It means that Expo XDL didn't found packagerPort in your ${projectRoot}/.expo/packager-info.json file.
In my case it looks like this and debugging works without any problems:
{
  "packagerPort": 8081,
  "expoServerPort": 19000,
  "expoServerNgrokUrl": null,
  "packagerNgrokUrl": null,
  "ngrokPid": null
}
Could you please take a look at this file and check if packagerPort exists?
SounD120
on 6 Apr 2020
Hi @superandrew . In addition to @RedMickey 's post, it seems that the exact error is https://github.com/expo/expo-cli/blob/master/packages/xdl/src/Project.ts#L2191.
It means that Expo XDL didn't foundpackagerPortin your${projectRoot}/.expo/packager-info.jsonfile.
In my case it looks like this and debugging works without any problems:{ "packagerPort": 8081, "expoServerPort": 19000, "expoServerNgrokUrl": null, "packagerNgrokUrl": null, "ngrokPid": null }Could you please take a look at this file and check if
packagerPortexists?
this is my packager-info.json in .expo
{
  "expoServerPort": 19000,
  "packagerPort": 8081,
  "expoServerNgrokUrl": null,
  "packagerNgrokUrl": null,
  "ngrokPid": null,
  "devToolsPort": 19002,
  "packagerPid": null,
  "webpackServerPort": null
}
@superandrew, thanks for your investigation, it seems that there could be some issue with Expo tunnel feature. In the extension we use
startTunnelsAsyncfunction from @expo/xdl package to create a tunnel. But the extension allows to debug an Expo app without using a tunnel. You can useexpoHostType(see in React Native debug configuration properties) parameter in launch configurations to specify host type.
Could you please try to do the following:
- Reboot your machine (just in case)
In
Debug in Exponentconfiguration addexpoHostTypeparameter:"expoHostType": "lan"So the extension will use your LAN to deploy and install an application.
For Android devices you can specifylocalvalue to install and debug an Expo app via USB connection"expoHostType": "local"- Start debugging
Please let us know about your results.
unfortunately, that didn't work.
Here's my launch config.
{

  "version": "0.2.0",
  "configurations": [

    {
      "name": "Attach to packager",
      "cwd": "${workspaceFolder}",
      "type": "reactnative",
      "request": "attach"
    },

    {
      "name": "Debug in Exponent",
      "cwd": "${workspaceFolder}",
      "type": "reactnative",
      "request": "launch",
      "platform": "exponent",
      "trace": "verbose",
      "expoHostType": "lan"

    }
  ]
}
What absolutely puizzles me is that "attach to packager" works.
OS: darwin x64
Adapter node: v12.8.1 x64
vscode-chrome-debug-core: 6.8.8
Starting debugger app worker.
Established a connection with the Proxy (Packager) to the React Native application
@superandrew, Attach to packager works because in this case we don't call Extension.launch method where the error occurs.
Did you get the same error when you were trying to debug an application with "expoHostType": "lan" parameter? Were there any errors in exponentPlatform.ts file as in the previous case with tunnel configuration?
reason
XDLError {code: "NO_PACKAGER_PORT", isXDLError: true, message: "No packager found for project at /Users/superandre…", name: "XDLError", stack: "XDLError: No packager found for project at /Users/…"}
code:"NO_PACKAGER_PORT"
isXDLError:true
message:"No packager found for project at /Users/superandrew/code/tutelart-rn."
name:"XDLError"
stack:"XDLError: No packager found for project at /Users/superandrew/code/tutelart-rn.
at Object.startTunnelsAsync (/@expo/[email protected]/src/Project.ts:2191:11)"
__proto__:ExtendableError {constructor: }
RedMickey
on 7 Apr 2020
I'm not sure, but.. I never get to line 66.
superandrew
on 7 Apr 2020
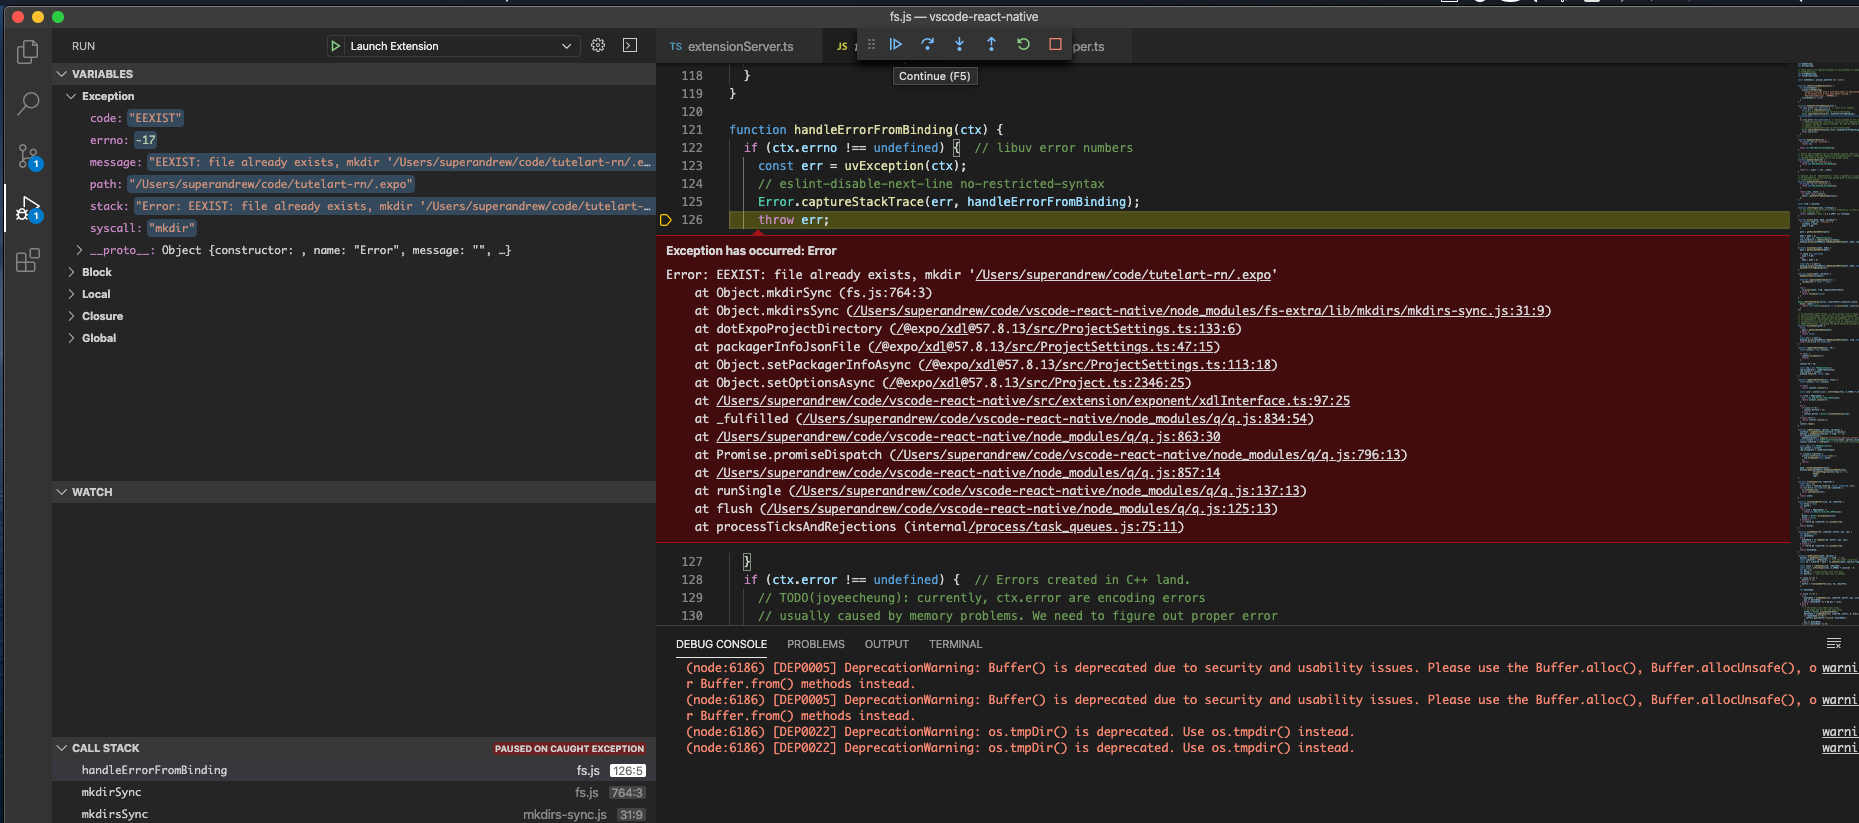
the failure is now on line 55
basically:
tunnel fails here:
lan fails here
superandrew
on 7 Apr 2020
@superandrew, as seen from this error:
reason
XDLError {code: "NO_PACKAGER_PORT", isXDLError: true, message: "No packager found for project at /Users/superandre…", name: "XDLError", stack: "XDLError: No packager found for project at /Users/…"}
code:"NO_PACKAGER_PORT"
isXDLError:true
message:"No packager found for project at /Users/superandrew/code/tutelart-rn."
name:"XDLError"
stack:"XDLError: No packager found for project at /Users/superandrew/code/tutelart-rn.
at Object.startTunnelsAsync (/@expo/[email protected]/src/Project.ts:2191:11)"
proto:ExtendableError {constructor: }
It seems that this is the root directory of your project /Users/superandrew/code/tutelart-rn..
Is this path correct? It looks quite strange, since there is a dot . at the end of this path.
Could you please check what projectPath variable contains and if that path is correct project root?
During debugging the extension you can check projectPath value setting up a breakpoint here (assumes that expoHostType is lan) and then find this.projectPath variable in VS Code VARIABLES panel.

Please let us know about your results.
RedMickey
on 9 Apr 2020
first, you have a wonderful color scheme.
second, unfortunately I already checked it and it seems the projectPath is fine. I should also note that the extension doesn't work with any project, so I guess it is a "machine/setup" problem and not a project one, also because the project works fine in at least three different computers.
I'm completely lost about this. I tried installing node from the installer, installing Java SDK (which I haven't before) but there is nothing about this machine being particularly different. This is a Mac I set up to work from home, so It would have been more easy to have problem on the laptop I use every day, with many different projects, setups, frameworks etc.
This started clean. If you have no other ideas, well I guess I'll stick to "Attach to packager".
superandrew
on 9 Apr 2020
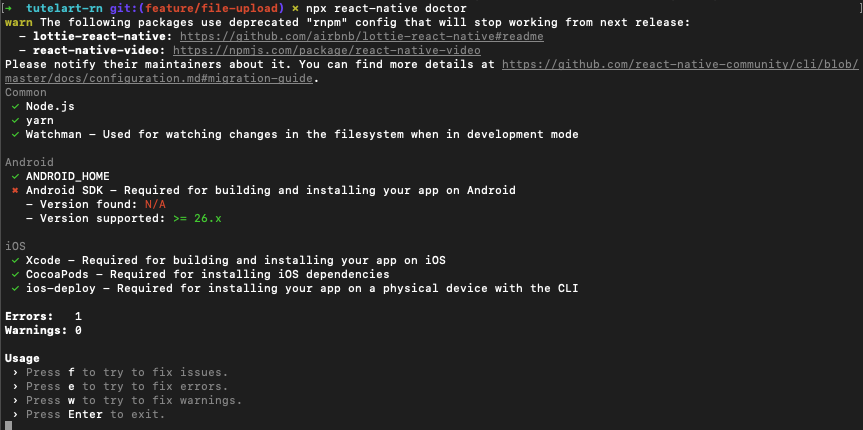
@superandrew can you try running npx react-native doctor see if it identifies any issue?
 molant
on 9 Apr 2020
molant
on 9 Apr 2020
@molant unfortunately, it doesn't seem like there are issues. Also, I'm having this problem also on newly created expo project (but not react native project)
superandrew
on 10 Apr 2020
just to understand @RedMickey @SounD120 : the point where I loose the debugger (in lan and tunnel case) is going into native bindings? is there any way to debug them in case?
superandrew
on 10 Apr 2020
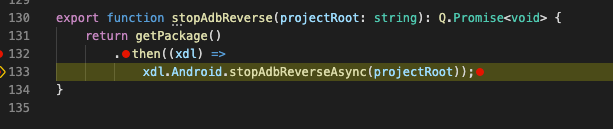
@superandrew The issue that you have faced is not connected with the extension directly. The issue has happened inside the Expo Development Library (@expo/xdl). You can debug it directly in the node_modules.
For example to debug the stopAdbReverse function you'll need to:
- open
<your downloaded for debug extension>/node_modules/@expo/xdl/build/Android.jsfile. Keep in mind that this package is installed in runtime, so if you can't find it you'll have to runDebug in Exponentscenario at least once. This action will install that package. - put a breakpoint on line 645

- Run
Debug in Exponentdebug scenario in the[Extension Development Host]
When the code execution will reach out to the stopAdbReverse function the extension will find sourcemaps for the JS file and stop in the corresponding Android.ts file for debugging.

With respect to the other recommendations that we can propose:
- check your
.zshrcfile and make sure that theprocess.envvariable in VS Code context configured correctly (you can do this by callingconsole.log(process.env)command in the VS Code Developer Tools menu, also this can be done here for example. Maybe some of your environment variables in VS Code context are in conflict with the XDL code logic - run
expo doctor
Please let us know if you find something, this will be very helpful for us.
Thank you.
SounD120
on 10 Apr 2020
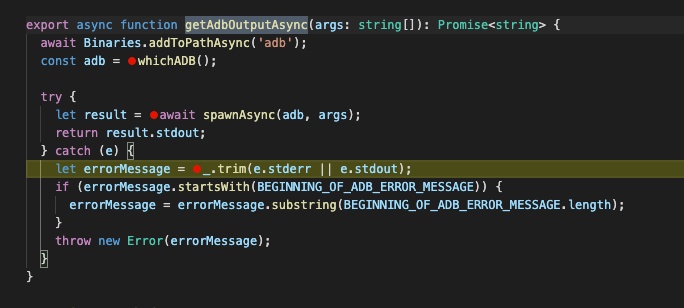
I am debugging. Just a simple question: do you know if Android SDK is a requirement for EXPO/XDL/React Native tools?
superandrew
on 10 Apr 2020
@superandrew XDL uses ADB which is the part of the Android SDK, so it is required for that. Do you have it installed?
SounD120
on 10 Apr 2020
ahah.
superandrew
on 10 Apr 2020
superandrew
on 10 Apr 2020
ok.. I'm sorry I didn't read that Android SDK was required. My bad. I'm sad because I was start having fun. I think someone at expo should correct that error. @SounD120 are you in contact? or should I raise an issue there? The problem here is the empty error message I guess.
superandrew
on 10 Apr 2020
@superandrew Sure, raise an issue in expo-cli repo if you have concrete repro steps now. From our side we will check our documentation requirements more strictly to add the Android SDK requirement in there. We'll also check logging from the Extension.launch to avoid such problems in future. I suppose that the issue is resolved now? Can I close it or you have any other questions?
SounD120
on 10 Apr 2020
@SounD120 please feel free to add your feedback or any integration in my issue if something isn't clear
superandrew
on 10 Apr 2020
@superandrew Thanks a lot for your efforts in discovering this. I am closing this issue now as resolved. Lets continue the discussion of this problem in https://github.com/expo/expo-cli/issues/1858.
Feel free to open new issues if needed.
SounD120
on 10 Apr 2020
thanks! it's been a pleasure! I can confirm everything works now.
superandrew
on 10 Apr 2020
@superandrew Glad to hear that. Feel free to reach us if you face any other questions about the extension.
SounD120
on 10 Apr 2020
Related issues
molant
·
3Comments
 canpoyrazoglu
·
3Comments
canpoyrazoglu
·
3Comments
 dimitarnestorov
·
4Comments
dimitarnestorov
·
4Comments
 vladimir-kotikov
·
5Comments
vladimir-kotikov
·
5Comments
 AlexandreLouisnard
·
3Comments
AlexandreLouisnard
·
3Comments
Most helpful comment
@SounD120 please feel free to add your feedback or any integration in my issue if something isn't clear
https://github.com/expo/expo-cli/issues/1858