Vscode-php-debug: Still working after last updates from VSCode?
All all,
I'm asking if anyone of you are having troubles after the last Visual Studio Code updates, anyone?
Thanks.
 lmarcelocc
All 28 comments
Yes! Yesterday-day, I was using Xdebug and setting breakpoints and everything was perfectly fine.
Then I took my laptop home, and VS suggested it wanted to update, and I updated it, and... cue threeish hours trying to figure out what the problem was, and failing.
Eventually, I had to let it go. But my problem seemed to be somewhere down the chain of generating the serverFileUri for my breakpoints (I'm assuming that's what I see in my xdebug log). I could get VS to find the files for the exceptions XDebug gave it, but my xdebug log showed breakpoint file uris that were pretty much just the local mapping (rather than any kind of converted server mapping), and of course it did not break at the breakpoints.
I have no idea what the issue is, though, and don't have experiencing debugging extensions. Do you happen to know of an easy way of, say, logging things from the extension or launch.json to the VS console? I'd love proof of what ${workspaceRoot} (or the other variants variables I tried out) actually outputs.
 salixrosa
on 15 Feb 2018
salixrosa
on 15 Feb 2018
Debugging stopped working when I updated VS Code to the v1.20. I downgraded VS Code to the v1.19.3 and debugging started working properly again.
 patrik-martinko
on 15 Feb 2018
patrik-martinko
on 15 Feb 2018
@salixrosa sorry, don't know as well, how to debug the extension.
@patrik-martinko, can you share you launch.json ? Still can't get this working after downgraded to VS Code v1.19.3 :/
lmarcelocc
on 15 Feb 2018
I didn't revert my VS Code back, but I just got it working by giving up on all the possible workspaceRoot -ish variables and doing this:
{
    // Use IntelliSense to learn about possible attributes.
    // Hover to view descriptions of existing attributes.
    // For more information, visit: https://go.microsoft.com/fwlink/?linkid=830387
    "version": "0.2.0",
    "configurations": [
        {
            "name": "Listen for XDebug",
            "type": "php",
            "request": "launch",
            "port": 9000,
            "pathMappings": {
                "/var/www": "c:/vagrant/www"
            }
        },
    ]
}
To figure out the "c:/vagrant/www" part, I literally just looked at what was being set for the breakpoint in the xdebug log, eg:
<- breakpoint_set -i 4 -t line -f c:/vagrant/www/[somerandomfilepathIwasbreakpointingsomewhere].php -n 370
-> <response xmlns="urn:debugger_protocol_v1" xmlns:xdebug="http://xdebug.org/dbgp/xdebug" command="breakpoint_set" transaction_id="4" id="42890271"></response>
So if you have a different file system, or whatever, that should help you make sure things are matching.
salixrosa
on 15 Feb 2018
I wasn't use workspaceRoot variable before and my config is very similar to yours.
lmarcelocc
on 15 Feb 2018
What're you getting for your xdebug log?
On Feb 15, 2018 1:05 PM, "lmarcelocc" notifications@github.com wrote:
I wasn't use workspaceRoot variable before and my config is very similar
to yours.—
You are receiving this because you were mentioned.
Reply to this email directly, view it on GitHub
https://github.com/felixfbecker/vscode-php-debug/issues/239#issuecomment-366028827,
or mute the thread
https://github.com/notifications/unsubscribe-auth/ACp9VXLtfKcWEYX2ZWh_goO5fmu_CU8Qks5tVH_2gaJpZM4SGBIv
.
salixrosa
on 15 Feb 2018
This is what I get when start the debugging on VS Code:
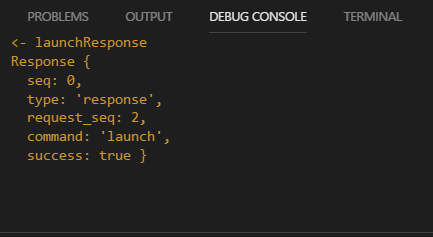
and my xdebug.log is completely empty and I've settled already 777 permissions (yes, I'm desperate):

And this is my launch.json
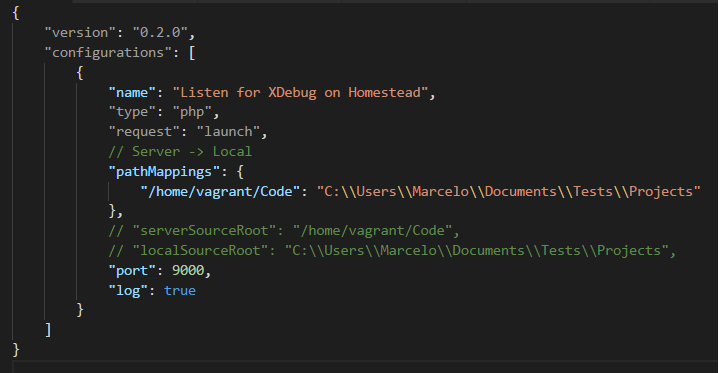
I've tested a lot of mapping, like:
"/home/vagrant/Code/myProject": "C:\\Users\\Marcelo\\Documents\\AlterFrame\\Projects\\myProject"
"/home/vagrant/Code/myProject/public": "C:\\Users\\Marcelo\\Documents\\AlterFrame\\Projects\\myProject\\public"
but no success so far :/
Edit: My bad, a typo with xdebug.remote.log instead of xdebug.remote_log
Now I've something on the log, let me debug!
lmarcelocc
on 15 Feb 2018
Does your php_info look all right? I often do PHP --version in my command
line (in the environment where the actual PHP is running) as a quick way to
make sure XDebug is being included at all, when I don't feel like looking
through the full info.
In my setup, if I run a php script via the command line as a user who
doesn't have the correct permission for the log file, it actually tells me
about that before running the whole thing. If you're not getting any
warnings, and you've got the file at 777 but it's empty, it sounds like
XDebug isn't running at all.
On Feb 15, 2018 1:16 PM, "lmarcelocc" notifications@github.com wrote:
This is what I get when start the debugging on VS Code:
[image: st1]
https://user-images.githubusercontent.com/6483007/36275999-6d9b176e-1284-11e8-8756-b39e0a1bd08e.pngand my xdebug.log is completely empty and I've settled already 777
permissions (yes, I'm desperate):
[image: st2]
https://user-images.githubusercontent.com/6483007/36276045-8f25d98c-1284-11e8-8cd1-12d7859de72f.pngAnd this is my launch.json
[image: st3]
https://user-images.githubusercontent.com/6483007/36276099-b7d3067a-1284-11e8-9ada-a4f074416d39.png—
You are receiving this because you were mentioned.
Reply to this email directly, view it on GitHub
https://github.com/felixfbecker/vscode-php-debug/issues/239#issuecomment-366032008,
or mute the thread
https://github.com/notifications/unsubscribe-auth/ACp9VUTYGUIAtrUMOvbHb1oEhPxaFdlkks5tVIKUgaJpZM4SGBIv
.
salixrosa
on 15 Feb 2018
Yes, my phpinfo() shows that xdebug 2.6 is installed and running.
This is what's within xdebug.log
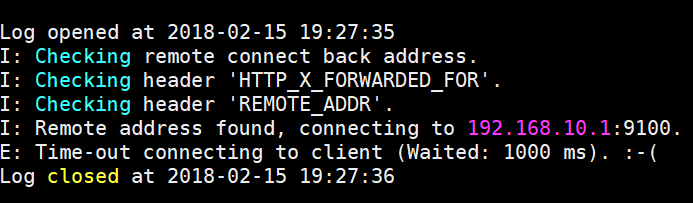
Any ideia what could be?
Thanks.
lmarcelocc
on 15 Feb 2018
Looks like your xdebug is trying port 9100, but launch.json is listening on
- Changing it in launch.json might work for ya!
On Feb 15, 2018 1:29 PM, "lmarcelocc" notifications@github.com wrote:
Yes, my phpinfo() shows that xdebug 2.6 is installed and running.
This is what's within xdebug.log
[image: st4]
https://user-images.githubusercontent.com/6483007/36276633-73fdfda4-1286-11e8-8667-bbd0f76173af.pngAny ideia what could be?
Thanks.
—
You are receiving this because you were mentioned.
Reply to this email directly, view it on GitHub
https://github.com/felixfbecker/vscode-php-debug/issues/239#issuecomment-366035627,
or mute the thread
https://github.com/notifications/unsubscribe-auth/ACp9VVMc_tMPayVhXZi3jFxurdGgYpp7ks5tVIWAgaJpZM4SGBIv
.
salixrosa
on 15 Feb 2018
Oh, sorry for that,.
That was I trying to despite, and I've changed both on xdebug and launch.json but still nothing.
lmarcelocc
on 15 Feb 2018
weird, it found the remote address but can't communicate with the client (my machine I guess).
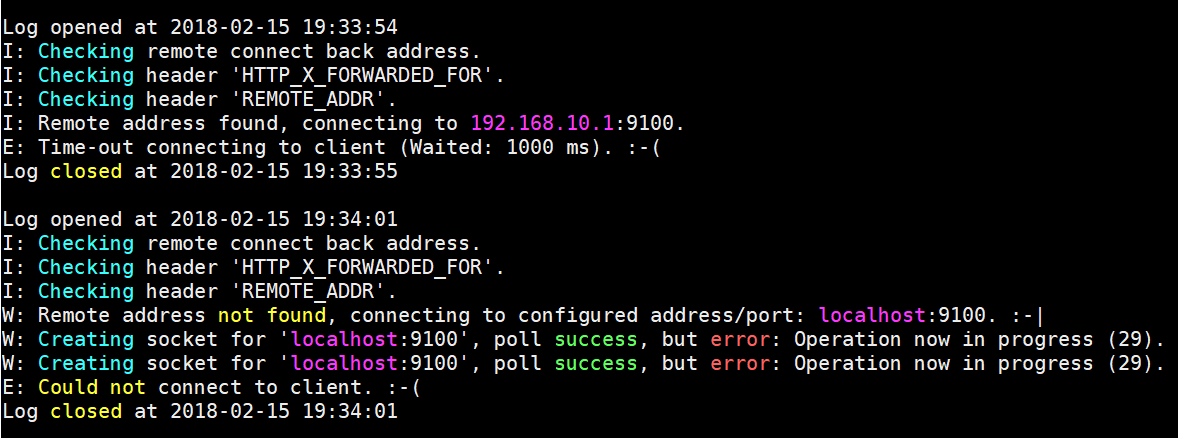
lmarcelocc
on 15 Feb 2018
Ok, found the problem!!
Windows firewal was blocking!! Just because I was working on a public network.
Thank you @salixrosa for you precious help!
lmarcelocc
on 15 Feb 2018
Yay :D Happy debugging!
On Feb 15, 2018 1:42 PM, "lmarcelocc" notifications@github.com wrote:
Ok, found the problem!!
Windows firewal was blocking!!
Thank you @salixrosa https://github.com/salixrosa for you precious help1
—
You are receiving this because you were mentioned.
Reply to this email directly, view it on GitHub
https://github.com/felixfbecker/vscode-php-debug/issues/239#issuecomment-366039509,
or mute the thread
https://github.com/notifications/unsubscribe-auth/ACp9VY5J3fUQPraxuv2JbehycCfi-0F8ks5tVIi_gaJpZM4SGBIv
.
salixrosa
on 15 Feb 2018
Not working for me after updating VS Code. VSC would not stop on any of my breakpoints, but would stop on exceptions if I checked the box for it. I tried changing my path mapping to use the path directly instead of what was working before the update ("${workspaceRoot}/") and that did not help. Reverted to 1.19.3 and VSC is now stopping on my breakpoints again.
If anyone else needs it until this is figured out.
https://vscode.cdn.azure.cn/stable/7c4205b5c6e52a53b81c69d2b2dc8a627abaa0ba/VSCodeSetup-x64-1.19.3.exe
 LostBeard
on 16 Feb 2018
LostBeard
on 16 Feb 2018
Well if it was broken for everyone because of a vscode update, it seems like this is an issue with that update. Maybe they removed ${workspaceRoot} and it is now ${workspaceFolder}?
 felixfbecker
on 16 Feb 2018
felixfbecker
on 16 Feb 2018
It doesn't work with ${workspaceFolder} either (even with absolute path). Xdebug on the server logs the communication correctly but VS Code v1.20 doesn't stop at breakpoints. It works with VS Code v1.19.
patrik-martinko
on 19 Feb 2018
But I noticed that VS Code v1.20 breaks on exceptions though.
patrik-martinko
on 19 Feb 2018
Hi all,
I've also tried with ${workspaceFolder}but no success.
Thanks.
lmarcelocc
on 19 Feb 2018
same issue for me since last vscode update
 Metrakit
on 19 Feb 2018
Metrakit
on 19 Feb 2018
@opus-2 please self-moderate your comment or I will delete it. Your attitude is extremely disrespectful.
felixfbecker
on 20 Feb 2018
Was a solution ever found for this? I just updated my vscode yesterday and I'm getting the same behavior. xDebug for PHP stops on exceptions but wont stop on any brake points. It was working yesterday before I updated, now nothing. I have a project due Monday I need to find a fix ASAP.
 AdamBassett
on 9 Mar 2018
AdamBassett
on 9 Mar 2018
@AdamBassett , go back for an older version of VS code, it's the quick fix.
lmarcelocc
on 9 Mar 2018
Ok how do I do that I cant find a download for 1.19
AdamBassett
on 9 Mar 2018
lmarcelocc
on 9 Mar 2018
Thanks now that you post that link I see is posted above. I missed it before thanks! This fixed it thank you so much!
AdamBassett
on 9 Mar 2018
Can't believe an issue like this eventually gets resolved with "use an older version"...
 rulatir
on 25 Jul 2019
rulatir
on 25 Jul 2019
@rulatir it was fixed in https://github.com/felixfbecker/vscode-php-debug/commit/26177956dee82824b7e4d3a51de9009a44e3bc14
felixfbecker
on 25 Jul 2019
Related issues
 leslieeilsel
·
7Comments
leslieeilsel
·
7Comments
 mitchellnemitz
·
11Comments
mitchellnemitz
·
11Comments
 johnbillion
·
11Comments
johnbillion
·
6Comments
johnbillion
·
11Comments
johnbillion
·
6Comments
 eghoff1
·
10Comments
eghoff1
·
10Comments