I noticed if I hit F5 to run & debug it doesn't work. What's the status and upstream work to be done for this feature?
 lukepighetti
All 59 comments
wip
 justjavac
on 12 May 2020
justjavac
on 12 May 2020
Hi, I work on the VS Code javascript debug extension. Since you're based on V8 and CDP, and there are reports of attach configs just working, it may sense to plug into our existing Javascript debugger. (Note that we're working on releasing a new debugger; I'd recommend targeting that as the standard.)
More than happy to provide pointers / brainstorm, Let me know how I can help 🙂
 connor4312
on 15 May 2020
connor4312
on 15 May 2020
Using the current node debugger on VSCode worked just fine for me.
Had to created a new launch.json with the following settings:
{
    "version": "0.2.0",
    "configurations": [
        {
            "name": "Debug Deno (Allow All)",
            "type": "node",
            "request": "launch",
            "cwd": "${workspaceFolder}",
            "runtimeExecutable": "deno",
            "runtimeArgs": [
                "run",
                "--inspect",
                "-A",
                "index.ts"
            ],
            "port": 9229
        }
    ]
}
Which tells vscode to call deno run --inspect -A ./index.ts and run the debugger on 127.0.0.1:9229.
Then running with f5, attaching breakpoints, inspecting and logging to the debug console worked like a charm:

 rodolphocastro
on 16 May 2020
rodolphocastro
on 16 May 2020
Docs for VSCode debugging: https://deno.land/manual/tools/debugger#vscode
 bartlomieju
on 16 May 2020
bartlomieju
on 16 May 2020
thanks
justjavac
on 16 May 2020
I had problems displaying to the standard output with the default configuration, console.log not showing up in the debugger's console. Just in case some of you are facing the same problem, I fixed it by adding this to the configuration:
"console": "integratedTerminal"
Not sure if this is a known bug @bartlomieju
 millsp
on 17 May 2020
millsp
on 17 May 2020
I followed the guideline using the following launch.json
{
  "version": "0.2.0",
  "configurations": [
      {
          "name": "Debug Deno (Allow All)",
          "type": "node",
          "request": "launch",
          "cwd": "${workspaceFolder}",
          "runtimeExecutable": "deno",
          "runtimeArgs": [
              "run",
              "--inspect-brk",
              "-A",
              "samplesheet.ts"
          ],
          "port": 9229,
          "console": "integratedTerminal"
      }
  ]
}
Which starts the debugger session and then immediately quits...
➜  deno_samplesheet git:(master) ✗ /usr/local/bin/deno run --inspect-brk -A samplesheet.ts
Debugger listening on ws://127.0.0.1:9229/ws/af029d1b-98ad-49a5-8a0b-1520f5a63a16
Debugger session started.
Any ideas?
 cvlvxi
on 18 May 2020
cvlvxi
on 18 May 2020
@cvlvxi Maybe your samplesheet.ts does not have a process that keeps running (happened to me😅).
 gewoonwoutje
on 18 May 2020
gewoonwoutje
on 18 May 2020
@pirix-gh If you don't like that the debug output occupies a terminal window, you can also add "outputCapture": "std" to your config instead of your console setting. It works better for me.
gewoonwoutje
on 18 May 2020
@gewoonwoutje this does not work for me, unfortunately. Not sure why, but I always had the same problem with Node.js. Could be from my environment (ubuntu).
millsp
on 18 May 2020
@gewoonwoutje thanks from the response. How can I make it so that my ts file has a process that keeps running?
cvlvxi
on 19 May 2020
@cvlvxi just see deno offical document like run a http server
import { serve } from "https://deno.land/std/http/server.ts";
const s = serve({ port: 8000 });
console.log("http://localhost:8000/");
for await (const req of s) {
    req.respond({ body: "Hello World\n" });
}
 ZenLiuCN
on 19 May 2020
ZenLiuCN
on 19 May 2020
I've following the comments here as well as on https://deno.land/manual/tools/debugger#vscode but my breakpoints are always unbounded and they will never be able to be hit when the program executes. I'm on Windows 10 using VSCode Insiders. I've even tried using the sample program and setting the breakpoint on the console.log message but it's still unbound. I'm using Deno 1.1.3. Anyone else having issues like this?
 frankhale
on 8 Jul 2020
frankhale
on 8 Jul 2020
@frankhale can you try with our new debugger? (This debugger will become the default in the VS Code release upcoming this week.) If that doesn't work, please file an issue!
connor4312
on 8 Jul 2020
Here is a screenshot of what I see when I start the debugger along with my launch.json

frankhale
on 8 Jul 2020
I think I know what's going on in my case. For the record I'm on Windows 10 and have tried VSCode (regular release) and Visual Studio Insiders (latest build from today, using nightly version of the JavaScript Debugger).
It really looks like --inspect-brk is being completely ignored when using the following launch.json. When pressing F5 the app will launch but the debugger is never started and consequently cannot attach.
{
      "name": "Deno",
      "type": "node",
      "request": "launch",
      "cwd": "${workspaceFolder}",
      "runtimeExecutable": "deno",
      "runtimeArgs": ["run", "--inspect-brk", "-A", "${file}"],
      "port": 9229
}
If I run my app from the terminal using: deno run --inspect-brk -A main.ts and then use a configuration in my launch.json to just attach to the debugger then everything works as expected:
{
      "name": "Deno (Attach)",
      "type": "node",
      "request": "attach",
      "port": 9229
}
@connor4312 I am using the brand new code-1.47.0 with the new debugger and get the same results as @frankhale . I can't set a breakpoint and run the Deno config. It starts the debugger but nothing is happening, the breakpoint is 'unbound'. I can run the attach and it starts debugging but on the .ts imports it says unable to retrieve source content
I am running Centos 8.2 Linux.


 David-Else
on 10 Jul 2020
David-Else
on 10 Jul 2020
@David-Else correct I see those same results but I'd like to mention that when it says "Unable to retrieve source content." you can click the debugger continue button and it will resume execution of your app and if you have breakpoints you should be able to hit them. This is the work around I'm using currently.
I'd also like to thank you for providing another example of the behavior. I am thinking that the bug is happening with the launch.json profile for launching deno and attaching with just an F5 press and I think it has something to do with the runtimeArgs property "runtimeArgs": ["run", "--inspect-brk", "-A", "${file}"]. When I press F5 it seems to be completely skipping --inspect-brk and the debugger user interface in Visual Studio Code is just stuck in a state where it's waiting but it's never going to start. Here is why I came to that conclusion.

frankhale
on 10 Jul 2020
@frankhale Cheers! Also, it won't work with -- in front of any argument, try "inspect-brk" and it accepts it! What is going on? That has to be a VS Code parsing bug?
David-Else
on 10 Jul 2020
What is going on?
It's related to how the new debugger works -- it actually includes a "bootloader" file to set up debugging. This has many advantages, but is incompatible with --inspect-brk: that would cause Node to break in our bootloader, at which point VS Code will not have been told that there's something to debug! If the new debugger sees --inspect-brk, it filters it out and instead manually sets a breakpoint on the first line of _user_ code that would be run.
Deno somewhat predictably (but I wanted to check) doesn't read from the NODE_OPTIONS environment variable that we leverage to inject the bootloader, so something else will need to be done there. I will introduce some compatibility logic into js-debug within the coming days.
connor4312
on 10 Jul 2020
@connor4312 I have deleted the line and now and it still does not work. Can this config be made compatible?
    {
      "name": "Deno",
      "type": "node",
      "request": "launch",
      "cwd": "${workspaceFolder}",
      "runtimeExecutable": "deno",
      "runtimeArgs": ["run", "-A", "${file}"],
      "port": 9229
    },
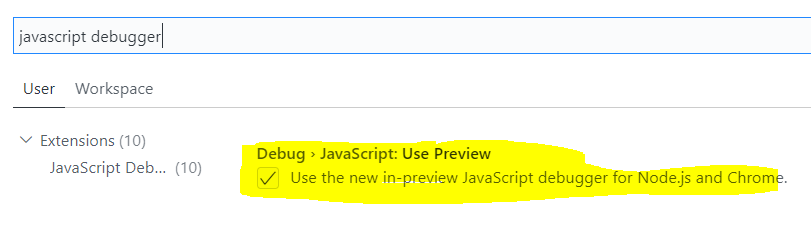
Given you're on 1.47 where the new debugger is now the default, you have a couple options until this capability is unlocked in js-debug:
- Set
debug.javascript.usePreviewtofalsein your user settings to use the old debugger for now Make it a task instead and attach to it:
launch.json
{
  "version": "0.2.0",
  "configurations": [
    {
      "type": "node",
      "name": "Launch Program",
      "request": "attach",
      "port": 9229,
      "preLaunchTask": "run my program" // this will run the program task before debugging
    },
}
tasks.json
{
  "version": "2.0.0",
  "tasks": [
    {
      "label": "run my program",
      "type": "shell",
      "command": "deno run --inspect-brk greet.js", // your program args
      "isBackground": true // don't wait for the task to end before debugging
      "problemMatcher": { // tells vscode to wait for this line before debugging
        "background": {
          "activeOnStart": true,
          "beginsPattern": "Debugger listening"
        }
      },
    }
  ]
}
connor4312
on 10 Jul 2020
@connor4312 Thanks for the additional help, but I get the following error with your task:
Error: the description can't be converted into a problem matcher:
{
    "background": {
        "activeOnStart": true,
        "beginsPattern": "Debugger listening"
    }
}
Deno runs OK:
> Executing task: deno run --inspect-brk -A mod.ts <

Debugger listening on ws://127.0.0.1:9229/ws/89e852ba-3c5e-4db7-8da7-aed56cab359a
And here is the exact code I copied from yours, just changing the file name and adding -A for deno permissions:
{
  "version": "2.0.0",
  "tasks": [
    {
      "label": "run my program",
      "type": "shell",
      "command": "deno run --inspect-brk -A mod.ts", // your program args
      "isBackground": true, // don't wait for the task to end before debugging
      "problemMatcher": {
        // tells vscode to wait for this line before debugging
        "background": {
          "activeOnStart": true,
          "beginsPattern": "Debugger listening"
        }
      }
    }
  ]
}
@David-Else did you try just the first option? That worked for me
Set debug.javascript.usePreview to false in your user settings to use the old debugger for now
 brandonkal
on 12 Jul 2020
brandonkal
on 12 Jul 2020
@brandonkal It works!!! Finally after all this time I can now debug deno, thanks!
(note: just use official settings https://deno.land/manual/tools/debugger#vscode and the old debugger in VS Code 1.47)
David-Else
on 12 Jul 2020
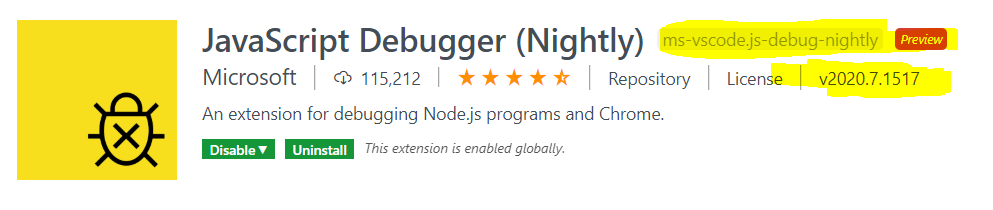
Hi all, I've added 'official' support for this in js-debug now. See https://github.com/microsoft/vscode-js-debug/commit/540fbcace9eda0c43fa0b73797d3cba95a2f443b for details and reasoning, the tl;dr is that (if you'd like to continue using the new debugger, which I'd encourage 🙂 ) you need to do two things:
- Grab the nightly js-debug extension (will be available shortly after 5PM PST today)
- Change the
portproperty in your launch.json toattachSimplePortand type topwa-node(to go directly to our new debugger and get the new config option)
Update: following a separate issue, I've also added the ability to set
attachSimplePort: 0. If you do this, js-debug will pick a random free port on your machine and append the appropriate --inspect-brk flag to theruntimeArgumentsautomatically. Less configuration for you 🙂
Then it should work. This change will land in the next VS Code stable release, at which point you will no longer need to be on the nightly extension build. I will PR to the deno docs to update this)
connor4312
on 15 Jul 2020
@connor4312
deno version 1.2.0
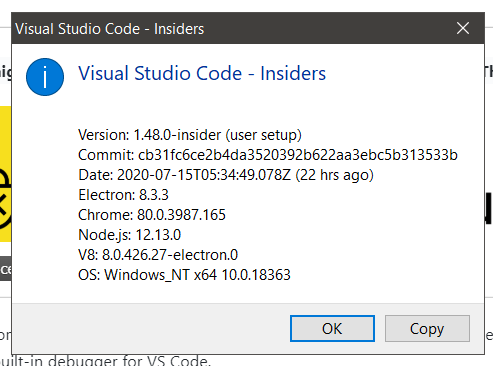
This is what I'm seeing when debugging a hello,world with the latest changes. Am I doing something wrong?:

Here is my launch.json:
{
      "name": "Deno",
      "type": "pwa-node",
      "request": "launch",
      "cwd": "${workspaceFolder}",
      "runtimeExecutable": "deno",
      "runtimeArgs": ["run", "--inspect-brk", "-A", "${file}"],
      "attachSimplePort": 9229
}
frankhale
on 16 Jul 2020
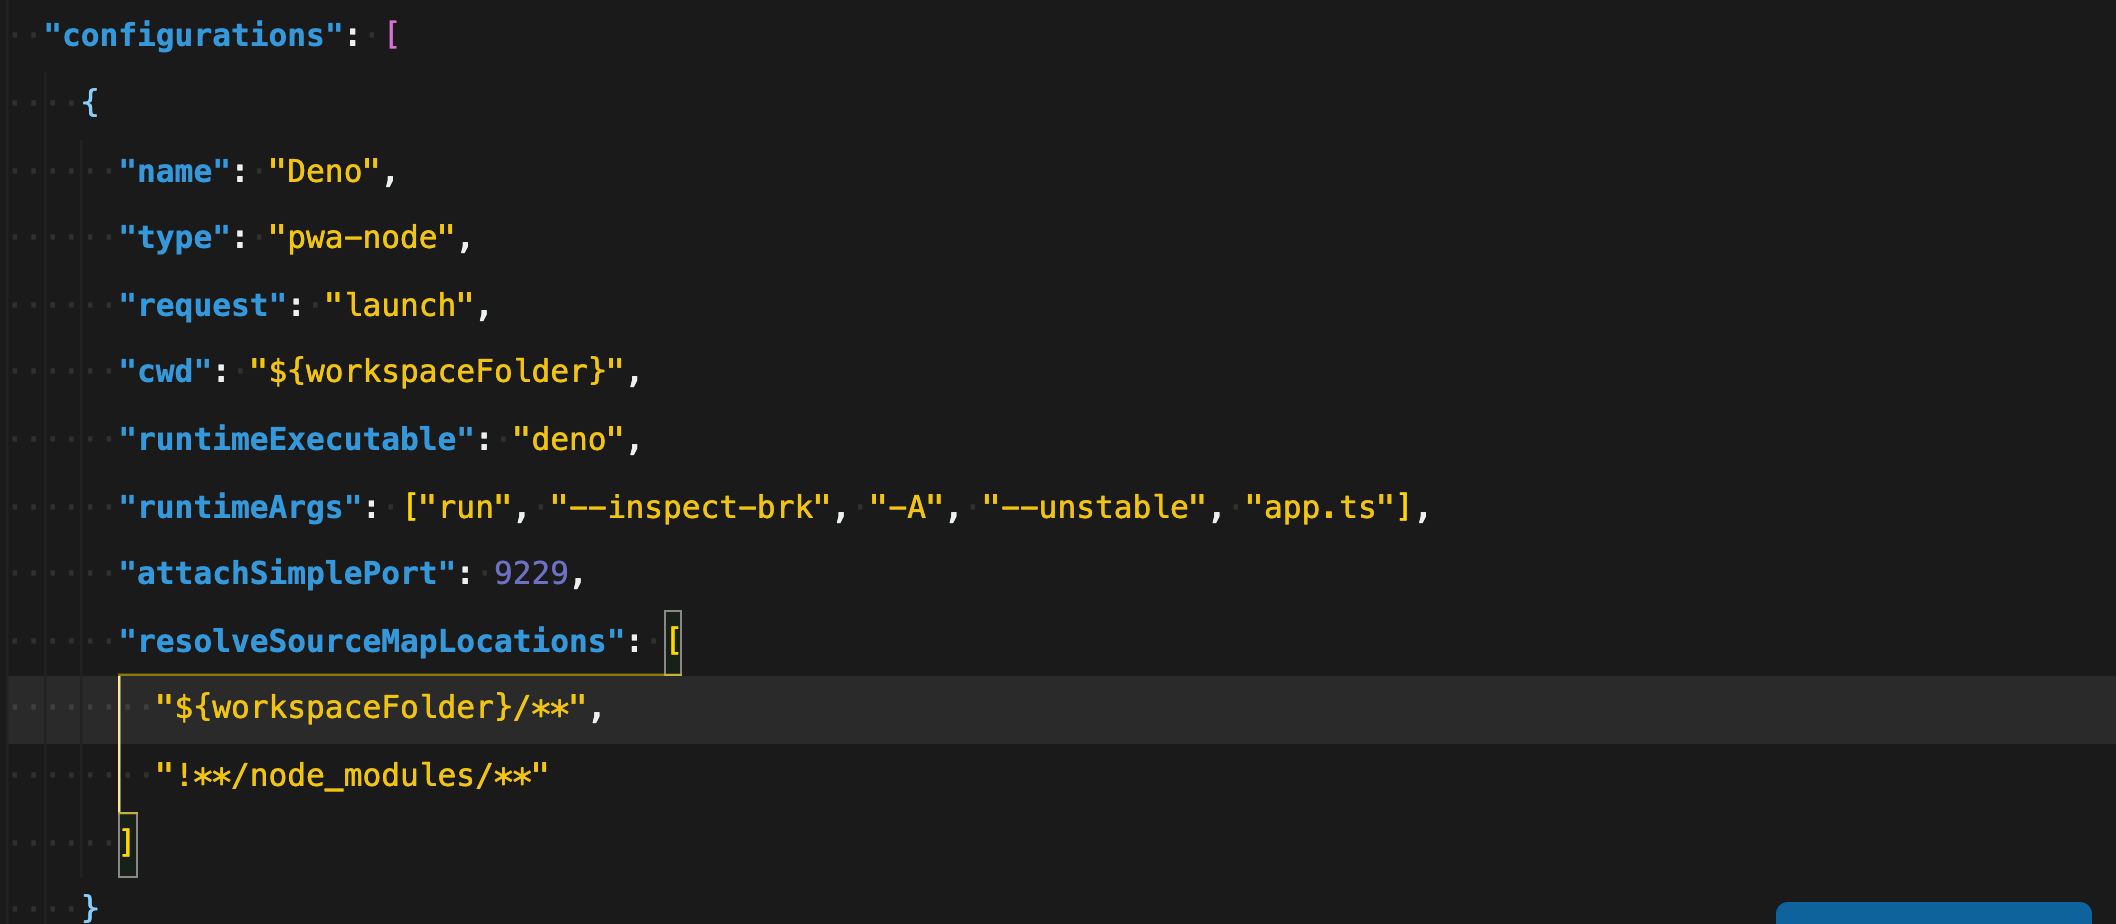
No, you aren't. We'll print warnings if soruce maps fail to load. You can narrow resolveSourceMapLocations if you don't care about that file, for example this setting will only resolve sourcemaps in your workspace folder.
"resolveSourceMapLocations": [
    "${workspaceFolder}/**",
    "!**/node_modules/**"
],
@connor4312 you rock! It's working great now that I added that. Thank you for that quick response.
frankhale
on 16 Jul 2020
Why do programs get stuck after I use the inspectbrk command
 ToWeLong
on 16 Jul 2020
ToWeLong
on 16 Jul 2020
@ToWeLong Did you mean to upload a .png file? It didn't work, it is just a link to this thread.
David-Else
on 16 Jul 2020
@ToWeLong Did you mean to upload a
.pngfile? It didn't work, it is just a link to this thread.
sorry upload error

ToWeLong
on 16 Jul 2020
@connor4312
did i do something wrong?

somehow it worked well once or twice, but it didn't work most of the time.
and my deno version is 1.2.0
vscode version is 1.47.1
 warwr1ck
on 16 Jul 2020
warwr1ck
on 16 Jul 2020
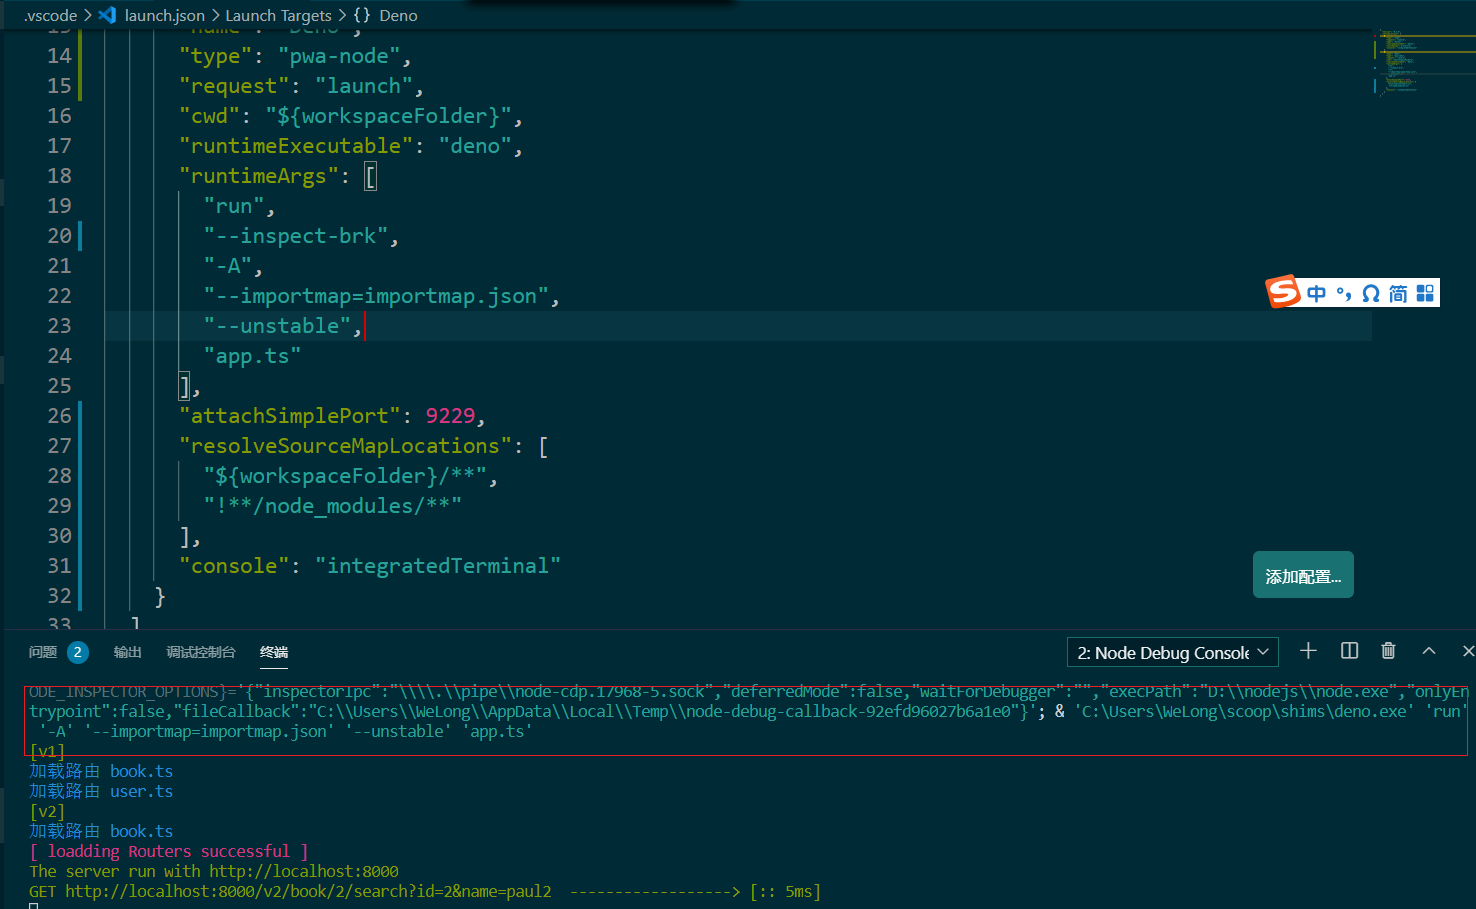
@connor4312
did i do something wrong?
somehow it worked well once or twice, but it didn't work most of the time.and my deno version is 1.2.0
vscode version is 1.47.1
I try to use your configurations,but vscode lost inspect-brk argument
ToWeLong
on 16 Jul 2020
@ToWeLong / @warwr1ck apologies, fixed in https://github.com/microsoft/vscode-js-debug/commit/d509690a64c9688b4c75b8da8d77ad5730c37692. Will be in _today's_ nightly.
connor4312
on 16 Jul 2020
@ToWeLong / @warwr1ck apologies, fixed in microsoft/vscode-js-debug@d509690. Will be in _today's_ nightly.
recently, I receive a version update,VSCode1.47.2 ,but do not resolve my problems
ToWeLong
on 17 Jul 2020
You will need to use the nightly build version 2020.7.1611 or above
connor4312
on 17 Jul 2020
You will need to use the nightly build version 2020.7.1611 or above
debugger success ,but it do not auto attach breakpoint ,Even if I used auto hit
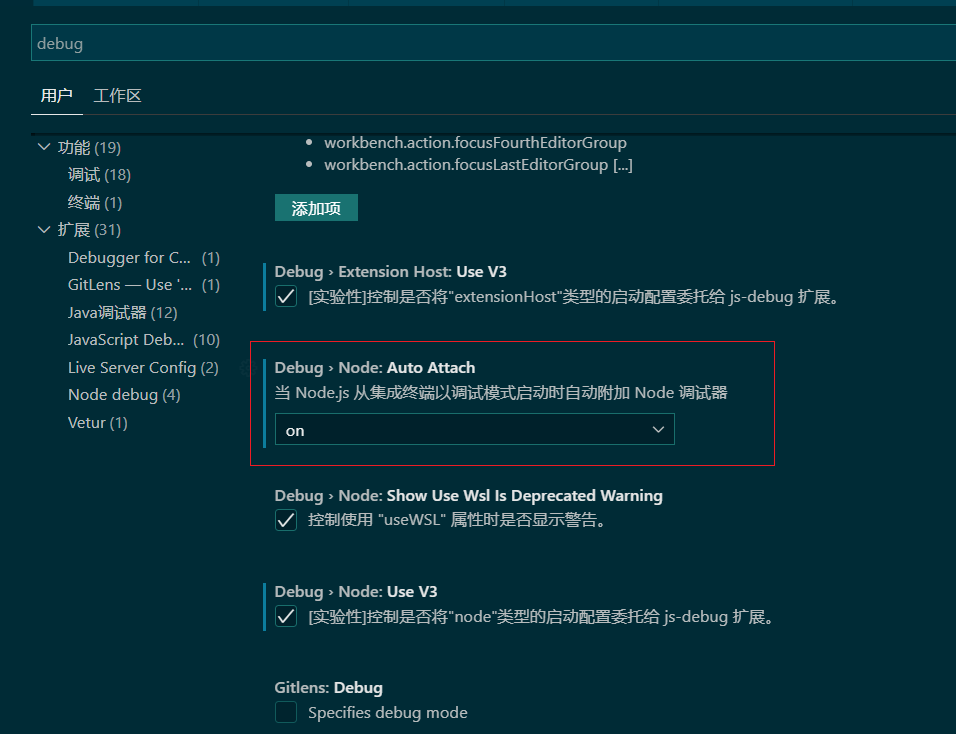
I need to manually turn on hits myself

ToWeLong
on 17 Jul 2020
I'm have Deno running on Ubuntu with latest version of Visual Studio Code - Insiders with JavaScript Debugger (Nightly) Version: 2020.7.1717 running on Ubuntu 20.04 LTS running inside WSL-2. With the above launch.json I am able to launch & debug my simple REST api. I'm using Oak and in the POST handler below the value of the body is a promise with state 'pending' despite the await. Any suggestion as to what the problem is or best way to debug this?
export const addDog = async ({
request,
response,
}: {
request: any;
response: any;
}) => {
const body = await request.body();
const dog: Dog = body.value;
dogs.push(dog);
console.log(Adding ${dog.name});
response.body = { msg: "OK" };
response.status = 200;
};
Also if I restart the debug session I get the error:
/home/mwoodpatrick/.deno/bin/deno run --inspect-brk -A /mnt/c/Users/mlwp/projects/deno/api.ts
Debugger listening on ws://127.0.0.1:9229/ws/f3688378-63d8-4d5f-b7f2-ddc24719dfb0
[38;5;10mCheck file:///mnt/c/Users/mlwp/projects/deno/api.ts
Debugger session started.
thread 'main' panicked at 'already borrowed: BorrowMutError', /rustc/49cae55760da0a43428eba73abcb659bb70cf2e4/src/libcore/cell.rs:878:9
note: run with `RUST_BACKTRACE=1` environment variable to display a backtrace
fatal runtime error: failed to initiate panic, error 5
Any suggestions on how to debug
 mwoodpatrick
on 18 Jul 2020
mwoodpatrick
on 18 Jul 2020
I'm have Deno running on Ubuntu with latest version of Visual Studio Code - Insiders with JavaScript Debugger (Nightly) Version: 2020.7.1717 running on Ubuntu 20.04 LTS running inside WSL-2. With the above launch.json I am able to launch & debug my simple REST api. I'm using Oak and in the POST handler below the value of the body is a promise with state 'pending' despite the await. Any suggestion as to what the problem is or best way to debug this?
export const addDog = async ({
request,
response,
}: {
request: any;
response: any;
}) => {
const body = await request.body();
const dog: Dog = body.value;
dogs.push(dog);console.log(
Adding ${dog.name});response.body = { msg: "OK" };
response.status = 200;
};Also if I restart the debug session I get the error:
/home/mwoodpatrick/.deno/bin/deno run --inspect-brk -A /mnt/c/Users/mlwp/projects/deno/api.ts
Debugger listening on ws://127.0.0.1:9229/ws/f3688378-63d8-4d5f-b7f2-ddc24719dfb0
�[38;5;10mCheck file:///mnt/c/Users/mlwp/projects/deno/api.ts
Debugger session started.
thread 'main' panicked at 'already borrowed: BorrowMutError', /rustc/49cae55760da0a43428eba73abcb659bb70cf2e4/src/libcore/cell.rs:878:9
note: run with `RUST_BACKTRACE=1` environment variable to display a backtrace
fatal runtime error: failed to initiate panic, error 5
Any suggestions on how to debug
you can see my repository,deno_server
ToWeLong
on 19 Jul 2020
I'm have Deno running on Ubuntu with latest version of Visual Studio Code - Insiders with JavaScript Debugger (Nightly) Version: 2020.7.1717 running on Ubuntu 20.04 LTS running inside WSL-2. With the above launch.json I am able to launch & debug my simple REST api. I'm using Oak and in the POST handler below the value of the body is a promise with state 'pending' despite the await. Any suggestion as to what the problem is or best way to debug this?
export const addDog = async ({
request,
response,
}: {
request: any;
response: any;
}) => {
const body = await request.body();
const dog: Dog = body.value;
dogs.push(dog);
console.log(Adding ${dog.name});
response.body = { msg: "OK" };
response.status = 200;
};
Also if I restart the debug session I get the error:/home/mwoodpatrick/.deno/bin/deno run --inspect-brk -A /mnt/c/Users/mlwp/projects/deno/api.ts Debugger listening on ws://127.0.0.1:9229/ws/f3688378-63d8-4d5f-b7f2-ddc24719dfb0 �[38;5;10mCheck file:///mnt/c/Users/mlwp/projects/deno/api.ts Debugger session started. thread 'main' panicked at 'already borrowed: BorrowMutError', /rustc/49cae55760da0a43428eba73abcb659bb70cf2e4/src/libcore/cell.rs:878:9 note: run with `RUST_BACKTRACE=1` environment variable to display a backtrace fatal runtime error: failed to initiate panic, error 5Any suggestions on how to debug
you can see my repository,deno_server
ToWeLong
on 19 Jul 2020
Your server does not do any put REST commands which is where I was seeing
the problem. I forked your repository and created:
mret
https://github.com/mwoodpatrick/deno-server
There is a v3 controller which has a post endpoint to add another dog the
promise I get from the post is not resolved for me. Can you get post
requests to work for you?
On Sat, Jul 18, 2020 at 7:19 PM ToWeLong notifications@github.com wrote:
I'm have Deno running on Ubuntu with latest version of Visual Studio Code
- Insiders with JavaScript Debugger (Nightly) Version: 2020.7.1717 running
on Ubuntu 20.04 LTS running inside WSL-2. With the above launch.json I am
able to launch & debug my simple REST api. I'm using Oak and in the POST
handler below the value of the body is a promise with state 'pending'
despite the await. Any suggestion as to what the problem is or best way to
debug this?
export const addDog = async ({
request,
response,
}: {
request: any;
response: any;
}) => {
const body = await request.body();
const dog: Dog = body.value;
dogs.push(dog);
console.log(Adding ${dog.name});
response.body = { msg: "OK" };
response.status = 200;
};
Also if I restart the debug session I get the error:/home/mwoodpatrick/.deno/bin/deno run --inspect-brk -A /mnt/c/Users/mlwp/projects/deno/api.ts
Debugger listening on ws://127.0.0.1:9229/ws/f3688378-63d8-4d5f-b7f2-ddc24719dfb0
�[38;5;10mCheck file:///mnt/c/Users/mlwp/projects/deno/api.ts
Debugger session started.
thread 'main' panicked at 'already borrowed: BorrowMutError', /rustc/49cae55760da0a43428eba73abcb659bb70cf2e4/src/libcore/cell.rs:878:9
note: run with
RUST_BACKTRACE=1environment variable to display a backtracefatal runtime error: failed to initiate panic, error 5
Any suggestions on how to debug
you can see my repository,deno_server
ToWeLong/deno-server https://github.com/ToWeLong/deno-server
—
You are receiving this because you commented.
Reply to this email directly, view it on GitHub
https://github.com/denoland/vscode_deno/issues/12#issuecomment-660573999,
or unsubscribe
https://github.com/notifications/unsubscribe-auth/AAQ6SQUT3OL7RMNTZF2JT2TR4JJZPANCNFSM4M62RWTQ
.
--
Mark Wood-Patrick
mwoodpatrick
on 21 Jul 2020
Your server does not do any put REST commands which is where I was seeing the problem. I forked your repository and created: mret https://github.com/mwoodpatrick/deno-server There is a v3 controller which has a post endpoint to add another dog the promise I get from the post is not resolved for me. Can you get post requests to work for you?
…
On Sat, Jul 18, 2020 at 7:19 PM ToWeLong @.*> wrote: I'm have Deno running on Ubuntu with latest version of Visual Studio Code - Insiders with JavaScript Debugger (Nightly) Version: 2020.7.1717 running on Ubuntu 20.04 LTS running inside WSL-2. With the above launch.json I am able to launch & debug my simple REST api. I'm using Oak and in the POST handler below the value of the body is a promise with state 'pending' despite the await. Any suggestion as to what the problem is or best way to debug this? export const addDog = async ({ request, response, }: { request: any; response: any; }) => { const body = await request.body(); const dog: Dog = body.value; dogs.push(dog); console.log(Adding ${dog.name}); response.body = { msg: "OK" }; response.status = 200; }; Also if I restart the debug session I get the error: /home/mwoodpatrick/.deno/bin/deno run --inspect-brk -A /mnt/c/Users/mlwp/projects/deno/api.ts Debugger listening on ws://127.0.0.1:9229/ws/f3688378-63d8-4d5f-b7f2-ddc24719dfb0 �[38;5;10mCheck file:///mnt/c/Users/mlwp/projects/deno/api.ts Debugger session started. thread 'main' panicked at 'already borrowed: BorrowMutError', /rustc/49cae55760da0a43428eba73abcb659bb70cf2e4/src/libcore/cell.rs:878:9 note: run withRUST_BACKTRACE=1environment variable to display a backtrace fatal runtime error: failed to initiate panic, error 5 Any suggestions on how to debug you can see my repository,deno_server ToWeLong/deno-server https://github.com/ToWeLong/deno-server — You are receiving this because you commented. Reply to this email directly, view it on GitHub <#12 (comment)>, or unsubscribe https://github.com/notifications/unsubscribe-auth/AAQ6SQUT3OL7RMNTZF2JT2TR4JJZPANCNFSM4M62RWTQ .
-- Mark Wood-Patrick
POST:

PUT:

Whether it is a post or put request, I can receive the information in the body
ToWeLong
on 21 Jul 2020
I'm having a problem stepping into library code e.g. Oak next function vscode tells me "Unable to retrieve source contents" also I'm seeing a problem going to source code definitions. vscode displays the IntelliSense but when I select got definition vscode reports it can't find the definition of function (e.g. validateJwt).
I'm using deno 1.2.0.
Library is imported in a deps.ts file:
export { makeJwt } from "https://deno.land/x/[email protected]/create.ts";
export {
validateJwt,
Jose,
Payload,
} from "https://deno.land/x/[email protected]/validate.ts";
Then included into the code using
import { Status, validateJwt } from "../deps.ts";
Any suggestions as to what the issue is or best way to debug.
see:
https://discordapp.com/channels/684898665143206084/689420767620104201/739903606978904196
mwoodpatrick
on 3 Aug 2020
@connor4312
I installed nightly js-debug, and change debug config to
{
    "type": "pwa-node",
    "request": "launch",
    "name": "Deno",
    "runtimeExecutable": "deno",
    "runtimeArgs": ["run", "-A", "index.ts"],
    "cwd": "${workspaceFolder}/leetcode/ts",
    "outputCapture": "std",
    "attachSimplePort": 0
  },
and then got error:
[Window Title]
Visual Studio Code

[Content]
Error processing launch: Error: Could not connect to debug target at http://127.0.0.1:44740: Promise was canceled
    at Object.e [as retryGetWSEndpoint] (c:\Users\xxx\.vscode\extensions\ms-vscode.js-debug-nightly-2020.8.517\src\extension.js:1:92977)
    at processTicksAndRejections (internal/process/task_queues.js:85:5)

[Open launch.json] [Cancel]
But if I change attachSimplePort from 0 to 9229, and add --inspect-brk to runtimeArgs, it will run well.
 yubaoquan
on 6 Aug 2020
yubaoquan
on 6 Aug 2020
I successfully used code-insiders to debug Deno.
It probably should also work with the just released 1.48.
I use a config like this:
{
// Use IntelliSense to learn about possible attributes.
// Hover to view descriptions of existing attributes.
// For more information, visit: https://go.microsoft.com/fwlink/?linkid=830387
"version": "0.2.0",
"configurations": [
{
"name": "Deno Debug Example",
"type": "pwa-node",
"request": "launch",
"cwd": "./scripts",
"runtimeExecutable": "deno",
"runtimeArgs": ["run", "--inspect-brk", "-A", "--unstable", "--importmap", "import_map.json", "debug.ts"],
"attachSimplePort": 9229
}
]
}
 newtack
on 15 Aug 2020
newtack
on 15 Aug 2020
Whenever I debug a project now, a file _constants.ts is opened in VS code with following content:
Could not load source 'proj/[email protected]/path/https:/deno.land/[email protected]/path/_constants.ts': Unable to retrieve source content.
I can close that file and resume debugging, though it gets cumbersome. The .js file to be debugged contains:
import * as path from "https://deno.land/[email protected]/path/mod.ts";
// ...
launch.json debug config:
    {
      "name": "Deno",
      "type": "pwa-node",
      "request": "launch",
      "cwd": "${workspaceFolder}",
      "runtimeExecutable": "deno",
      "runtimeArgs": [
        "run",
        "--inspect-brk",
        "-A",
        "main.js"
      ],
      "outputCapture": "std",
      "attachSimplePort": 9229,
    }
Also tried resolveSourceMapLocations without success.
"resolveSourceMapLocations": [ "${workspaceFolder}/**", "!**/node_modules/**" ]
Does anybody experience similar issues? What could be the cause? (VS Code 1.48, vs-deno 2.0.15)
 bela53
on 28 Aug 2020
bela53
on 28 Aug 2020
I got this up and running witout big issues, but pretty new to vscode debugger, so my question might be dumb =): Is it somehow possible to interact with the running code trough the debugger? E.g. is it somehow possible to inspect a variable at runtime with console.log(yourvar) somehow? like an interactive mode? And I don't want to set a breakpoint, the program should just continue to run but when I "wish" I'd like to inspect some stuff...
 kryptish
on 20 Sep 2020
kryptish
on 20 Sep 2020
@kryptish you might like logpoints https://code.visualstudio.com/docs/editor/debugging#_logpoints
connor4312
on 20 Sep 2020
If I change --inspect-brk to --inspect, vscode will report an error. It is an error? @connor4312
[Window Title]
Visual Studio Code

[Content]
Error processing launch: Error: Could not connect to debug target at http://127.0.0.1:9229: Promise was canceled
    at Object.e [as retryGetWSEndpoint] (c:\Users\111\.vscode\extensions\ms-vscode.js-debug-nightly-2020.9.1917\src\extension.js:15:2455839)
    at processTicksAndRejections (internal/process/task_queues.js:94:5)
    at t (c:\Users\111\.vscode\extensions\ms-vscode.js-debug-nightly-2020.9.1917\src\extension.js:73:54237)
    at S.launch (c:\Users\111\.vscode\extensions\ms-vscode.js-debug-nightly-2020.9.1917\src\extension.js:15:2477504)
    at t.Binder.captureLaunch (c:\Users\111\.vscode\extensions\ms-vscode.js-debug-nightly-2020.9.1917\src\extension.js:73:115308)
    at t.Binder._launch (c:\Users\111\.vscode\extensions\ms-vscode.js-debug-nightly-2020.9.1917\src\extension.js:73:114859)
    at async Promise.all (index 3)
    at t.Binder._boot (c:\Users\111\.vscode\extensions\ms-vscode.js-debug-nightly-2020.9.1917\src\extension.js:73:114119)
    at t.default._onMessage (c:\Users\111\.vscode\extensions\ms-vscode.js-debug-nightly-2020.9.1917\src\extension.js:15:2463780)

[Open launch.json] [Cancel]
It means your program is not listening on that port, or if it is we couldn't connect to it.
connor4312
on 21 Sep 2020
It means your program is not listening on that port, or if it is we couldn't connect to it.
So the conclusion is if change --inspect-brk to --inspect, then debug extension will not be able to connect to the port?
Is it because deno ignores the '--inspect' or some other bug in debug extension?
@connor4312
yubaoquan
on 22 Sep 2020
How to set ENV="development" for debugging?
 YuriyTigiev
on 27 Oct 2020
YuriyTigiev
on 27 Oct 2020
@YuriyTigiev There are env and envFile config entries in launch.json under configurations, which can be used to set environment variables.
 ford04
on 27 Oct 2020
ford04
on 27 Oct 2020


vs code can not debug deno
 TinyZzh
on 28 Oct 2020
TinyZzh
on 28 Oct 2020
@bela53 I am experiencing a very similar message:
Could not load source '/path/to/workspace/[email protected]/_util/os.ts': Unable to retrieve source content.
_☝️ This is always a reference to a remote module._
And I get a VS Code notification in the bottom right that reads:
This is a missing file path referenced by a sourcemap. Would you like to debug the compiled version instead?
with the options
- Always
- Always in this Workspace
- No
- Yes
It seems that I can just click the Continue button (looks like a play button or triangle) and the debug will continue to my first breakpoint successfully.
If it's helpful, this is my launch.json:
{
  // Use IntelliSense to learn about possible attributes.
  // Hover to view descriptions of existing attributes.
  // For more information, visit: https://go.microsoft.com/fwlink/?linkid=830387
  "version": "0.2.0",
  "configurations": [
    {
      "name": "Launch Deno",
      "request": "launch",
      "type": "pwa-node",
      "program": "${file}",
      "cwd": "${workspaceFolder}",
      "runtimeExecutable": "deno",
      "runtimeArgs": [
        "run",
        "--inspect-brk",
        "--allow-all"
      ],
      "attachSimplePort": 9229
    }
  ]
}
I'm not sure what is causing this problem.
@bartlomieju Do you have any insight?
 jsejcksn
on 3 Dec 2020
jsejcksn
on 3 Dec 2020
I just set up debugging with deno in VS Code and in general it works well but when I want it to output everything to the console I always get an error message "The terminal process terminated with exit code: 1".
At first glance the issue seems to be that deno is exiting too quickly. If I try it with node it outputs "Waiting for the debugger to disconnect..." after the program terminated and only exits when I end the debugging but deno closes immediately. When I then press terminate in the debugging interface I get the aforementioned error.
Here's the configuration I am using:
{
      "name": "Deno: Debug",
      "request": "launch",
      "type": "pwa-node",
      "program": "${file}",
      "cwd": "${fileDirname}",
      "runtimeExecutable": "deno",
      "runtimeArgs": ["run", "--unstable", "--inspect-brk", "--allow-all"],
      "console": "integratedTerminal"    // <--- This is the problematic line
}
 benediktwerner
on 19 Dec 2020
benediktwerner
on 19 Dec 2020
It looks like a debugger regression was introduced in v1.6.2. I can debug from VS Code fine with v1.6.1 and earlier using a configuration like this:
{
  "version": "0.2.0",
  "configurations": [
    {
      "name": "Debug Deno",
      "type": "pwa-node",
      "request": "launch",
      "cwd": "${workspaceFolder}",
      "runtimeExecutable": "deno",
      "program": "${file}",
      "runtimeArgs": [
        "run",
        "--inspect-brk",
        "--allow-all"
      ],
      "outputCapture": "std",
      "attachSimplePort": 9229
    }
  ]
}
However, upgrading to v1.6.2 results in this error when trying to connect the debugger:
Error processing launch: Error: Could not connect to debug target at http://127.0.0.1:9229: Promise was canceled
A temporary fix is to just roll back to the last working version:
deno upgrade --version 1.6.1
 drcallaway
on 23 Dec 2020
drcallaway
on 23 Dec 2020
@drcallaway Could you open an issue on the denoland/deno repo?
 lucacasonato
on 23 Dec 2020
lucacasonato
on 23 Dec 2020
Related issues
 taigah
·
3Comments
justjavac
·
4Comments
taigah
·
3Comments
justjavac
·
4Comments
 heroboy
·
10Comments
heroboy
·
10Comments
 promethyttrium
·
10Comments
promethyttrium
·
10Comments
 justdayan
·
7Comments
justdayan
·
7Comments
Most helpful comment
wip