Hello,
Let's assume the following code :
const xMax = 600
const x = d => d.date

const data = Array(12).fill(1).map((d, i) => ({
  date: +new Date(Date.now() - (i * 3600000)),
  value: Math.round(Math.max(250, Math.random() * 3000)),
}))

const xScale = scaleTime({
  range: [0, xMax],
  domain: extent(data, x),
})

console.log(xScale.ticks()) // array with 11 items
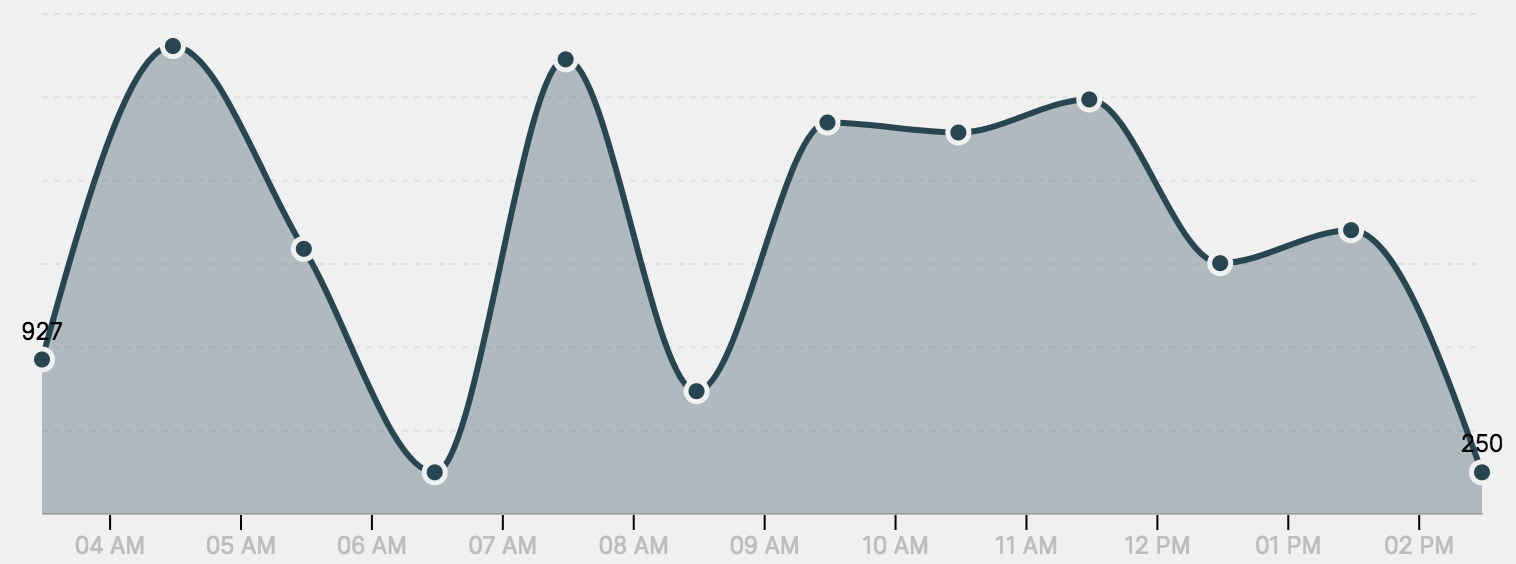
The data array is filled with 12 items, but the function "ticks()" return 11 items. Why is that ?
When I use the xScale with a shape (e.g : LinePath), it works well. But when I use an Axis (that uses the ticks() function), it doesn't work as expected.
 DarKDinDoN
All 4 comments
Ok, maybe I did not read the documentation carefully enough 😃
Ticks are approximate.
I would like to display the ticks with at least the very first and the last one. Is it possible ?
Thanks
DarKDinDoN
on 16 Mar 2018
Hi @DarKDinDoN, here's an example of rendering custom axis ticks with <AxisBottom /> https://codesandbox.io/s/rrkq83p9x4. hope it helps!
You might also want to try adding nice: true
const xScale = scaleTime({
  range: [0, xMax],
  domain: extent(data, x),
  nice: true
})
docs: https://github.com/d3/d3-scale#continuous_nice

      <AxisBottom
        top={height - margin.bottom}
        left={margin.left}
        scale={xScale}
        numTicks={numTicksForWidth(width)}
        label="time"
      >
        {props => {
          const tickLabelSize = 10;
          const tickColor = "black";
          const axisCenter = (props.axisToPoint.x - props.axisFromPoint.x) / 2;
          return (
            <g className="my-custom-bottom-axis" fontFamily="arial">
              {/* start */}
              <Line
                from={{ x: 0, y: 0 }}
                to={{ x: 0, y: 8 }}
                stroke={tickColor}
              />
              <text
                transform={`translate(${0}, 18)`}
                fontSize={tickLabelSize}
                textAnchor="start"
                fill={tickColor}
              >
                {formatTime(x(data[0]))}
              </text>

              {/* middle */}
              <Line
                from={{ x: axisCenter, y: 0 }}
                to={{ x: axisCenter, y: 8 }}
                stroke={tickColor}
              />
              <text
                transform={`translate(${axisCenter}, 18)`}
                fontSize={tickLabelSize}
                textAnchor="middle"
                fill={tickColor}
              >
                {formatTime(xScale.invert(axisCenter))}
              </text>

              {/* end */}
              <Line
                from={{ x: xMax, y: 0 }}
                to={{ x: xMax, y: 8 }}
                stroke={tickColor}
              />
              <text
                transform={`translate(${xMax}, 18)`}
                fontSize={tickLabelSize}
                textAnchor="end"
                fill={tickColor}
              >
                {formatTime(x(data[data.length - 1]))}
              </text>

              {/* axis label */}
              <text
                textAnchor="middle"
                transform={`translate(${axisCenter}, 50)`}
                fontSize="12"
              >
                {props.label}
              </text>
            </g>
          );
        }}
      </AxisBottom>
 hshoff
on 16 Mar 2018
hshoff
on 16 Mar 2018
@DarKDinDoN another option if you don't want to define your entire Axis component is to pass an array of tickValues to <Axis* />, which is _not_ approximate and will override the those from scale.ticks().
e.g., const tickValues = data.map(d => d.date) for each data point, or const tickValues = data.filter((d, i) => i === 0 || i === data.length - 1) for just the start + end.
 williaster
on 16 Mar 2018
williaster
on 16 Mar 2018
Thank you ! 😄
DarKDinDoN
on 17 Mar 2018
Related issues
 EfosaSO
·
4Comments
EfosaSO
·
4Comments
 stefanvermaas
·
3Comments
stefanvermaas
·
3Comments
 danielprogramic
·
3Comments
danielprogramic
·
3Comments
 elisechant
·
3Comments
elisechant
·
3Comments
 m0t0r
·
3Comments
m0t0r
·
3Comments
Most helpful comment
@DarKDinDoN another option if you don't want to define your entire
Axiscomponent is to pass an array oftickValuesto<Axis* />, which is _not_ approximate and will override the those fromscale.ticks().e.g.,
const tickValues = data.map(d => d.date)for each data point, orconst tickValues = data.filter((d, i) => i === 0 || i === data.length - 1)for just the start + end.