Visx: Adding a simple tooltip to a bar chart
Hi all,
I've been trying to add a simple tooltip on the bar graph. But I can't get it to work and reading through the docs and code didn't help me either.
What I want is a tooltip that aligns to the right side of a bar (with some extra padding). And it doesn't matter where you exactly enter the bar with your mouse pointer, but it needs to be align just underneath the top of the bar. The picture below shows (approximately) what I want.
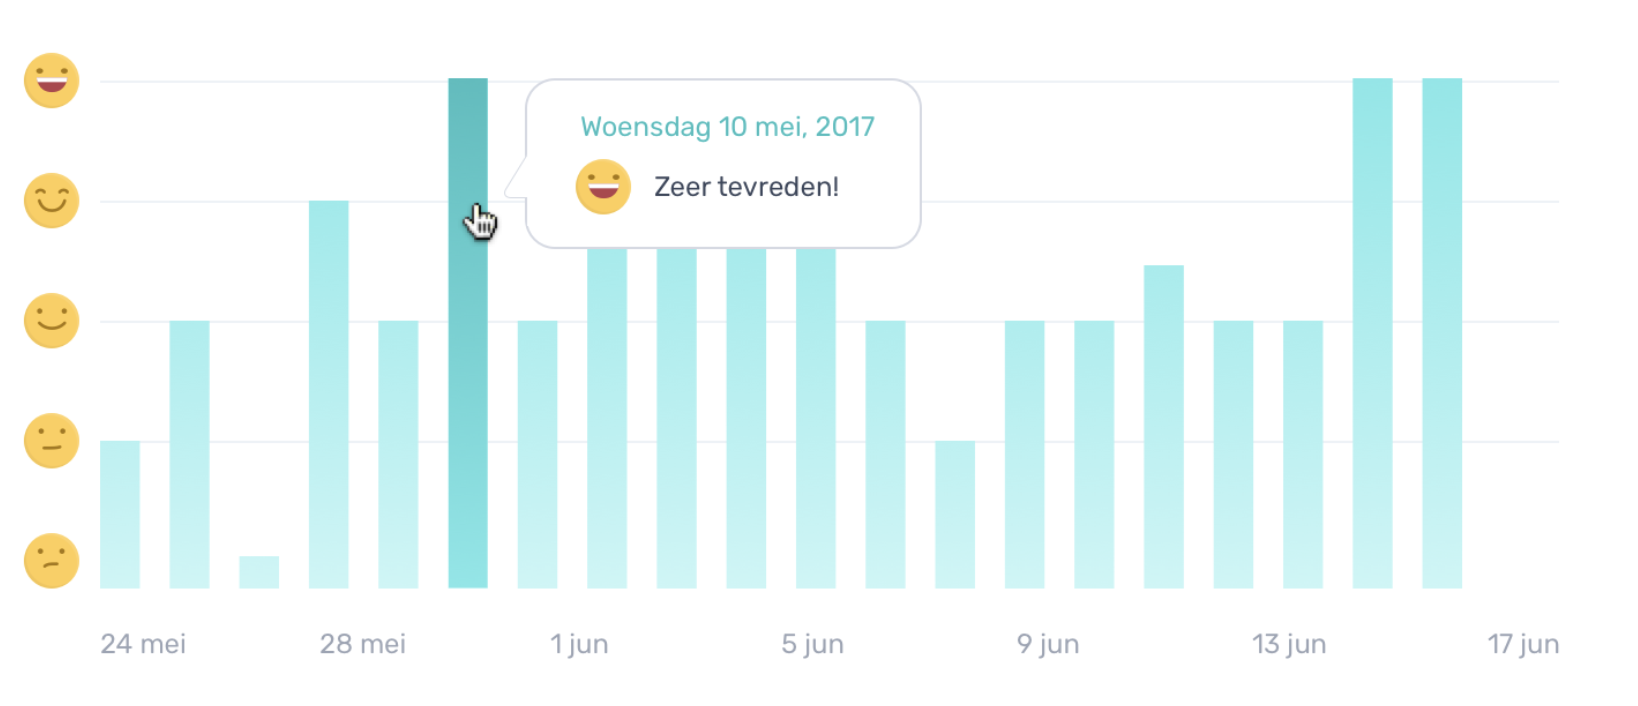
Can someone give me some directions for accomplishing this? I bet it's easy to do, but I can't find the right way to actually make this work.
  const margin = {
    top:    20,
    left:   35,
    bottom: 20,
  };

  const xMax = width - margin.left;
  const yMax = height - margin.top - margin.bottom;

  const xScale = scaleBand({
    rangeRound: [0, xMax],
    domain:     data.map(x),
    padding:    0.2,
  });

  const yScale = scaleLinear({
    range:  [yMax, 0],
    domain: [0, 5],
    nice:   true,
  });

...
        <Group top={margin.top} left={margin.left}>
          {data.map((item, index) => {
            const barHeight = yMax - yScale(y(item));
            return (
              <Group key={`bar-${item.id}`}>
                <Bar
                  x={xScale(x(item))}
                  y={yMax - barHeight}
                  height={barHeight}
                  width={xScale.bandwidth()}
                  onMouseEnter={() => (event) => {
                    console.log(event);
                  }}
                  onMouseLeave={hideTooltip}
                />
              </Group>
            );
          })}
        </Group>
Cheers and thanks in advance!
 stefanvermaas
All 3 comments
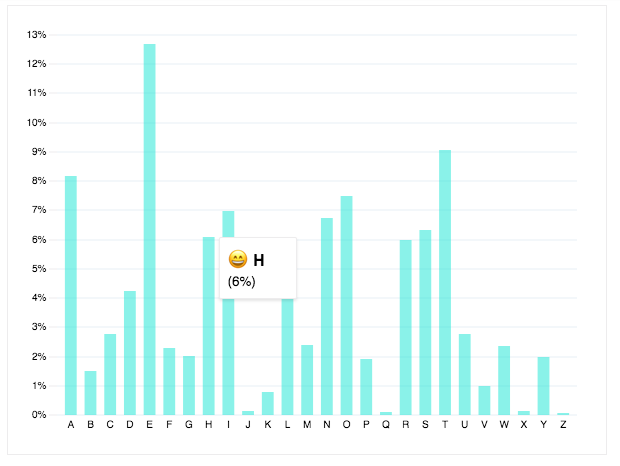
Hi @stefanvermaas, thanks for checking out vx! Here's an example of how you might do that: https://codesandbox.io/s/w6pvxmp985
 hshoff
on 3 May 2018
hshoff
on 3 May 2018
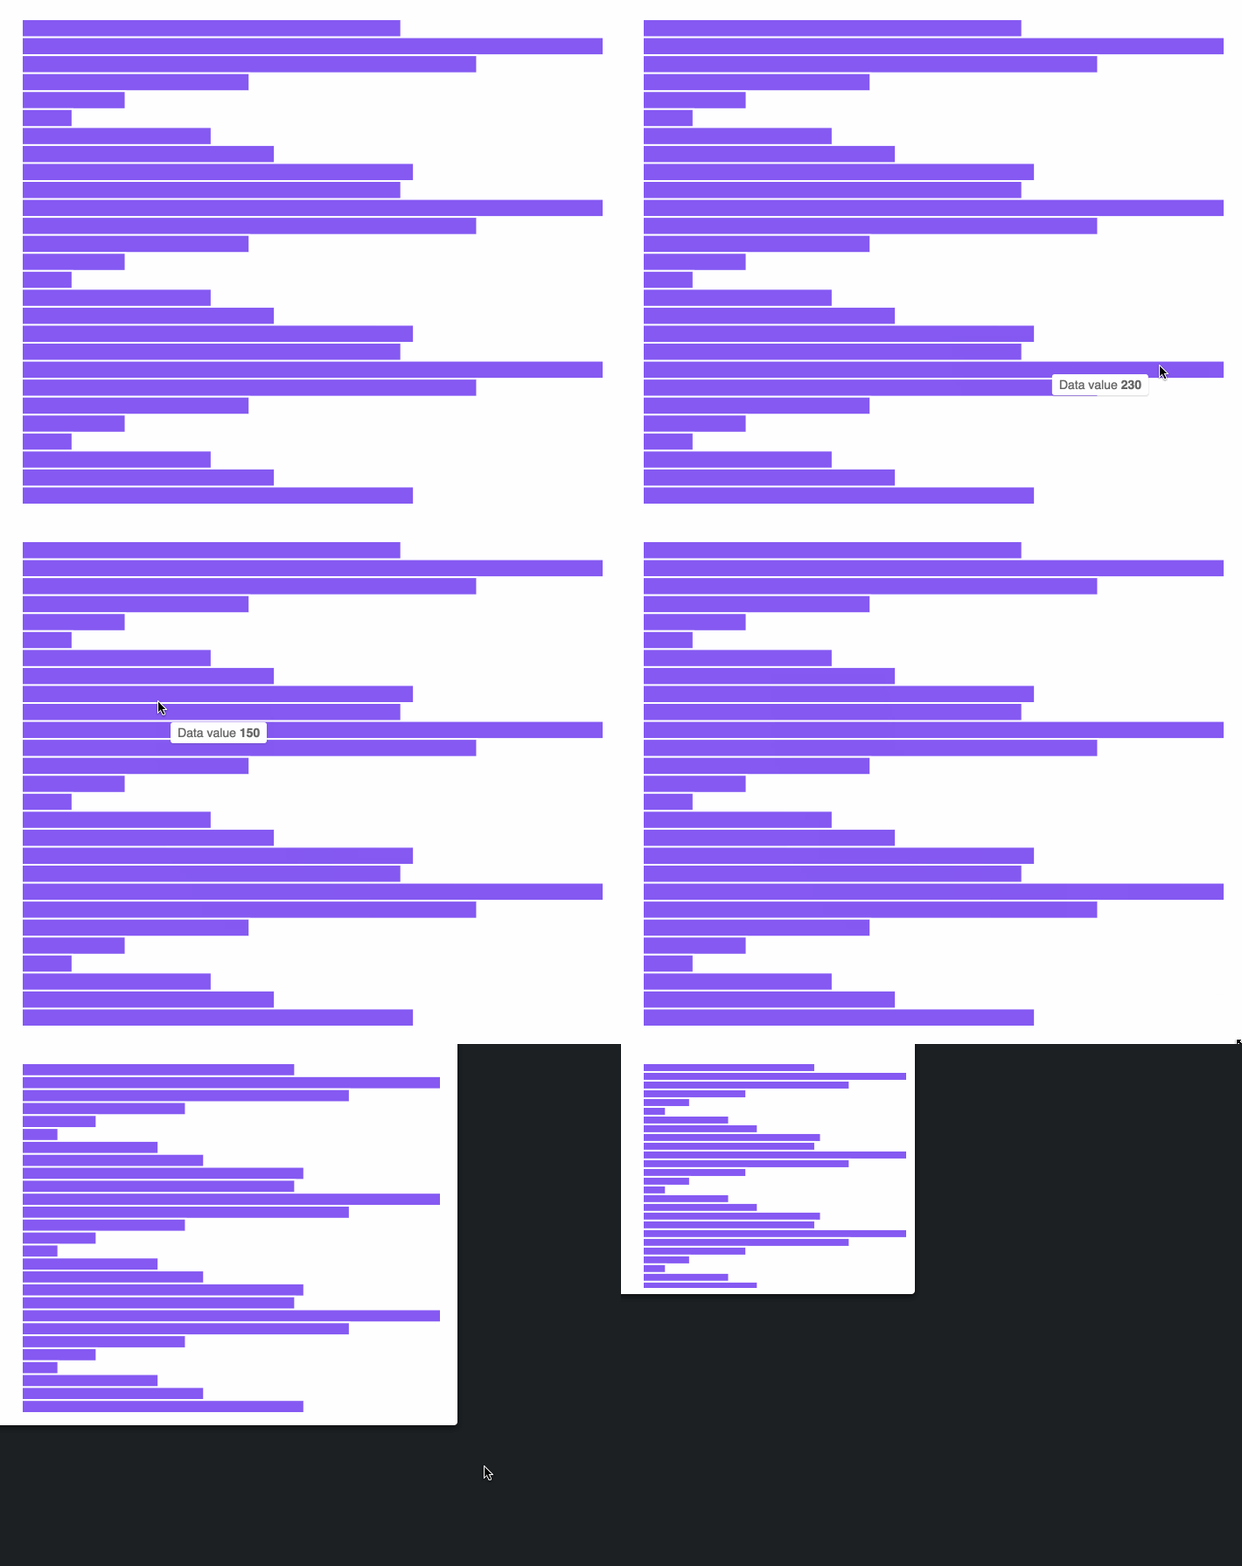
@stefanvermaas just in case it's useful, here's another example using our TooltipWithBounds component that will place the tooltip to the left (and/or top) of the pointer if placing it on the right would "overflow" the bounds of the container.
 williaster
on 3 May 2018
williaster
on 3 May 2018
Thank you both for the directions! Ultimately it was a combination of your directions that helped me to actually create the graph correctly.
I forgot to add one thing in the opening post, and this was causing the trouble eventually; I was using the ScaleSVG, which returned not the actual width and height of the outer component, but the "given" width and height. This made that the calculations for the tooltip were incorrect.
I'm now using the ParentSize component as suggested by @williaster and I've re-grouped the whole graph based on the input from @hshoff. So both; thanks!!
stefanvermaas
on 4 May 2018
Related issues
 ahmetuysal
·
3Comments
ahmetuysal
·
3Comments
 akhil9tiet
·
3Comments
akhil9tiet
·
3Comments
 esetnik
·
3Comments
esetnik
·
3Comments
 goaaron
·
3Comments
goaaron
·
3Comments
 asteroidice
·
3Comments
asteroidice
·
3Comments