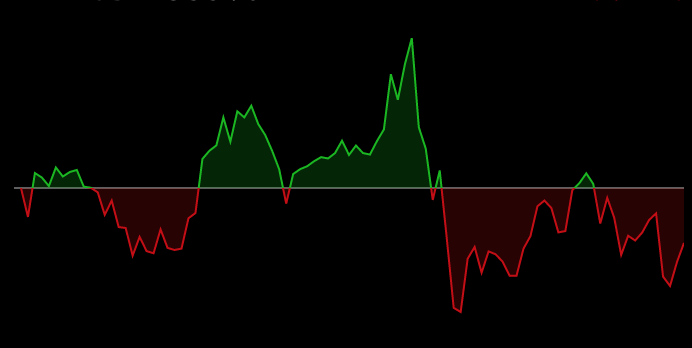
I'm trying to create a chart where the line has a different color if it's above or below given a data point.
What approach would you recommend?
Is the idea to create multiple different line charts for each section of color?
Here's an example:
Thanks in advance!
 bernatfortet
All 7 comments
Great question @bernatfortet! We were just discussing adding a "divided line" component to @vx/shape to enable doing this. Do you have a requirement to use areas or would lines suffice for you? (it'd be nice to have both ...)
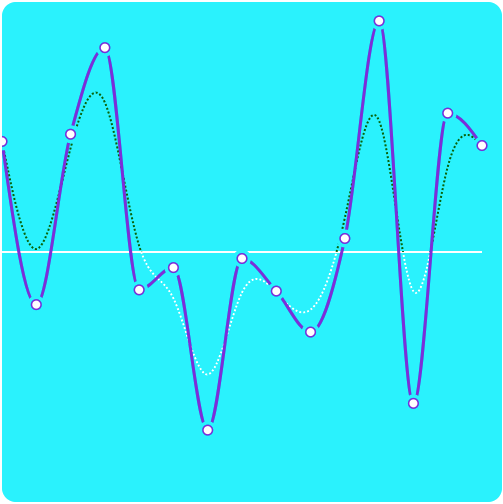
If you're interested in helping add this component we would totally welcome a PR! Otherwise we'll try to get to it soon. If you want a quick solution for a divided line, check out this vx code snippet (screenshot below) that uses a linear gradient to define multiple colors (based on this d3 block). I think for the actual component implementation we would likely choose to have multiple <path />s in order to support the area use case.
 williaster
on 20 Feb 2018
williaster
on 20 Feb 2018
I was able to use the SVG clipPath property to accomplish that. https://developer.mozilla.org/en-US/docs/Web/SVG/Element/clipPath
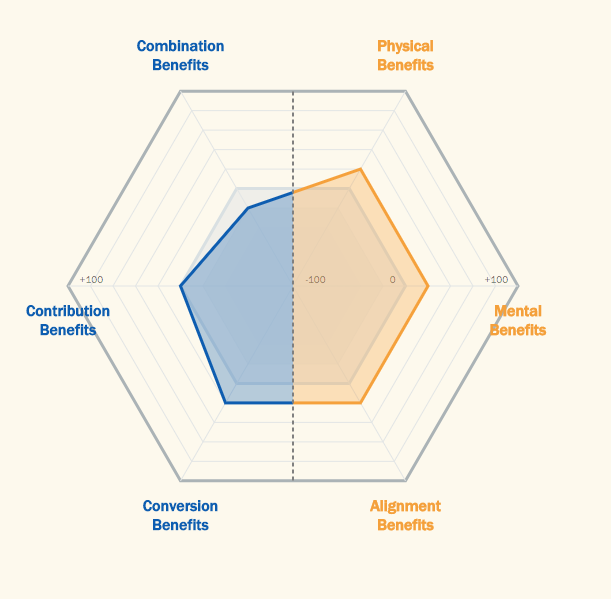
Basically, I'm rendering the line twice in both colours, and then create 2 clipPaths to hide the line where it shouldn't be shown.
 jfilipe
on 20 Feb 2018
jfilipe
on 20 Feb 2018
Thanks @williaster!
I can give it a try within the next couple of weeks.
I updated the code example to mimic what I wanted. Indeed there's some piece of code to make it work with multiple areas. Right now the area start from the base.

bernatfortet
on 20 Feb 2018
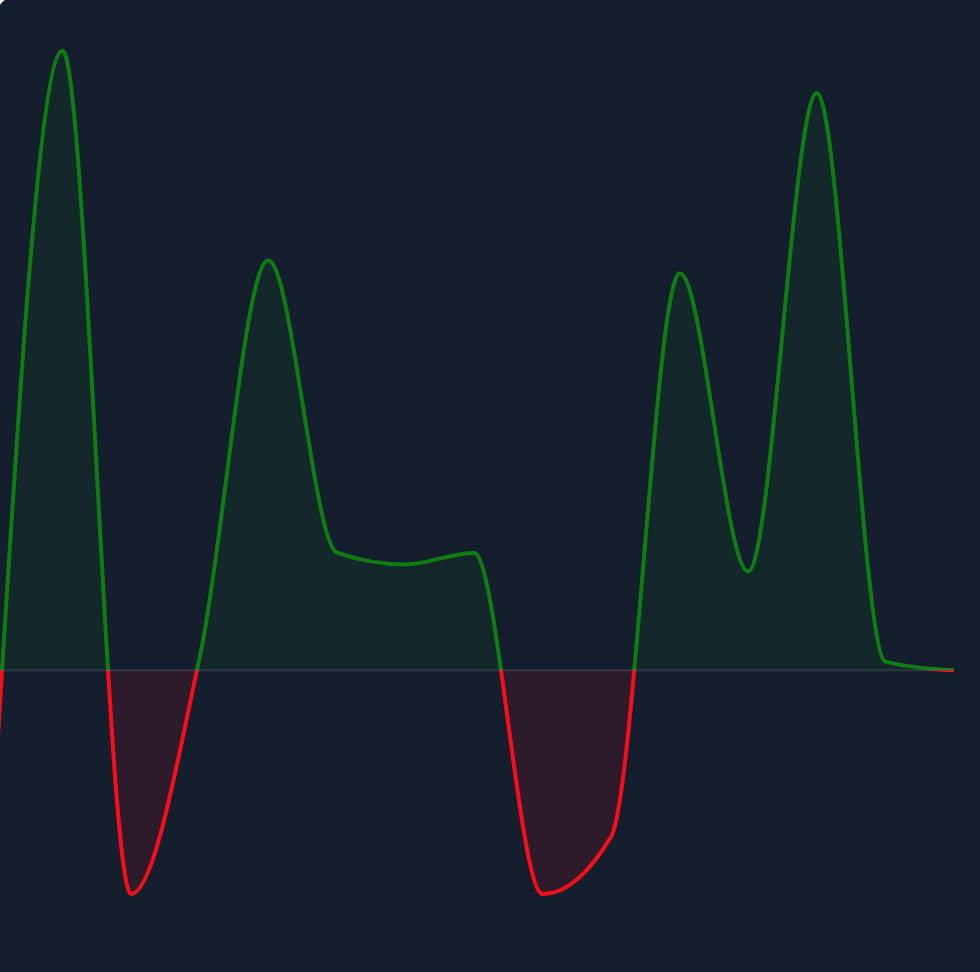
I've updated to the code sandbox to reflect @jfilipe's idea of using clip paths.
@williaster, would you want me to create a component from this code sandbox?
edit: here's the new codesandbox link: https://codesandbox.io/s/8yxp82r3qj
bernatfortet
on 4 Mar 2018
thanks @bernatfortet! that looks great! 🎉 when I click the sandbox link above tho I still see the first version (where red starts at 0). any chance it has a different url?
either way, yeah if you're down to post a PR to move that to a component in @vx/shape that'd be 🙌I bet many people would use this.
williaster
on 5 Mar 2018
Oh, sorry: here's the new link link: https://codesandbox.io/s/8yxp82r3qj
I'll try to post a PR.
bernatfortet
on 8 Mar 2018
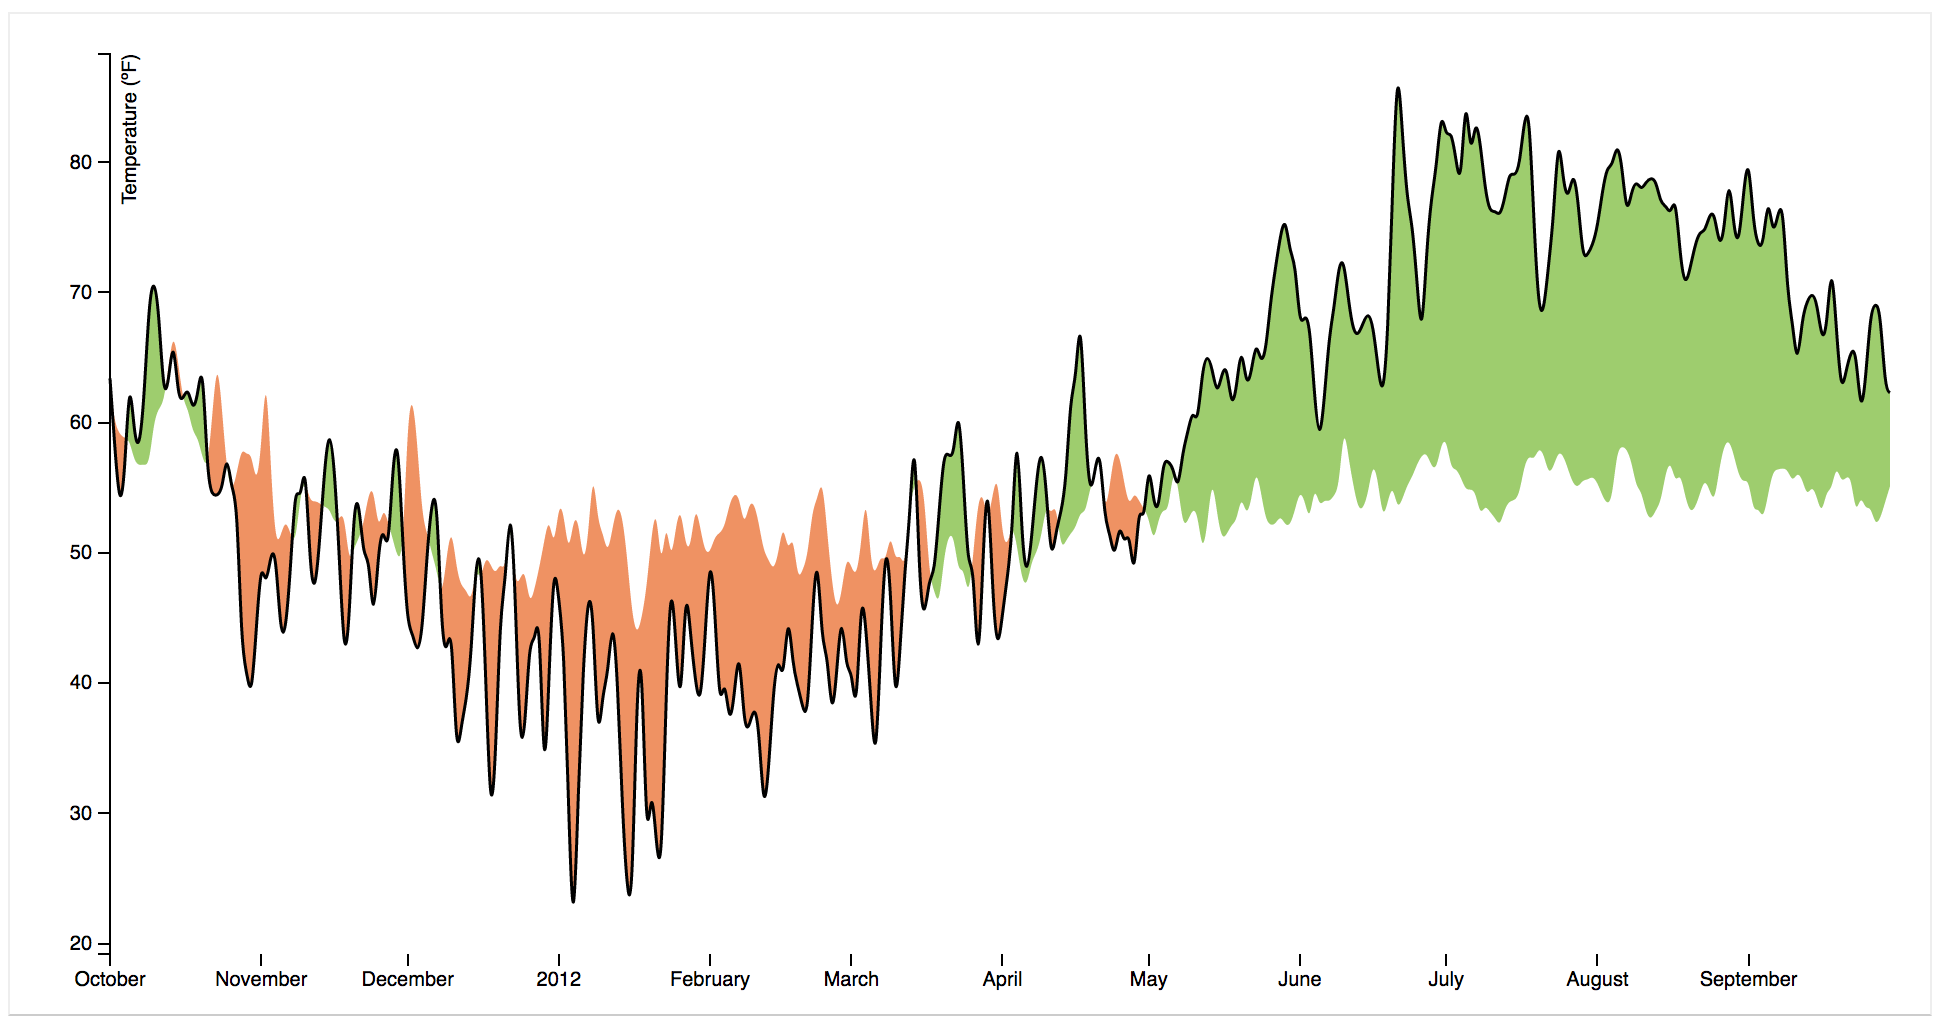
Along with a simple line threshold (straight across), it looks like this clipPath approach should work for difference charts, right?
 techniq
on 4 Apr 2018
techniq
on 4 Apr 2018
Related issues
bernatfortet
·
4Comments
 m0t0r
·
3Comments
m0t0r
·
3Comments
 crackcomm
·
5Comments
techniq
·
3Comments
crackcomm
·
5Comments
techniq
·
3Comments
 goaaron
·
3Comments
goaaron
·
3Comments
Most helpful comment
I was able to use the SVG
clipPathproperty to accomplish that. https://developer.mozilla.org/en-US/docs/Web/SVG/Element/clipPathBasically, I'm rendering the line twice in both colours, and then create 2
clipPaths to hide the line where it shouldn't be shown.