Hi,
Maybe I'm missing something very simple but I'm not sure how to create a simple stacked area chart like this:
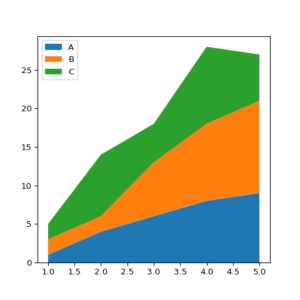
With https://vx-demo.now.sh/stacked-areas there's no white space
And with https://vx-demo.now.sh/streamgraph it goes negative (below horizontal axis)
I but it's a very simple things.
Thanks!
 bernatfortet
All 4 comments
Hi @bernatfortet, here's an example of how to do this with <AreaStack />: https://codesandbox.io/s/k3vo8682q7
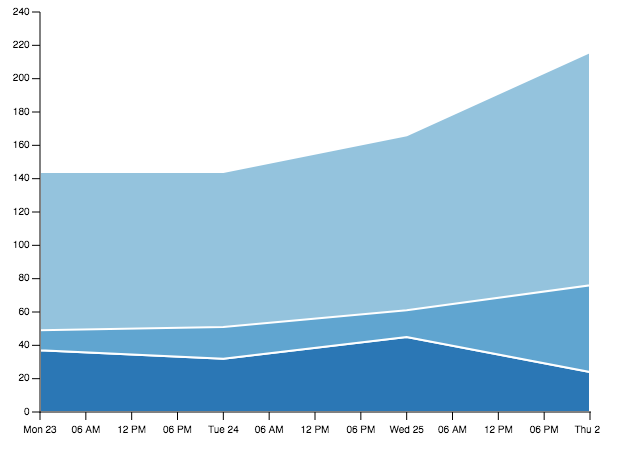
it's based on: https://bl.ocks.org/mbostock/3020685
main thing to know is
<AreaStack
  // ...
  y0={d => yScale(d[0])}
  y1={d => yScale(d[0] + d[1])}
  // ...
/>
 hshoff
on 16 Feb 2018
hshoff
on 16 Feb 2018
Thank you so much! Very helpful 👍
I'm quite new to d3 and it has always felt very intimidating. yScale still feels very cryptic to me.
Do you know of any good intro to it?
bernatfortet
on 18 Feb 2018
I have some descent guides under scales here that might help -
https://github.com/techniq/wiki/wiki/d3
On Sat, Feb 17, 2018, 6:58 PM Bernat Fortet notifications@github.com
wrote:
Thank you so much! Very helpful 👍
I'm quite new to d3 and it has always felt very intimidating. yScale still
feels very cryptic to me.
Do you know of any good intro to it?—
You are receiving this because you are subscribed to this thread.
Reply to this email directly, view it on GitHub
https://github.com/hshoff/vx/issues/243#issuecomment-366480674, or mute
the thread
https://github.com/notifications/unsubscribe-auth/AAK1RIrYuCKb2IcaBhaApSkeYH1wACEEks5tV2eSgaJpZM4SH43o
.
 techniq
on 18 Feb 2018
techniq
on 18 Feb 2018
🙏 Thanks!
bernatfortet
on 18 Feb 2018
Related issues
 danielprogramic
·
3Comments
danielprogramic
·
3Comments
 esetnik
·
3Comments
esetnik
·
3Comments
 hellosmithy
·
3Comments
hellosmithy
·
3Comments
 EfosaSO
·
4Comments
techniq
·
3Comments
EfosaSO
·
4Comments
techniq
·
3Comments